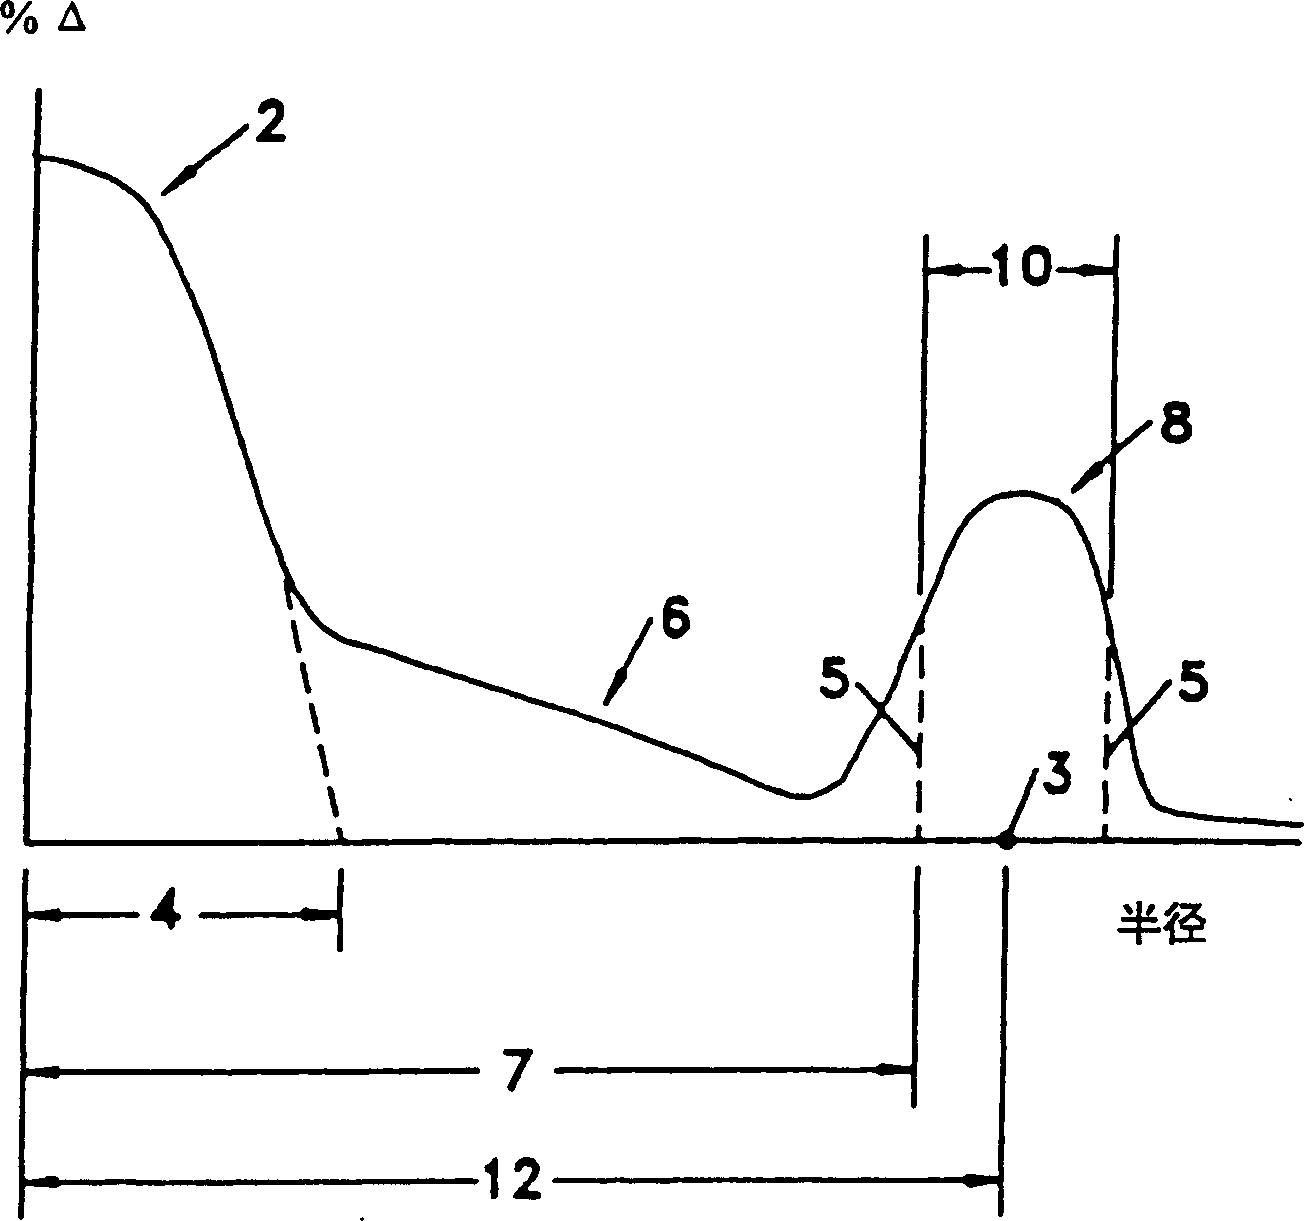
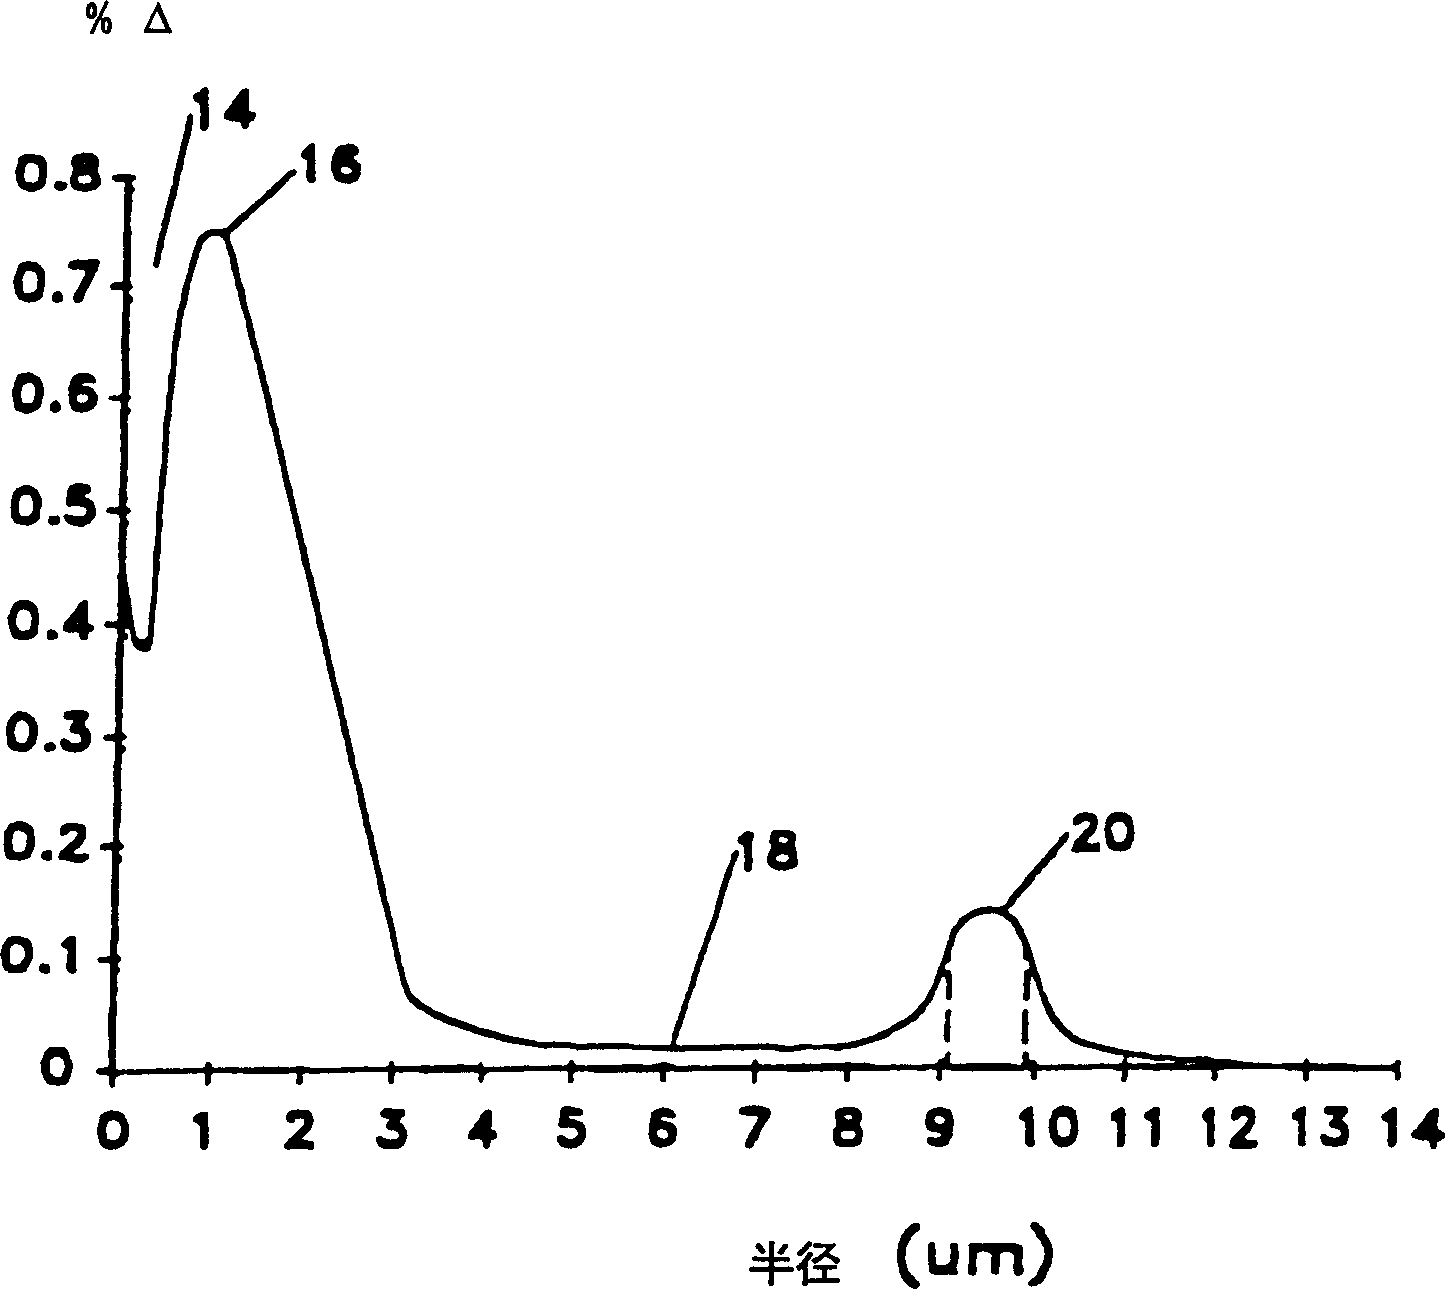
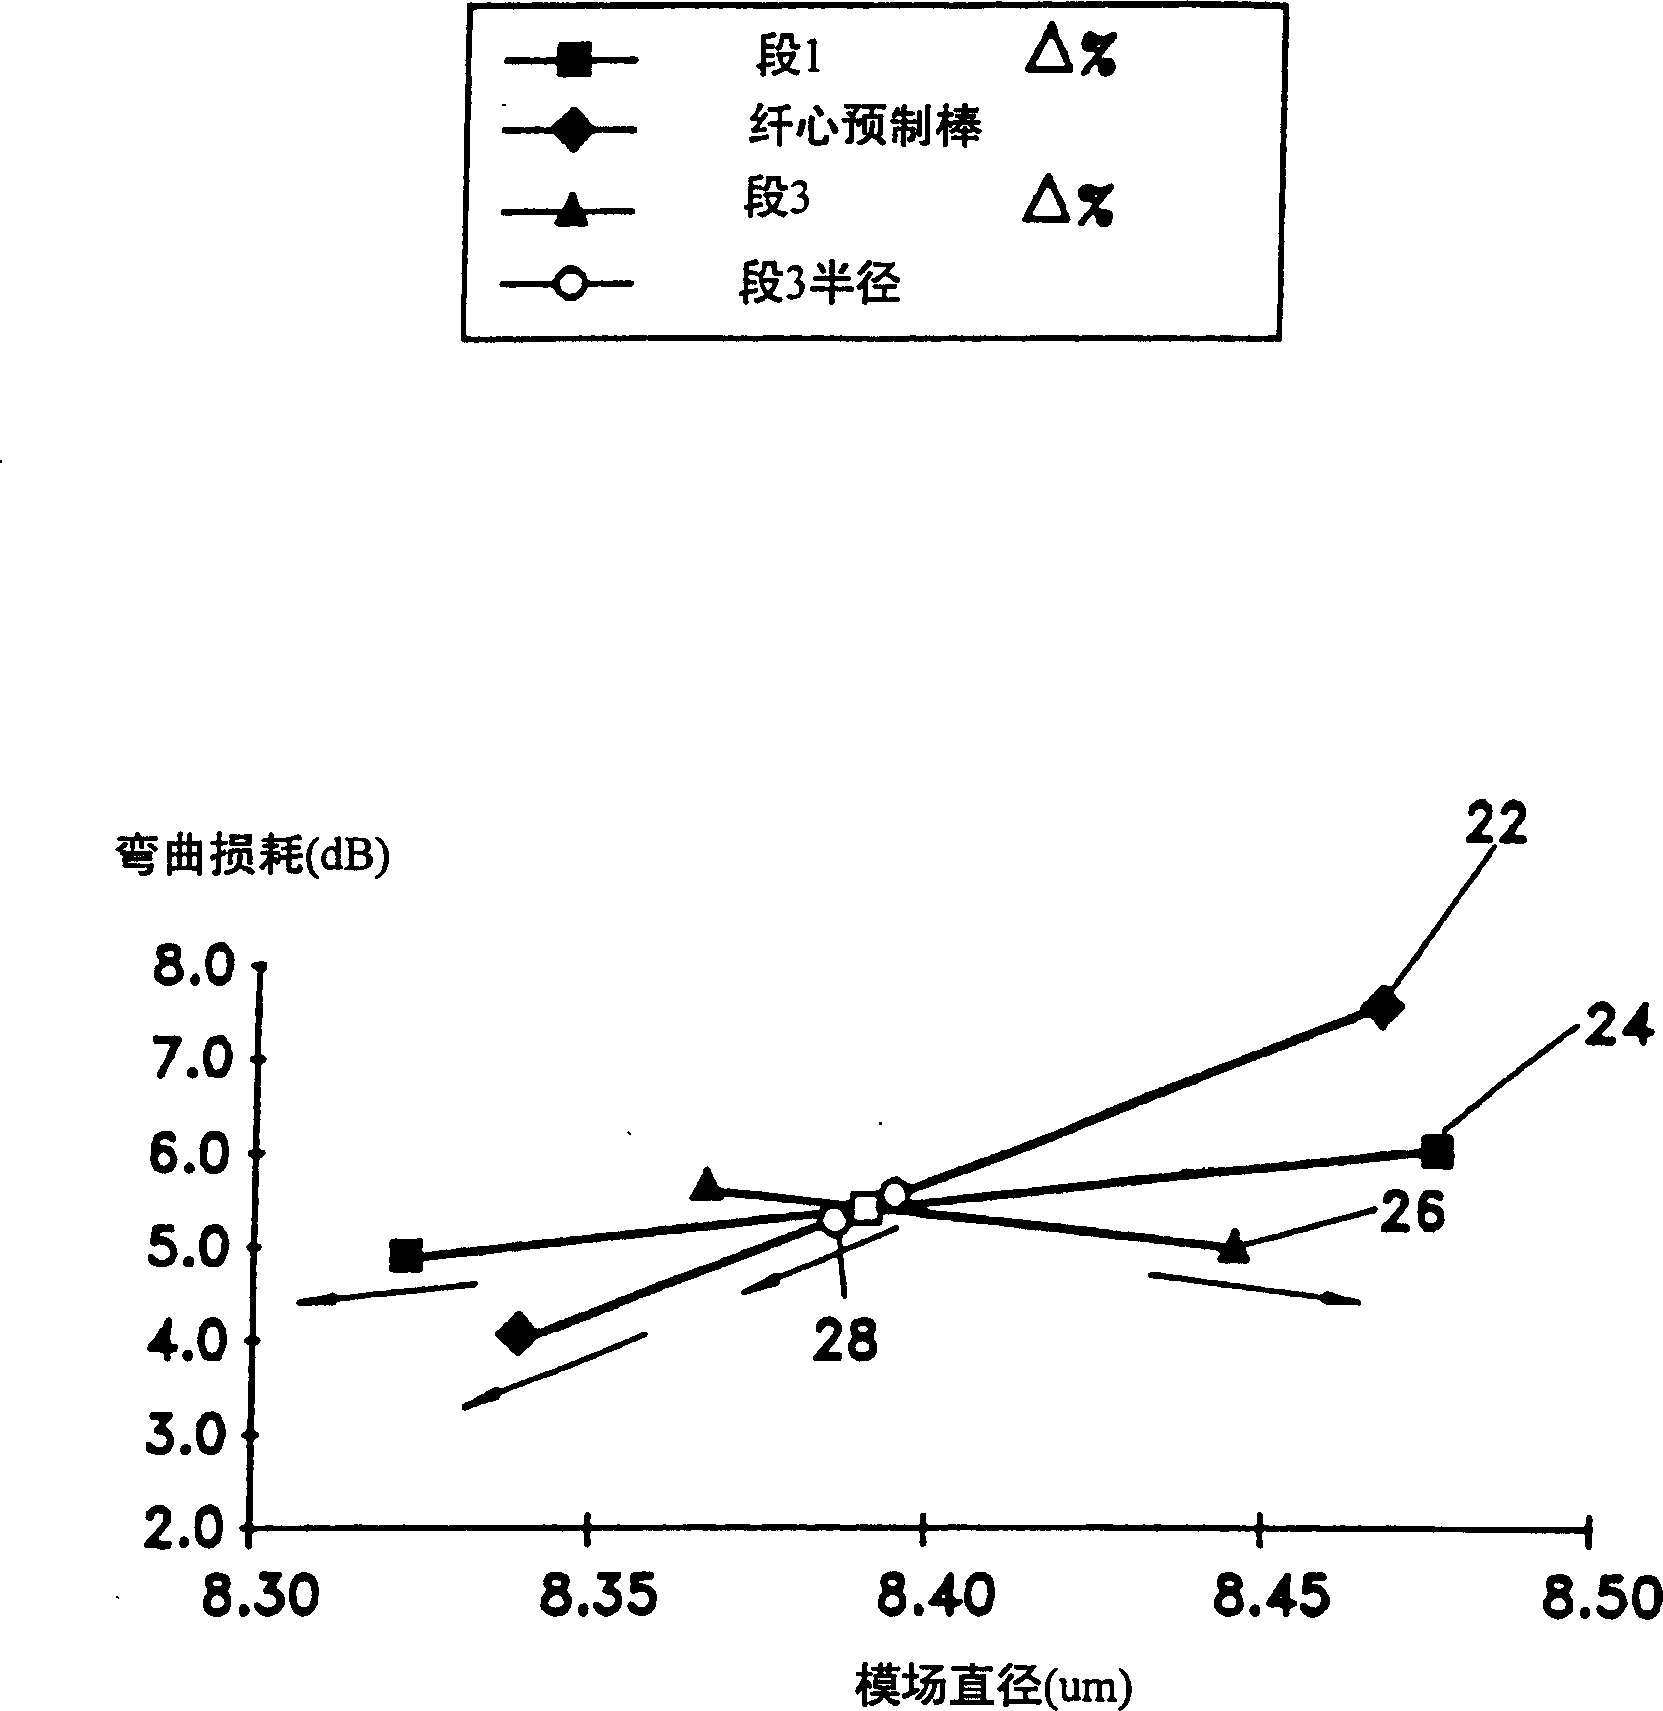
[0073] The novel optical fiber described here includes a core region with three segments. These segments are distinguished from each other by the refractive index distribution characteristics of a given segment. The three-section core area provides sufficient flexibility for the design of the optical fiber to adapt to wide functional requirements. The parameters that can be changed to provide specific fiber performance are:
[0074] Δ% of each of the three domains;
[0075] The radius of each of the three regions; and
[0076] The refractive index distribution shape of each of the three regions.
[0077] The characteristics of the novel optical fiber described here are: a positive total dispersion in the specified wavelength range of 1530nm to 1570nm to offset the nonlinear effect of SPM; a very low dispersion slope in the specified wavelength range to make WDM operation easy ; And the zero dispersion is outside the specified wavelength to limit the dispersion due to four-wave mixing. The positive dispersion is generally less than 3ps/nm/km, which can realize a longer system without regeneration. Advantageously, the specified wavelength range is substantially consistent with the peak gain curve of the erbium-doped optical amplifier. Therefore, the novel optical fiber is very suitable for systems with high bit rates or with optical amplifiers or long regenerator intervals.
[0078] In addition, the design of the core region is simple, which means that the attenuation is comparable to that of a step-index fiber, so the manufacturing cost is kept as low as possible.
[0079] The excellent waveguide characteristics and performance include the same strength characteristics and fatigue performance as the step index fiber. Moreover, the bendability of the novel fiber is as good or better than the dispersion-shifted fiber currently available. in Figure 4 Shown in is a pin array bending test confirming the relative bending performance statement. The optical fiber 32 passes on the staggered side of the pin 34. The pins are fixedly installed on the base plate 30. Tighten the fiber so that the fiber conforms to the shape of a part of the pin surface.
[0080] See figure 1 , Use 2, 6 and 8 to represent the three core segments whose refractive index profile can be adjusted. In each of these three segments, the refractive index distribution is determined by the specific refractive index at each point in the radial direction of the segment. The radial range of each segment can be adjusted to obtain better fiber characteristics. As shown in the figure, the length of the radius of the central core region 2 is represented as 4. In this case, for all simulated cases, the radius of the central core is measured from the centerline of the shaft to the point where the extrapolated central refractive index profile intersects the x-axis.
[0081] The first annular area 6 is bounded by a radius 4 and a radius 7, which extends to a perpendicular 5 drawn from the half-width point of the second annular area. The characteristic radius of the second annular region 8 is selected as the length 12, which extends from the centerline of the core to the midpoint of the base of the segment 8 (indicated by point 3). This convention of the second ring radius is used in all simulation situations. A convenient index profile measurement for a symmetric index profile is the width 10 between perpendiculars 5. Line 5 is related to the half-width point of segment 10. This convention of the second loop width is used in all simulation situations.
[0082] Example 1-Three-section positive dispersion fiber
[0083] figure 2 The refractive index distribution of the three-stage core region is shown in. The sinking of the centerline in the central refractive index profile section is caused by the diffusion of the dopant from the centerline of the optical fiber during the processing of the waveguide preform. The central section is the α refractive index distribution, which is about 1 and Δ 1 About 0.73%. The center radius is approximately 3.4 μm. The second segment is Δ 2 % Is close to zero ring segment 18 with inner and outer radii of 3. μm and 9 μm, respectively. The width of the third section 20 is about 0.95μm, Δ 3 About 0.14%, the radius to the midpoint of the segment is about 9.5 μm.
[0084] The expected performance of this waveguide is:
[0085] -λ 0 = 1511nm;
[0086] -Dispersion slope = 0.06ps/nm 2 -km;
[0087] -Mode field diameter = 8.4μm;
[0088] -In the optical fiber form, λ c =1412nm; and after the cable is formed, λ c =1100nm;
[0089] -In the wavelength range of 1530nm to 1570nm, the total dispersion is in the range of 1-3ps/nm-km; and
[0090] -Pin array bending loss=5.6dB, which is advantageous compared with the 8dB average value of the three-segment waveguide loss of negative dispersion.
[0091] Note that the fiber of Example 1 meets every specification of a high-performance single-mode fiber designed for WDM, limited four-wave mixing, reduced SPM, and use with an erbium-doped optical amplifier.
[0092] Figure 3a , 3b The four pictures, 3c and 3d show the insensitivity of this novel optical fiber to changes in the core area parameters.
[0093] Example 2-bending loss and mode field sensitivity
[0094] Figure 3a It is a graph of bending loss versus mode field radius, where Δ%=0.73% can be varied within +/-0.01Δ%. The radius of the core preform before drawing can be changed by about 2.5%, and the radius of the core preform before drawing is generally in the range of 3.5mm-6mm. The specific radius is selected as a parameter, because the change of the core preform radius may cause different relative segment intervals and segment radius differences. For the third segment, Δ 3 % Is 0.18%+/-0.05%. The radius of the third section is 9.6 μm +/- 0.25 μm.
[0095] In order to produce Figure 3a The curves 22, 24, and 28 keep the three parameters at their midpoints, and the fourth parameter changes between its upper and lower limits. Therefore, by calculating the radius of the preform to be 3.5mm, Δ 3 % Is 0.18%, r 3 9.6μm and Δ 1 The line 24 is obtained by varying the bending loss and mode field diameter in the range of 0.72% to 0.74%. Similarly, by calculating Δ 1 % Is 0.73%, Δ 3 % Is 0.18%, r 3 The line 22 is obtained by bending loss and mode field diameter when the diameter of the preform is 9.6 μm and the diameter of the preform varies within the range of 3.5 μm +/- 2.5%. Similarly, curves 26 and 28 are generated, and the specific parameter value is Δ 3 % Is 0.18%+/-0.05%, r 3 It is 9.6μm+/-0.25μm.
[0096] As mentioned above, in particular, the core area parameters can be changed, while the bending loss remains below 8dB, and the mode field diameter remains within the range of 8.30μm to 8.5μm.
[0097] Table 1 shows the midpoint value and range of the refractive index parameters of each core region, which define the novel refractive index distribution family.
[0098] Δ 1 %
[0099] Example 2-Waveguide cutoff and mode field diameter
[0100] See Figure 3b , The four curves shown here are based on Figure 3a The inner curve is generated in a similar way.
[0101] Please note that for segment 1 Δ 1 %, preform radius and r 3 The described change and cut-off wavelength are within a very narrow range of 1350nm to 1450nm. When the radius of the preform changes within its predetermined range of approximately 3.5 mm +/- 2.5%, a larger cut-off wavelength change can be seen. However, even in this case, the optical fiber still has all the functions, because the cut-off wavelength of the cable will be below about 1100nm. Generally, the cabling will be reduced by about 400 nm relative to the cut-off wavelength of the fiber measured before further processing.
[0102] The change of the mode field diameter is again restricted to a narrow range of 8.30μm to 8.5μm.
[0103] Example 3-Zero dispersion wavelength and mode field diameter
[0104] As in the above examples 1 and 2, the four core area parameters can be changed within the selected value range. See Figure 3c , The mode field diameter is in the range of 8.3μm to 8.5μm, the zero dispersion wavelength λ 0 It is advantageously limited to a range of approximately 1500 nm to 1520 nm. Therefore, when the parameters of the core region of the novel fiber have a large change, λ 0 It remains in the WDM region that is consistent with the peak gain range of the erbium-doped optical amplifier, that is, 1530nm to 1570nm.
[0105] Example 4-Total dispersion slope and mode field diameter
[0106] Such as Figure 3d As shown, when the core parameters are selected in their respective ranges, the mode field is in the range of 8.3μm to 8.5μm, and the total dispersion slope is 0.059 to 0.061ps/nm 2 -km within this narrow range.
[0107] Observe these four graphs, Figure 3a , 3b , 3c and 3d, it is obvious that the mode field diameter has an effect on r 3 Scheduled changes are not sensitive. Moreover, it can be seen that the four parameters studied in these examples have substantially equal effects on the variation of the dispersion slope. The cluster of points on the sensitivity curve of Fig. 3 strongly shows that it is easy to manufacture the novel positive dispersion core region design.
[0108] We anticipate even greater flexibility using manufacturing tolerances for key core area parameters. We know that these parameters affect each other, so we can change the effect of one parameter to eliminate the effect of another parameter change. Therefore, study the parameter changes in pairs or groups of three or more to determine a wider family of core designs that give positive dispersion and those characteristics of high-performance fibers in the critical wavelength range.