
Automated diagnostic testing of databases and configurations for performance analytics visualization software

a technology of performance analytics and automatic diagnostic testing, applied in the direction of error detection/correction, instruments, computing, etc., can solve the problems of unimportant client devices, unknowing exact physical location, connectivity, and negative impact on enterprise's ability to run and grow business, etc., to achieve the effect of rapid identification and correction of misconfigurations

Active Publication Date: 2019-02-26
SERVICENOW INC
View PDF6 Cites 15 Cited by
  • Summary
  • Abstract
  • Description
  • Claims
  • Application Information

AI Technical Summary

Benefits of technology

The patent text describes a system that can diagnose and fix problems in a network management platform. The system can run tests and collect data, which can be stored in a database. Users can access the data on a client device and quickly identify and fix any issues. The technical effect of this is that it allows for more efficient and effective management of networks, reducing downtime and improving overall performance.

Problems solved by technology

It negatively impacts an enterprise's ability to run and grow its business, innovate, and meet regulatory requirements.
The enterprise may find it difficult to integrate, streamline and enhance its operations due to lack of a single system that unifies its subsystems and data.
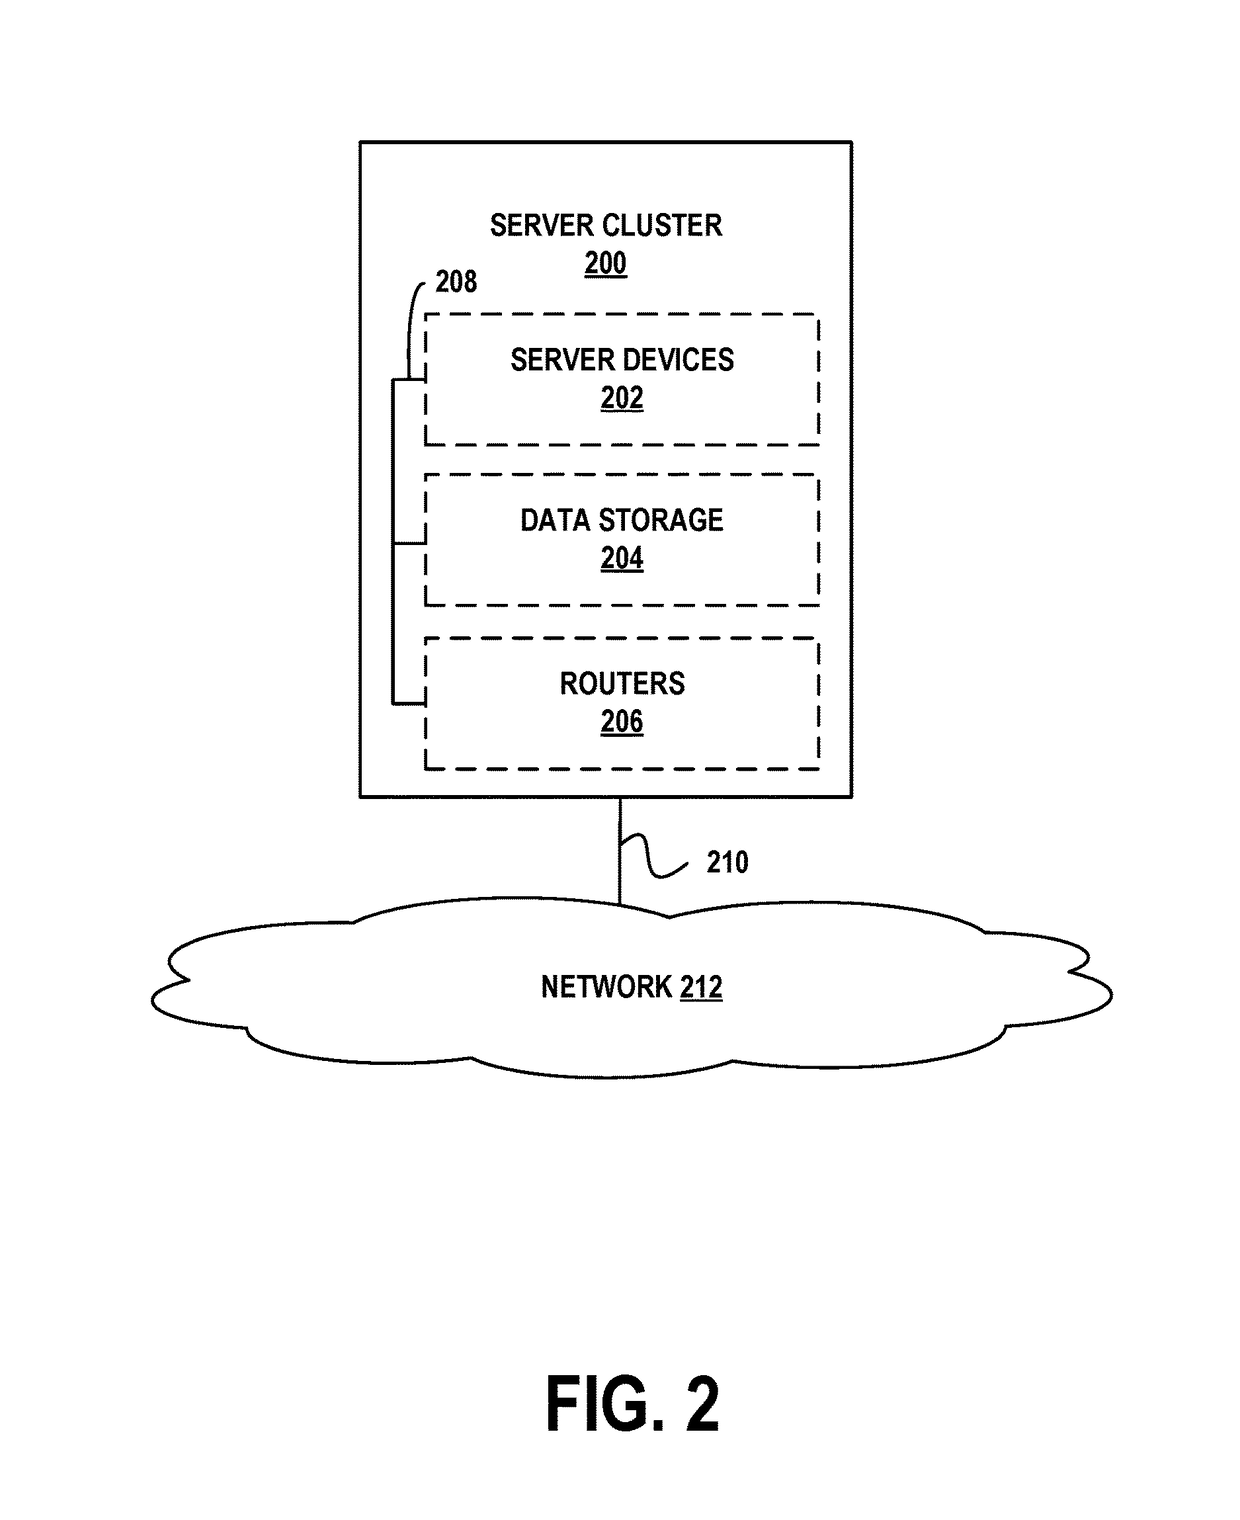
The exact physical location, connectivity, and configuration of these computing devices may be unknown and / or unimportant to client devices.
To the extent that these computing tasks can be performed in parallel, such a distribution of tasks may reduce the total time to complete these tasks and return a result.
As a consequence, a security breach in this system may impact all customers' data, creating additional risk, especially for entities subject to governmental, healthcare, and / or financial regulation.
Furthermore, any database operations that impact one customer will likely impact all customers sharing that database.
Thus, if there is an outage due to hardware or software errors, this outage affects all such customers.
Likewise, if the database is to be upgraded to meet the needs of one customer, it will be unavailable to all customers during the upgrade process.
Often, such maintenance windows will be long, due to the size of the shared database.
Maintenance down time is limited because the database only contains one customer's data.
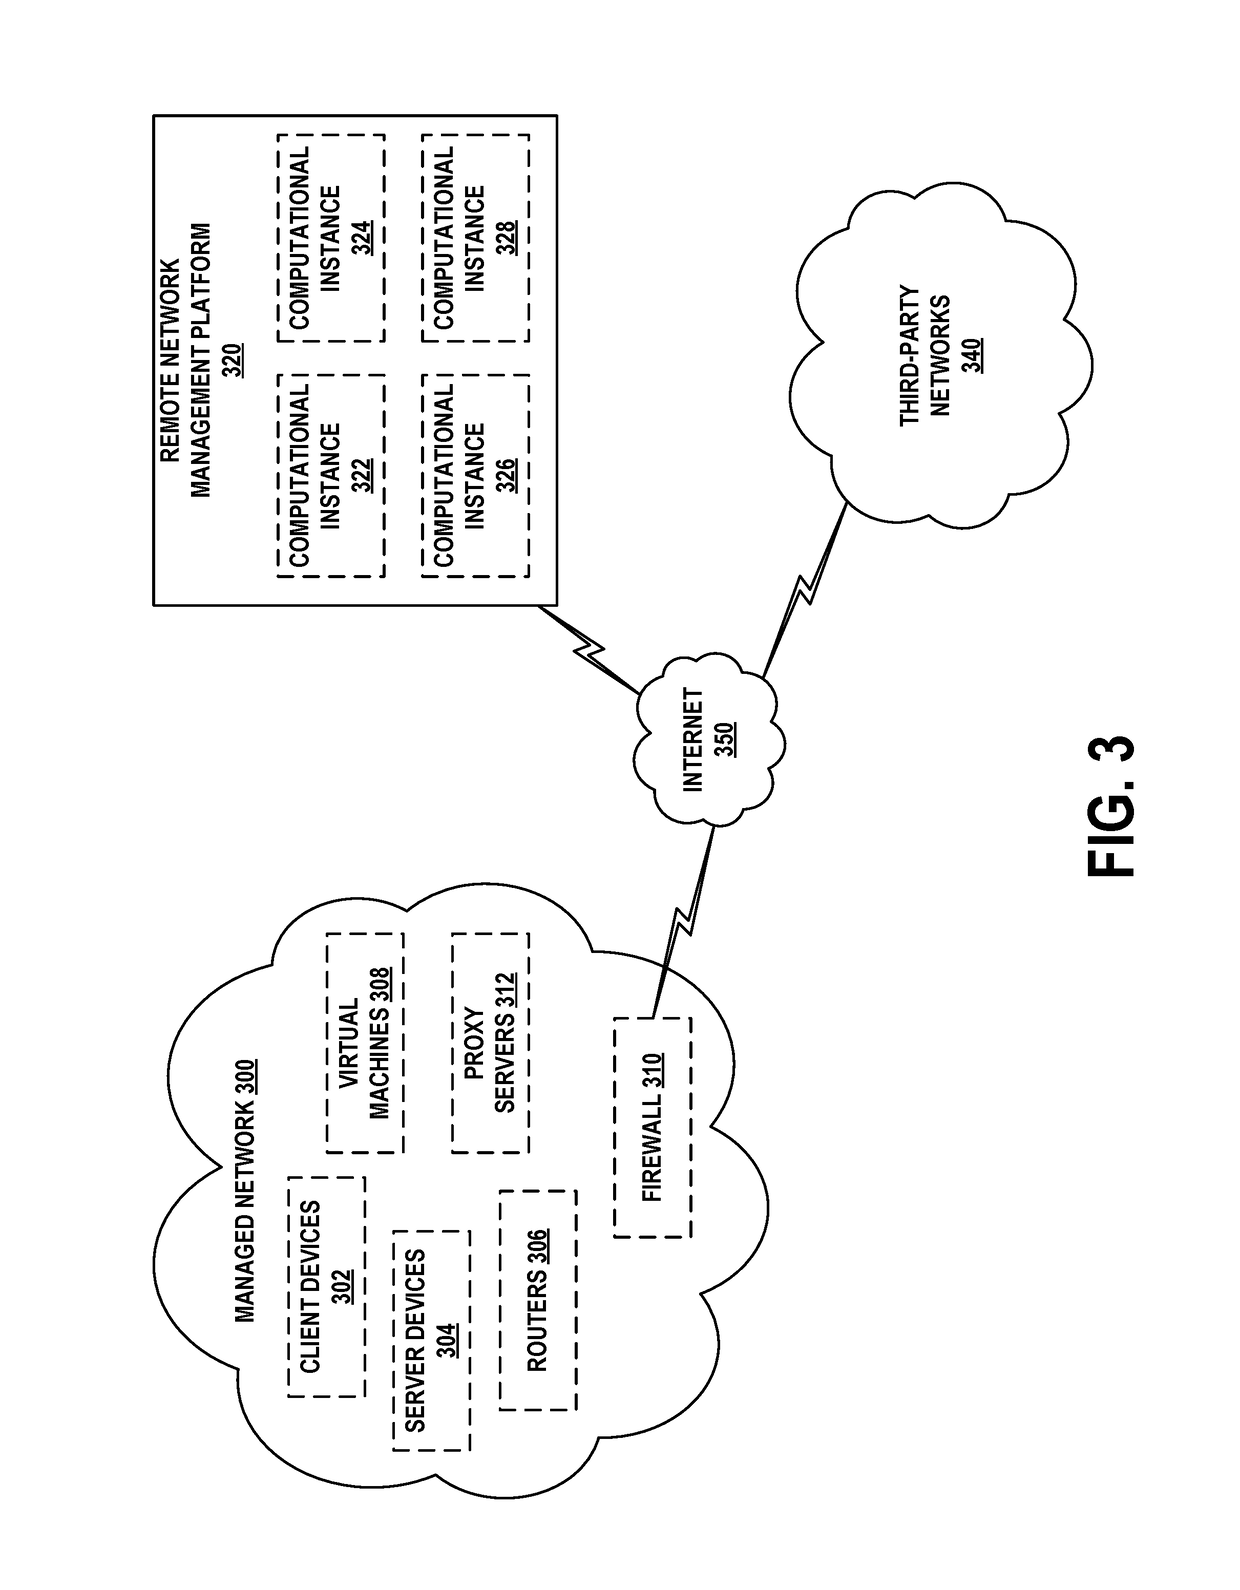
These tasks may result in proxy servers 312 logging on, or otherwise accessing information from the particular device.
Thus, if the server device is taken out of operation for maintenance, it is clear that the employee onboarding service and payroll service will be impacted.
These incidents may be, for example, trouble tickets or help requests opened with an IT organization.
Each incident may therefore involve a particular problem that a user has experienced, such as a computer crashing, a user being unable to log on to a service, slow performance of a service, a request for new equipment, and so on.
As such, if any of the database tables, or entries within these tables, that are relied on by the visualization software are missing, the visualization may fail.
Moreover, inefficiently designed visualization tasks, such as reading a whole table to access just a few entries or trying to combine too many KPIs in a single visualization, can leads to performance degradation in not only performance analytics tasks, but also for the computational instance in general.
Table 1 also includes a “warning” severity, indicating that an associated KPI or dashboard will likely display at least some data properly, but the KPI or dashboard are misconfigured in some fashion that may cause some data to be improperly displayed or not displayed at all.
This will likely cause the script to fail and / or the dashboard to be not displayable.
An active diagnostic test can be performed by the diagnostic program, and an inactive diagnostic test might not be able to be performed by diagnostic program.

Method used


Image

  • Automated diagnostic testing of databases and configurations for performance analytics visualization software
  • Automated diagnostic testing of databases and configurations for performance analytics visualization software
  • Automated diagnostic testing of databases and configurations for performance analytics visualization software

Examples


Embodiment Construction

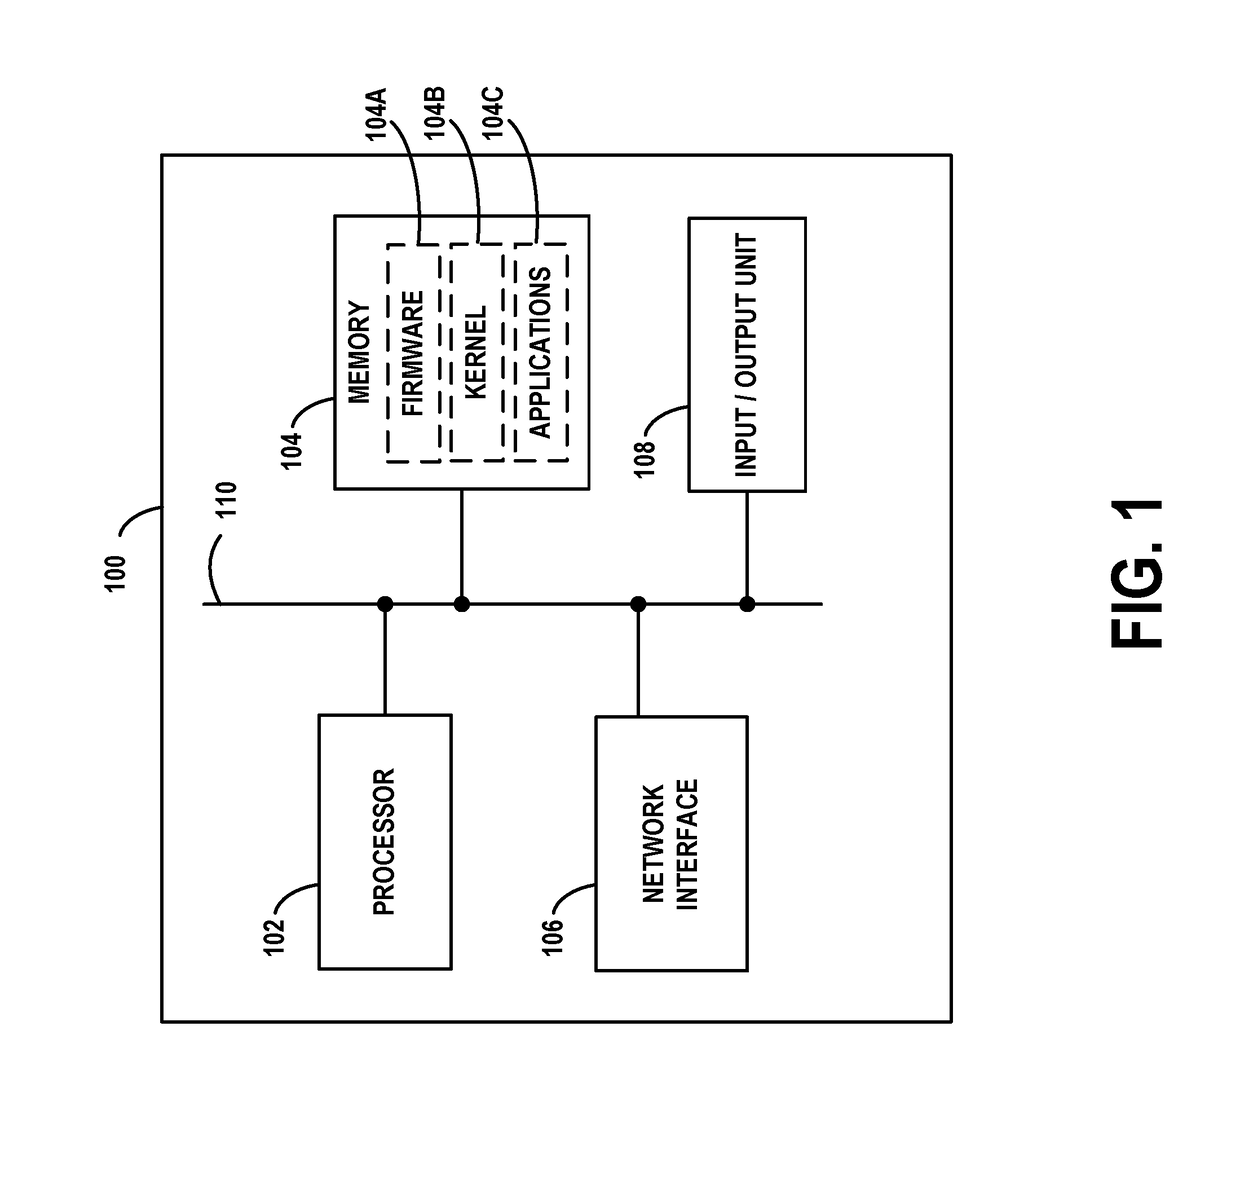
[0026]Example methods, devices, and systems are described herein. It should be understood that the words “example” and “exemplary” are used herein to mean “serving as an example, instance, or illustration.” Any embodiment or feature described herein as being an “example” or “exemplary” is not necessarily to be construed as preferred or advantageous over other embodiments or features unless stated as such. Thus, other embodiments can be utilized and other changes can be made without departing from the scope of the subject matter presented herein.

[0027]Accordingly, the example embodiments described herein are not meant to be limiting. It will be readily understood that the aspects of the present disclosure, as generally described herein, and illustrated in the figures, can be arranged, substituted, combined, separated, and designed in a wide variety of different configurations. For example, the separation of features into “client” and “server” components may occur in a number of ways....


PUM


Abstract

A system may include a performance analytics database defining key performance indicators (KPIs) associated with the managed network and defining dashboards that are configured to specify, on a performance analytics graphical user interface (GUI) within a managed network, graphical representations of the KPIs. The system may also include a diagnostic database containing representations of a plurality of tests configured to determine whether the KPIs and the dashboards comply with pre-defined rules. The system may also include a computing device operational to execute a diagnostic software program configured to: obtain a representation of a particular test that includes a plurality of rules; apply each of the rules to the KPIs and the dashboards stored in the performance analytics database; and write, when applying at least one of the rules indicates a problem, an associated severity, problem description, and solution description to the diagnostic database as output of the particular test.

Description

BACKGROUND[0001]Managed networks may include various types of computer networks that can be remotely administered. This management may involve one or more computing devices disposed with a remote network management platform collecting information about the configuration and operational states of software applications executing on behalf on the managed network, and then presenting representations of this information by way of one or more user interfaces. The user interfaces may be, for instance, web-based user interfaces.[0002]Some of the collected information may relate to key performance indicators (KPIs). KPIs include any sort of measurement, reading, or data that is relevant to the managed network. Thus, KPIs may reflect performance of computing devices on the network itself (e.g., memory utilization, processor utilization, transactions per second) or performance of higher-level applications executing on the remote network management platform (e.g., a number of times per day that...

Claims


Application Information

Patent Timeline
IPC IPC(8): G06F9/44G06F11/36
CPCG06F11/3676G06F16/2455G06F16/217G06F11/3616
Inventor RUTTEN, ONG-AATASBI, NABIL ABU
Owner SERVICENOW INC
Learn More