
Method for generating contrast agent concentration map

a technology of concentration map and contrast agent, applied in the field of computed tomography applications, can solve the problems of insufficient accuracy of registration results, inability to accurately register volumetric spatial data, and significant inaccuracy of dual-energy iodine maps and virtual non-contrast images, etc., and achieve the effect of increasing the readability of the final map

Active Publication Date: 2019-02-26
KONINKLJIJKE PHILIPS NV
View PDF12 Cites 2 Cited by
  • Summary
  • Abstract
  • Description
  • Claims
  • Application Information

AI Technical Summary

Benefits of technology

This approach enhances the accuracy and quality of contrast agent concentration maps by improving spatial registration and reducing artifacts, providing better diagnostic images, especially in low-dose scans, by leveraging both registration-subtraction and spectral analysis techniques.

Problems solved by technology

Eventually, dual-energy iodine maps and virtual non-contrast (VNC) images tend to sufferer from significant inaccuracies and artifacts especially in low-dose spectral Computed Tomography scans.
The disadvantage of the two-scan subtraction technique is that a very accurate volumetric spatial registration is required.
Although quite good registration algorithms are already available, commercially and in research, the registration results are still not accurate enough in many cases, and miss-registration artifacts exist in the subtraction results.
In addition, performing two scans requires somewhat more complicated and time consuming clinical workflow and patient planning, than just performing a single contrasted scan with spectral Computed Tomography.
A limitation in both techniques is that in order to improve the iodine map appearance, it is common in both methods to apply relatively strong filters to reduce noise and artifacts from the obtained iodine maps, these techniques often degrade significantly the map spatial resolution and the detectability of small features and structures with relatively low iodine concentration.

Method used


Image

  • Method for generating contrast agent concentration map
  • Method for generating contrast agent concentration map
  • Method for generating contrast agent concentration map

Examples


Embodiment Construction

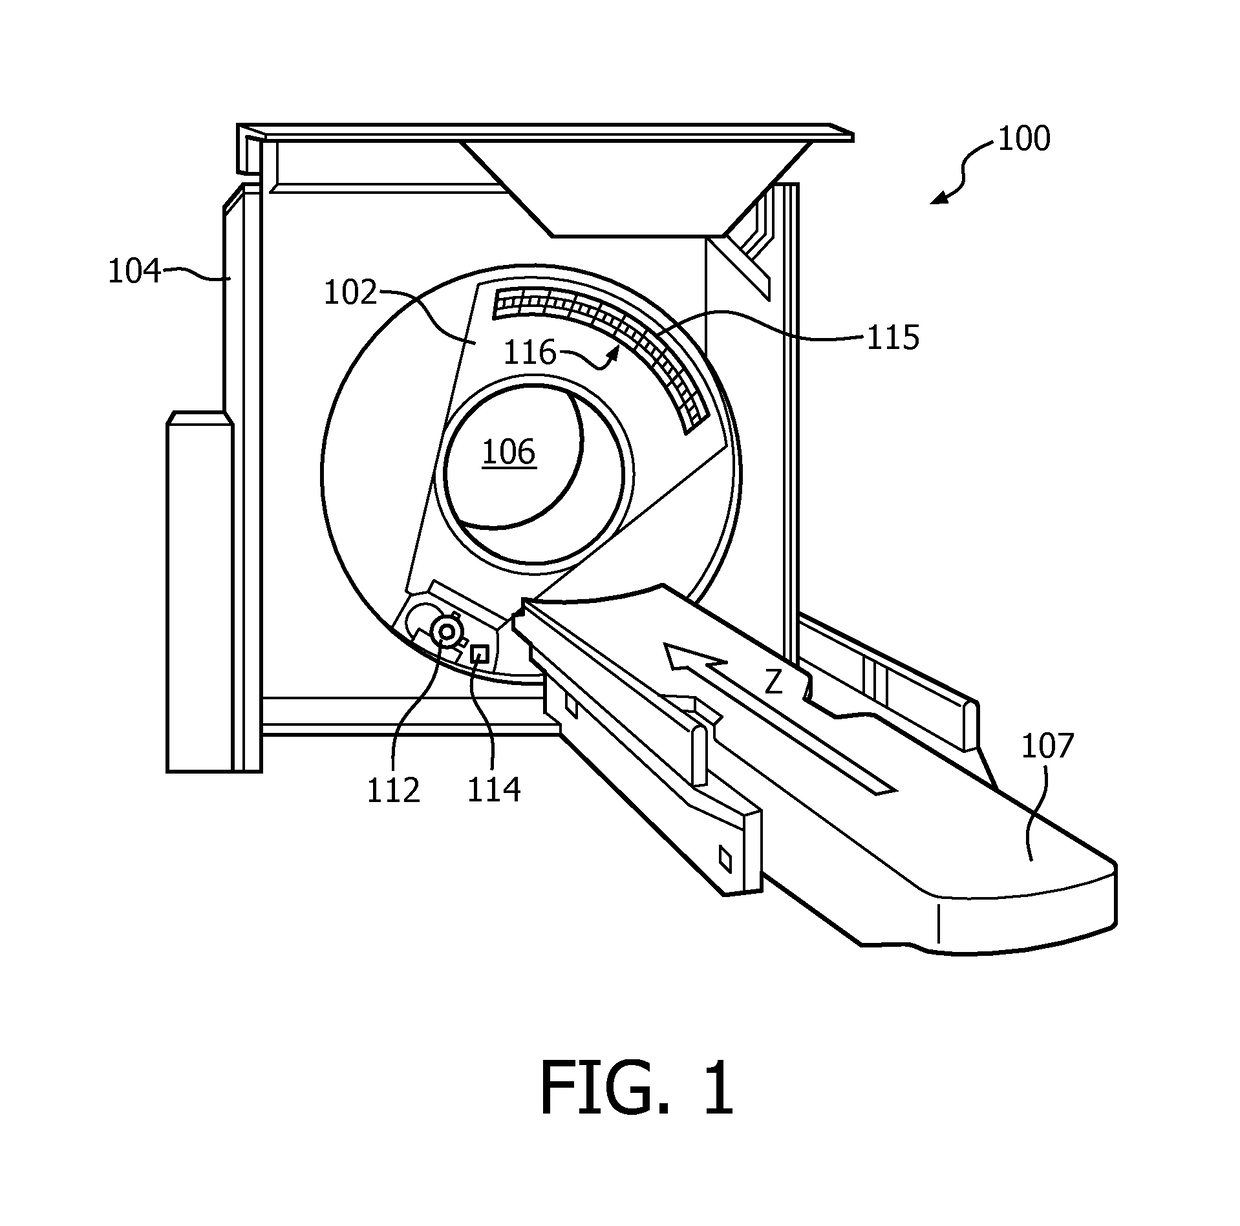
[0044]FIG. 1 schematically illustrates an example imaging system 100, such as a computed tomography (CT) scanner. The imaging system 100 includes a rotating gantry 102 and a stationary gantry 104. The rotating gantry 102 is rotatably supported by the stationary gantry 104. The rotating gantry 102 is configured to rotate around an examination region 106 about a longitudinal or z-axis. The imaging system 100 further includes a subject support 107 that supports a subject or object in the examination region 106 before, during and / or after scanning. The subject support 107 can also be used to load and / or unload the subject or object into or from the examination region 106. The imaging system 100 further includes a radiation source 112, such as an x-ray tube, that is rotatably supported by the rotating gantry 102. The radiation source 112 rotates with the rotating gantry 102 around the examination region 106 and is configured to generate and emit radiation that traverses the examination r...


PUM


Abstract

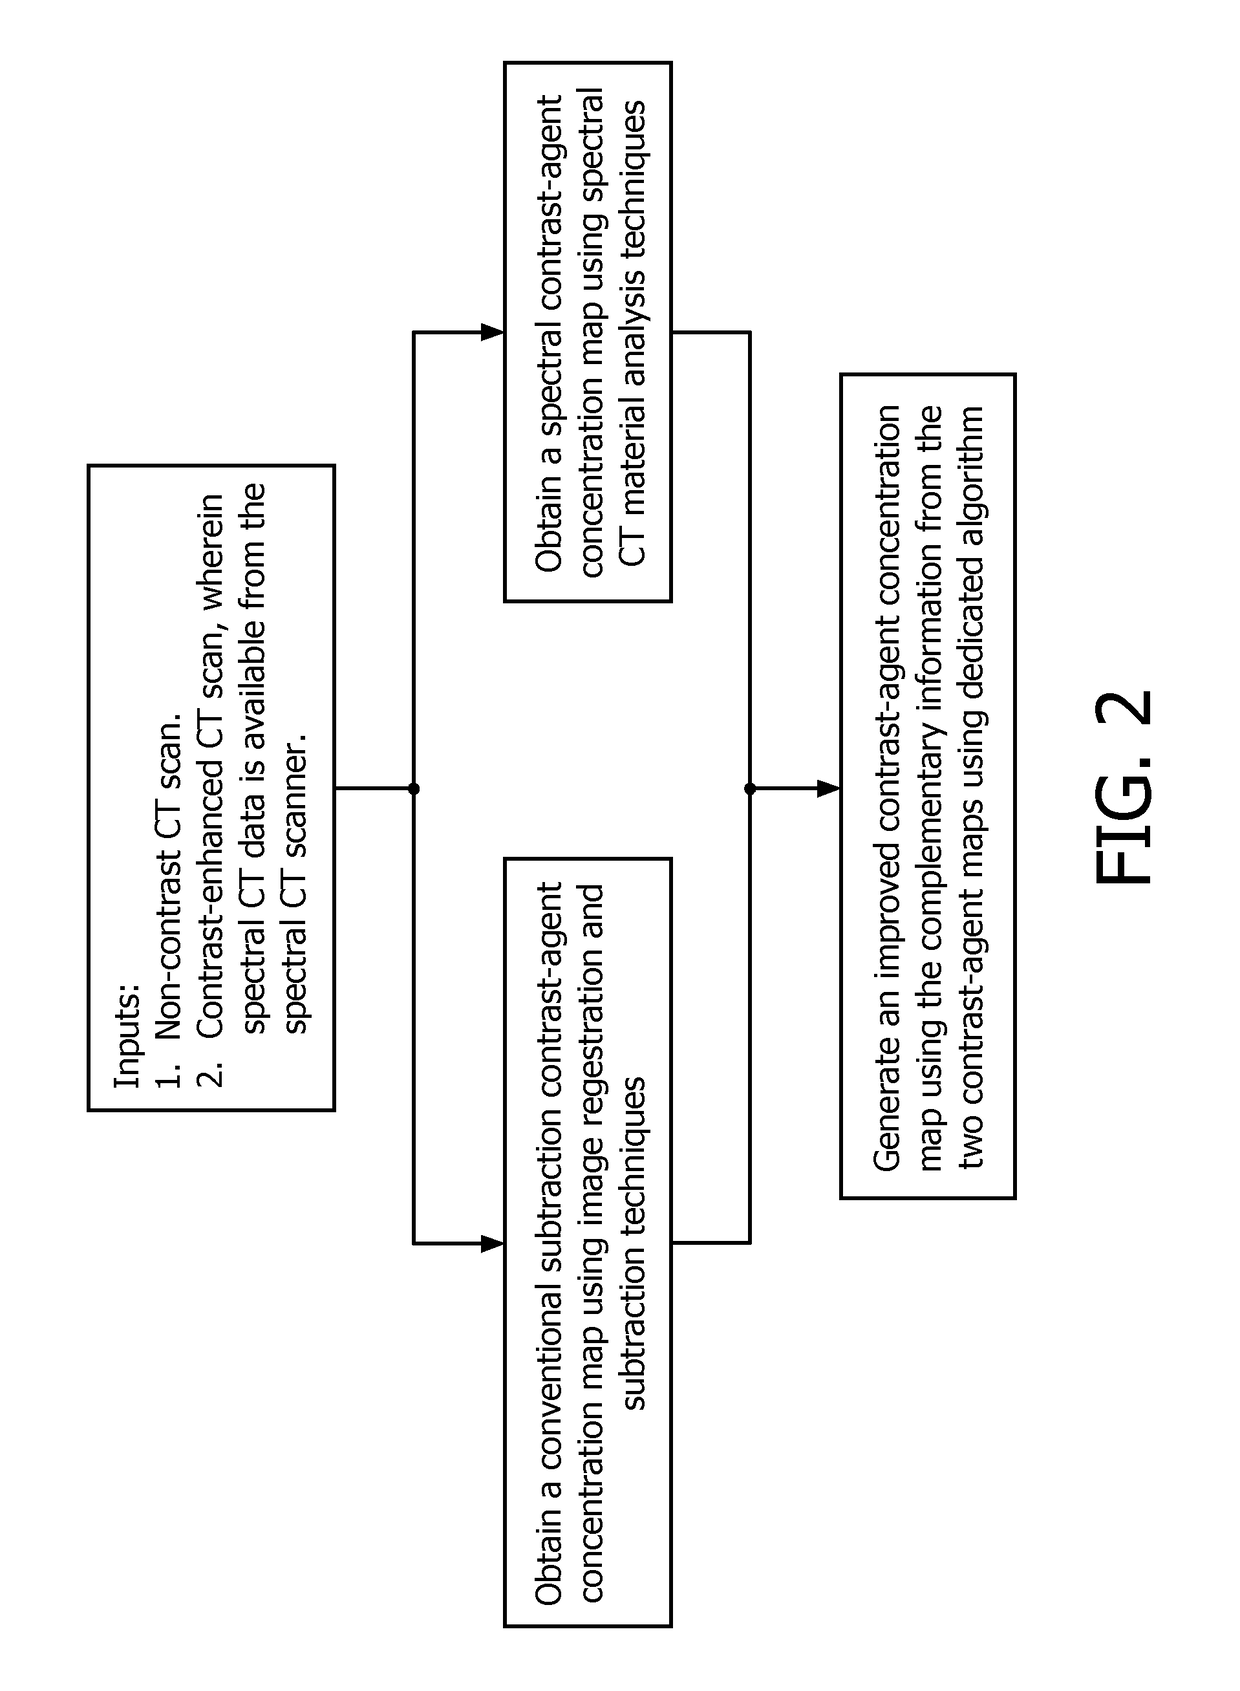
Method for generating contrast agent concentration map from a non-contrast enhanced Computed Tomography scan, a contrast enhanced Computed Tomography scan and corresponding spectral Computed Tomography data, comprising: a. Generating at least two different primary contrast agent concentration maps out of the non-contrast enhanced Computed Tomography scan, the contrast enhanced Computed Tomography scan and the spectral Computed Tomography data, b. Performing a local quality analysis of each primary contrast agent concentration map c. Determining local volumetric weights for each primary contrast agent concentration map based on the local quality analysis, and d. Generating a secondary contrast agent concentration map based on the two primary contrast agent concentration maps and on their corresponding local volumetric weights.

Description

CROSS REFERENCE TO RELATED APPLICATIONS[0001]This application is the U.S. National Phase application under 35 U.S.C. § 371 of International Application No. PCT / EP2016 / 080198 filed Dec. 8, 2016, published as WO 2017 / 102529 on Jun. 22, 2017, which claims the benefit of European Patent Application Number 15200863.7 filed Dec. 17, 2015. These applications are hereby incorporated by reference herein.[0002]The present invention relates to a method for generating contrast agent concentration map. It also relates to a device adapted for communicating with a medical imaging device, to a Computed Tomography scanner and to a Computer readable storage medium.BACKGROUND OF THE INVENTION[0003]In Computed Tomography applications, contrast agent concentration maps, such as ‘iodine maps’ which are based on iodine contrast agent or other maps which are based on less common agents such as gadolinium, barium, bismuth or gold, can be very useful in improving the diagnosis accuracy of many diseases and c...

Claims


Application Information

Patent Timeline
Patent Type & Authority Patents(United States)
IPC IPC(8): G06K9/00A61B6/00A61B6/03G06T11/00G06T7/37
CPCG06T11/003A61B6/03A61B6/481A61B6/484A61B6/5223G06T7/37A61B6/5235G06T2207/30004G06T2207/10081G06T2207/20172G06T2207/20224
Inventor CARMI, RAZ
Owner KONINKLJIJKE PHILIPS NV
Learn More