Method for detecting geological objects in a seismic image
a seismic image and object detection technology, applied in seismology, borehole/well accessories, instruments, etc., can solve the problems of difficult automatic implementation, limited performance, and inability to detect geological objects in seismic images,
- Summary
- Abstract
- Description
- Claims
- Application Information
AI Technical Summary
Benefits of technology
Problems solved by technology
Method used
Image
Examples
embodiment examples
[0185]The features and advantages of the method according to the invention will become more clearly apparent from studying the following application examples.
first example
[0186]In this example it is a question of illustrating, using a purely theoretical example, the principle of the method according to the invention.
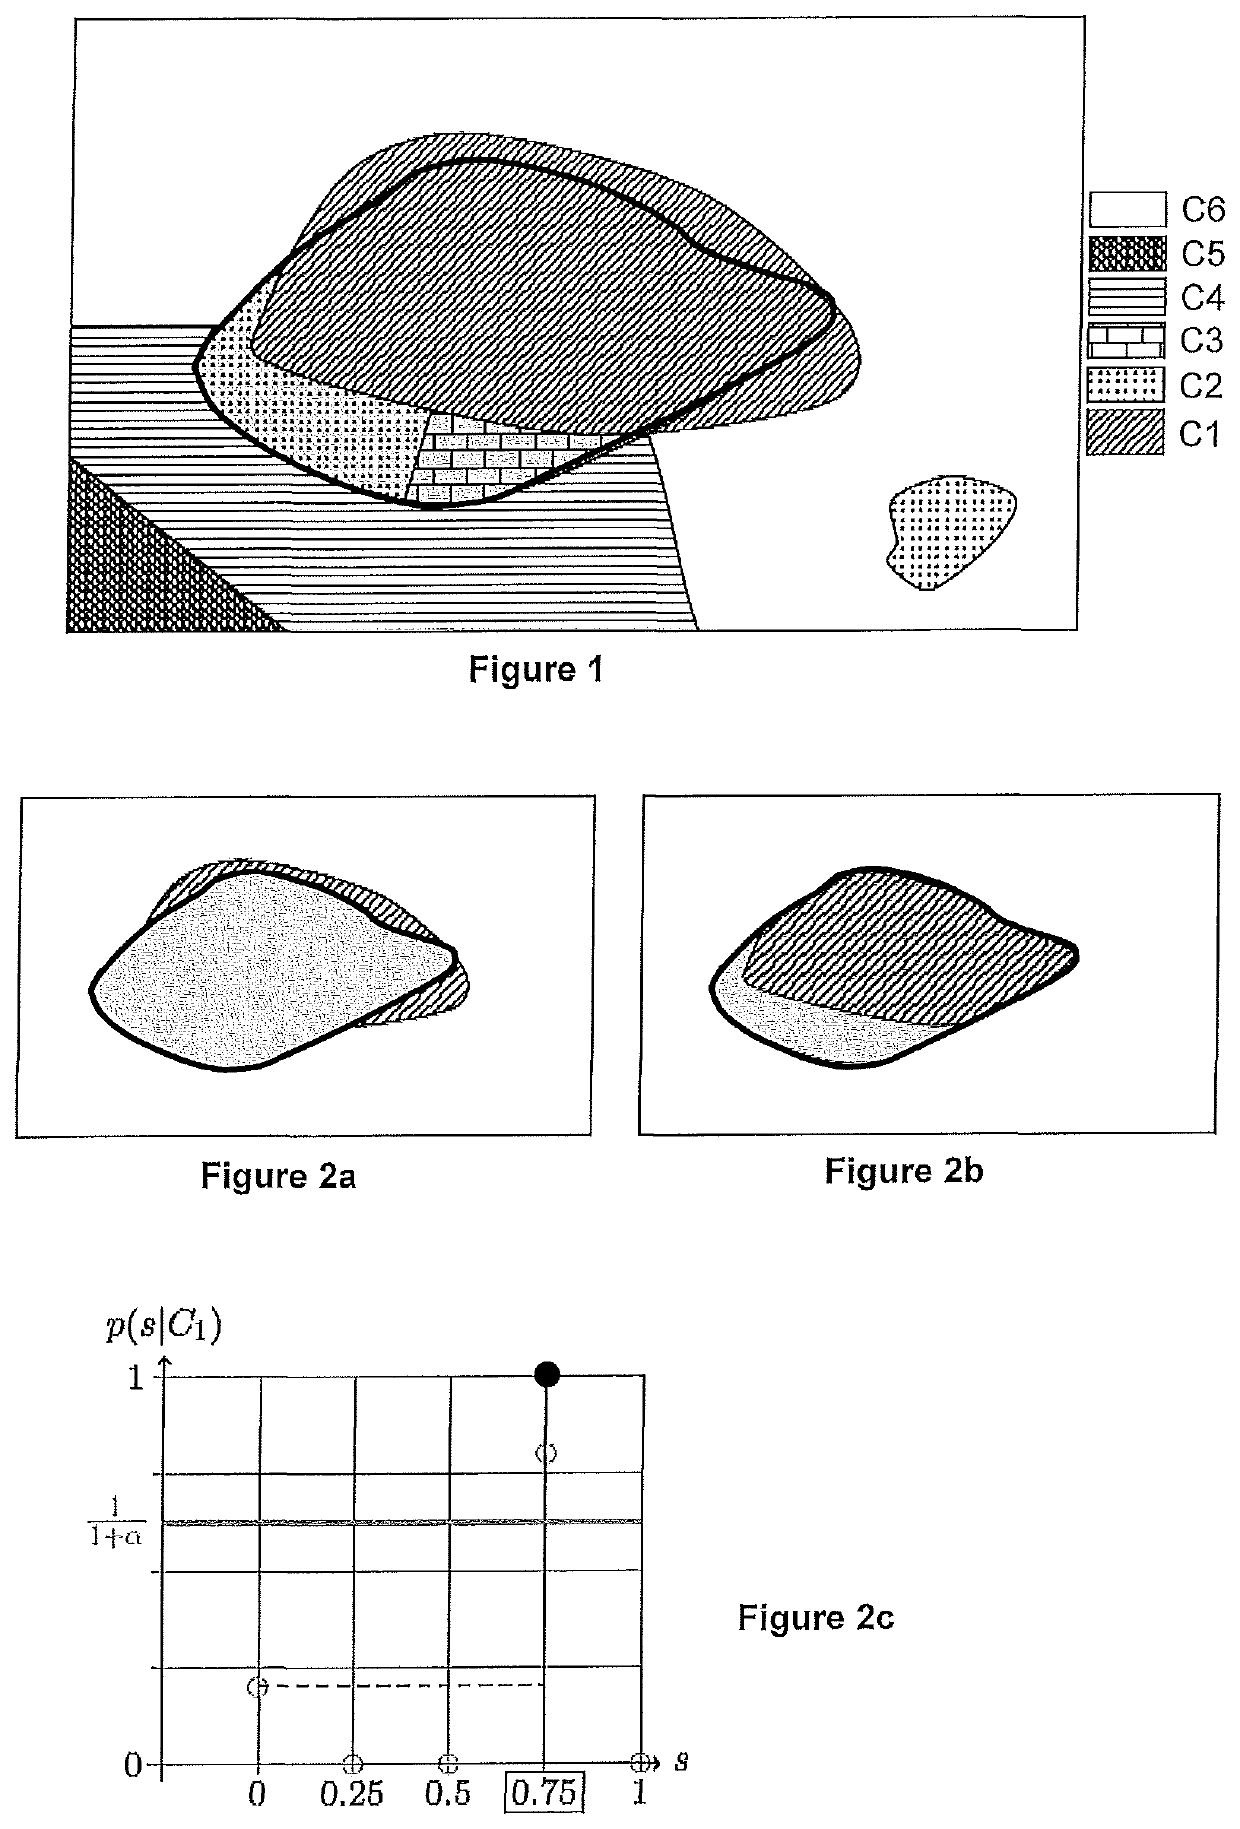
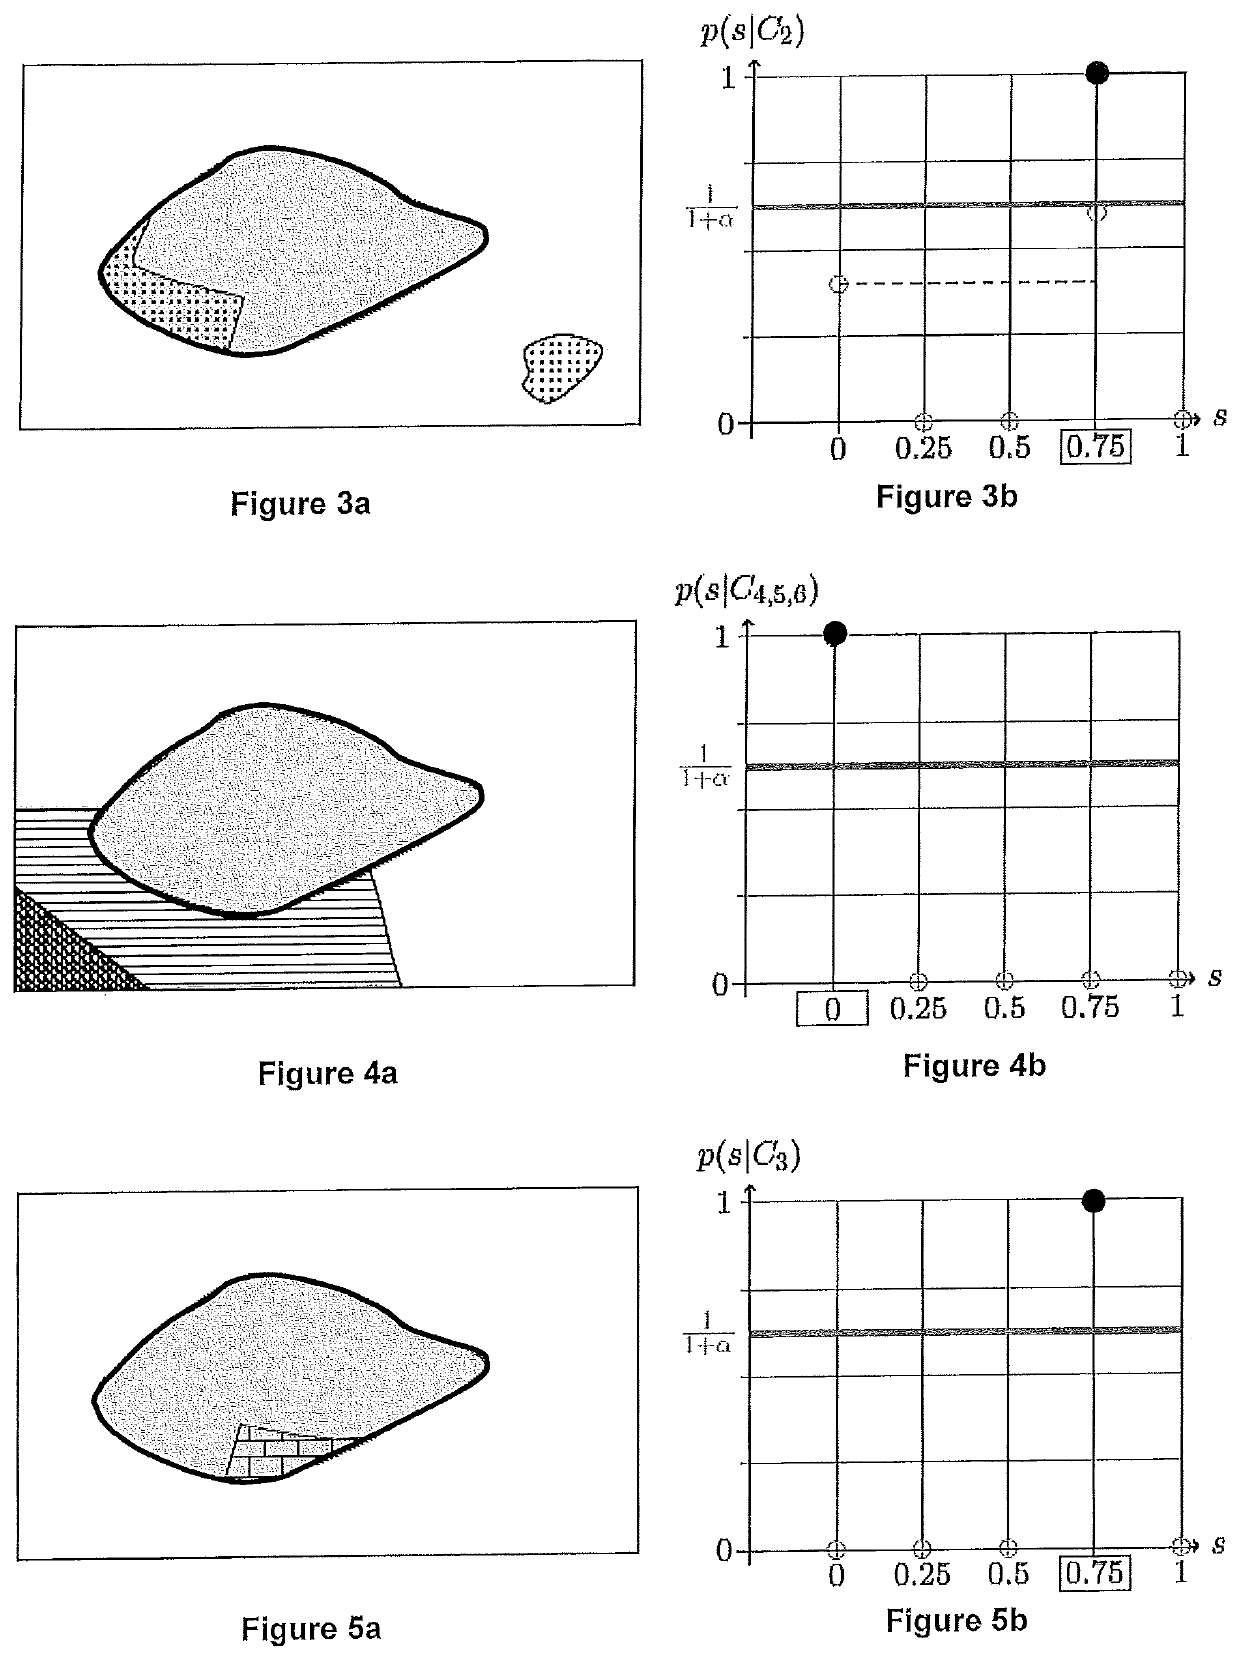
[0187]FIG. 1 shows a geological object (bold outline) which has been manually delimited in a seismic image, along with the classes (classes C1 to C6) resulting from the application of an applied classification method. The a priori probabilities are discretized as follows [s1,s2,s3,s4,s5]=[0, 0.25, 0.5, 0.75, 1]. The probability s4 has been attributed to the interior of the outlined zone, and the probability s1 has been attributed to the samples outside this outline. Thus, for this example, only two probability values are shown in the overall distribution of a priori probabilities.
[0188]In this example, the risk of having forgotten to interpret a geological object of the sought type in the seismic image is considered to be around 40%. According to the embodiment defined above, this amounts to setting α=0.6 (recall that α=1 corresponds to t...
second example
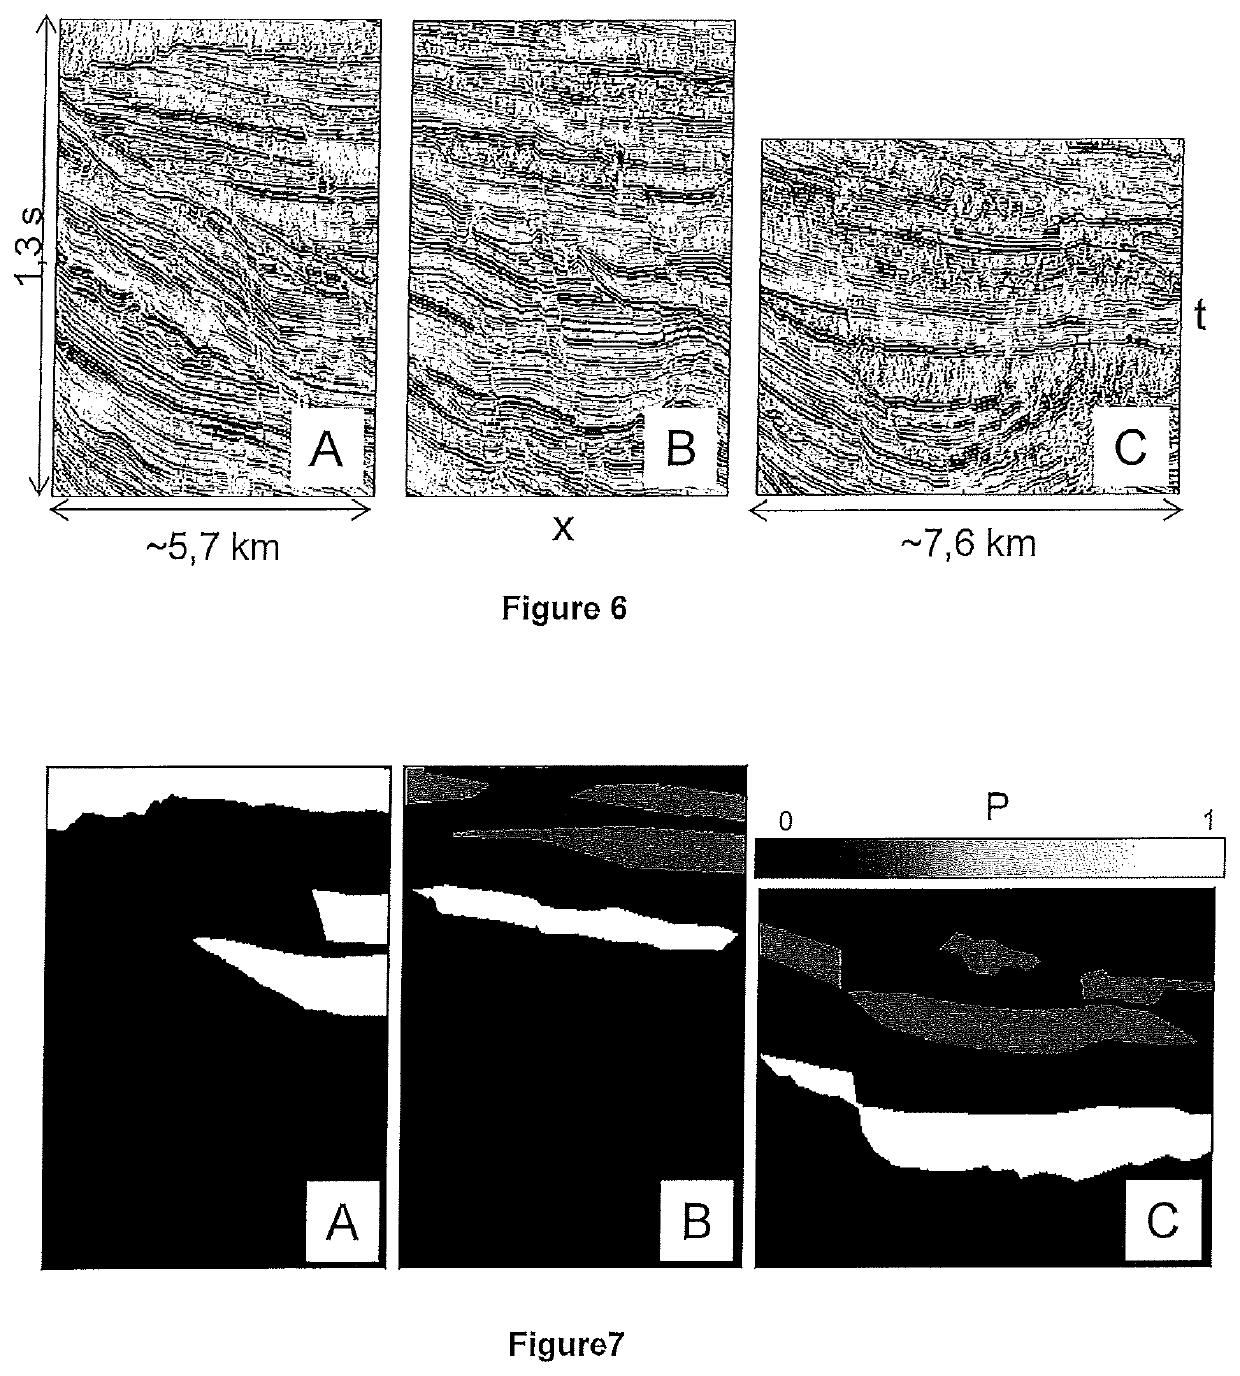
[0205]For this example, the geological objects are to be delimited in a 3D seismic image (a 3D seismic cube after stacking, also called a “post-stack” seismic cube) and correspond to MTD (mass-transport deposit)-type sedimentary deposits. These objects can be recognized in the seismic image by an informed interpreter by the various seismic facies that they contain and their arrangement. The seismic image has a vertical sampling interval of 4 ms, and an intertrace distance of 25 m in both (crossline and inline) directions. The MTDs that it is sought to detect have a size of several tens of kilometres laterally, and are at most 100 ms thick. Three 2D sections of the cube are used as learning seismic images (see FIG. 6, which shows these three learning seismic images A, B and C). A pixel of a seismic image therefore has a size of 4 ms×25 m. These three seismic sections have been interpreted by an interpreter, who has delimited zones with a very high a priori probability of belonging P ...
PUM
 Abstract
Description
Claims
Application Information
 - R&D
- Intellectual Property
- Life Sciences
- Materials
- Tech Scout
- Unparalleled Data Quality
- Higher Quality Content
- 60% Fewer Hallucinations
Browse by: Latest US Patents, China's latest patents, Technical Efficacy Thesaurus, Application Domain, Technology Topic, Popular Technical Reports.
© 2025 PatSnap. All rights reserved.Legal|Privacy policy|Modern Slavery Act Transparency Statement|Sitemap|About US| Contact US: help@patsnap.com


