Locating potential sources of memory leaks
Active Publication Date: 2004-04-22
CA TECH INC
View PDF15 Cites 51 Cited by
- Summary
- Abstract
- Description
- Claims
- Application Information
AI Technical Summary
Problems solved by technology
Memory leaks slow program execution and can cause programs to run out of memory.
Many times the effects of memory leaks can cause a program to crash.
Memory leaks are very difficult to detect because memory leaks rarely produce directly noticeable effects, but instead cumulatively degrade and / or affect overall performance.
The cumulative effects of memory leaks is that memory is lost which increases the size of the working memory being used.
In the worst case, a program can consume the entire virtual memory of the host system.
The indirect symptom of a memory leak is that a process's address space grows during activity when one would have expected it to remain constant.
However, there are two problems with this methodology.
The first problem is that it does not rule out that there simply was enough unallocated heap memory in the existing address space to accommodate the leaks.
In other words, the address space does not grow, but there does exist a leak.
The second problem with this repetition methodology is that it is quite time-consuming to build test sweeps that repetitively exercise every feature and automatically watch for improper address space growth.
In fact, it is generally so time-consuming that it is rarely done at all.
Suppose, however, that a developer sufficiently builds a leak detecting sweep and finds that the address space grows unacceptably due to one or more leaks.
The developer still must spend a considerable amount of time to track down the problems.
The first technique is fairly brute force and can take many iterations to track down a single leak.
The second technique is powerful in practice, but has problems.
The problem with this is the existence of permanently allocated data, such as a symbol table, that is designed to be to be reclaimed only when the process terminates.
Such permanently allocated data may show up as a leak.
Memory leaks are so hard to detect and track down that they are often simply tolerated.
However, in long-running programs it can be a major problem.
In that case, a memory leak could grow and accumulate over time, such that the program degrades in performance so as to be come unusable.
An organization that relies on commerce or on functions via the Internet may not be able to live with such degradation of performance or crashing of their Internet applications.
Unfortunately, malloc-debug packages do not detect errors at the point they occur.
Since malloc_verify has to scan the entire heap, it is expensive to call frequently.
While some of the above-described tools were somewhat successful for use with applications created using the C and C++ programming languages, they were not sufficient for applications written in Java.
Thus, tracking allocation may not be practical.
Thus, if a set of objects are created for use for a short period of time, and the reference to the object is not removed, then a leak may be created.
Tracking every object requires a lot of CPU time, which prevents the application from running in production when the memory leak debug tool is operating.
Because the application has to be run in a non-production environment, it may be possible that the leak is not reproduced in the non-production environment (e.g. a debugging or testing environment).
Also, there is a heavy burden on the human developer to read through all of the information.
These collections are flagged as potential sources of leaks.
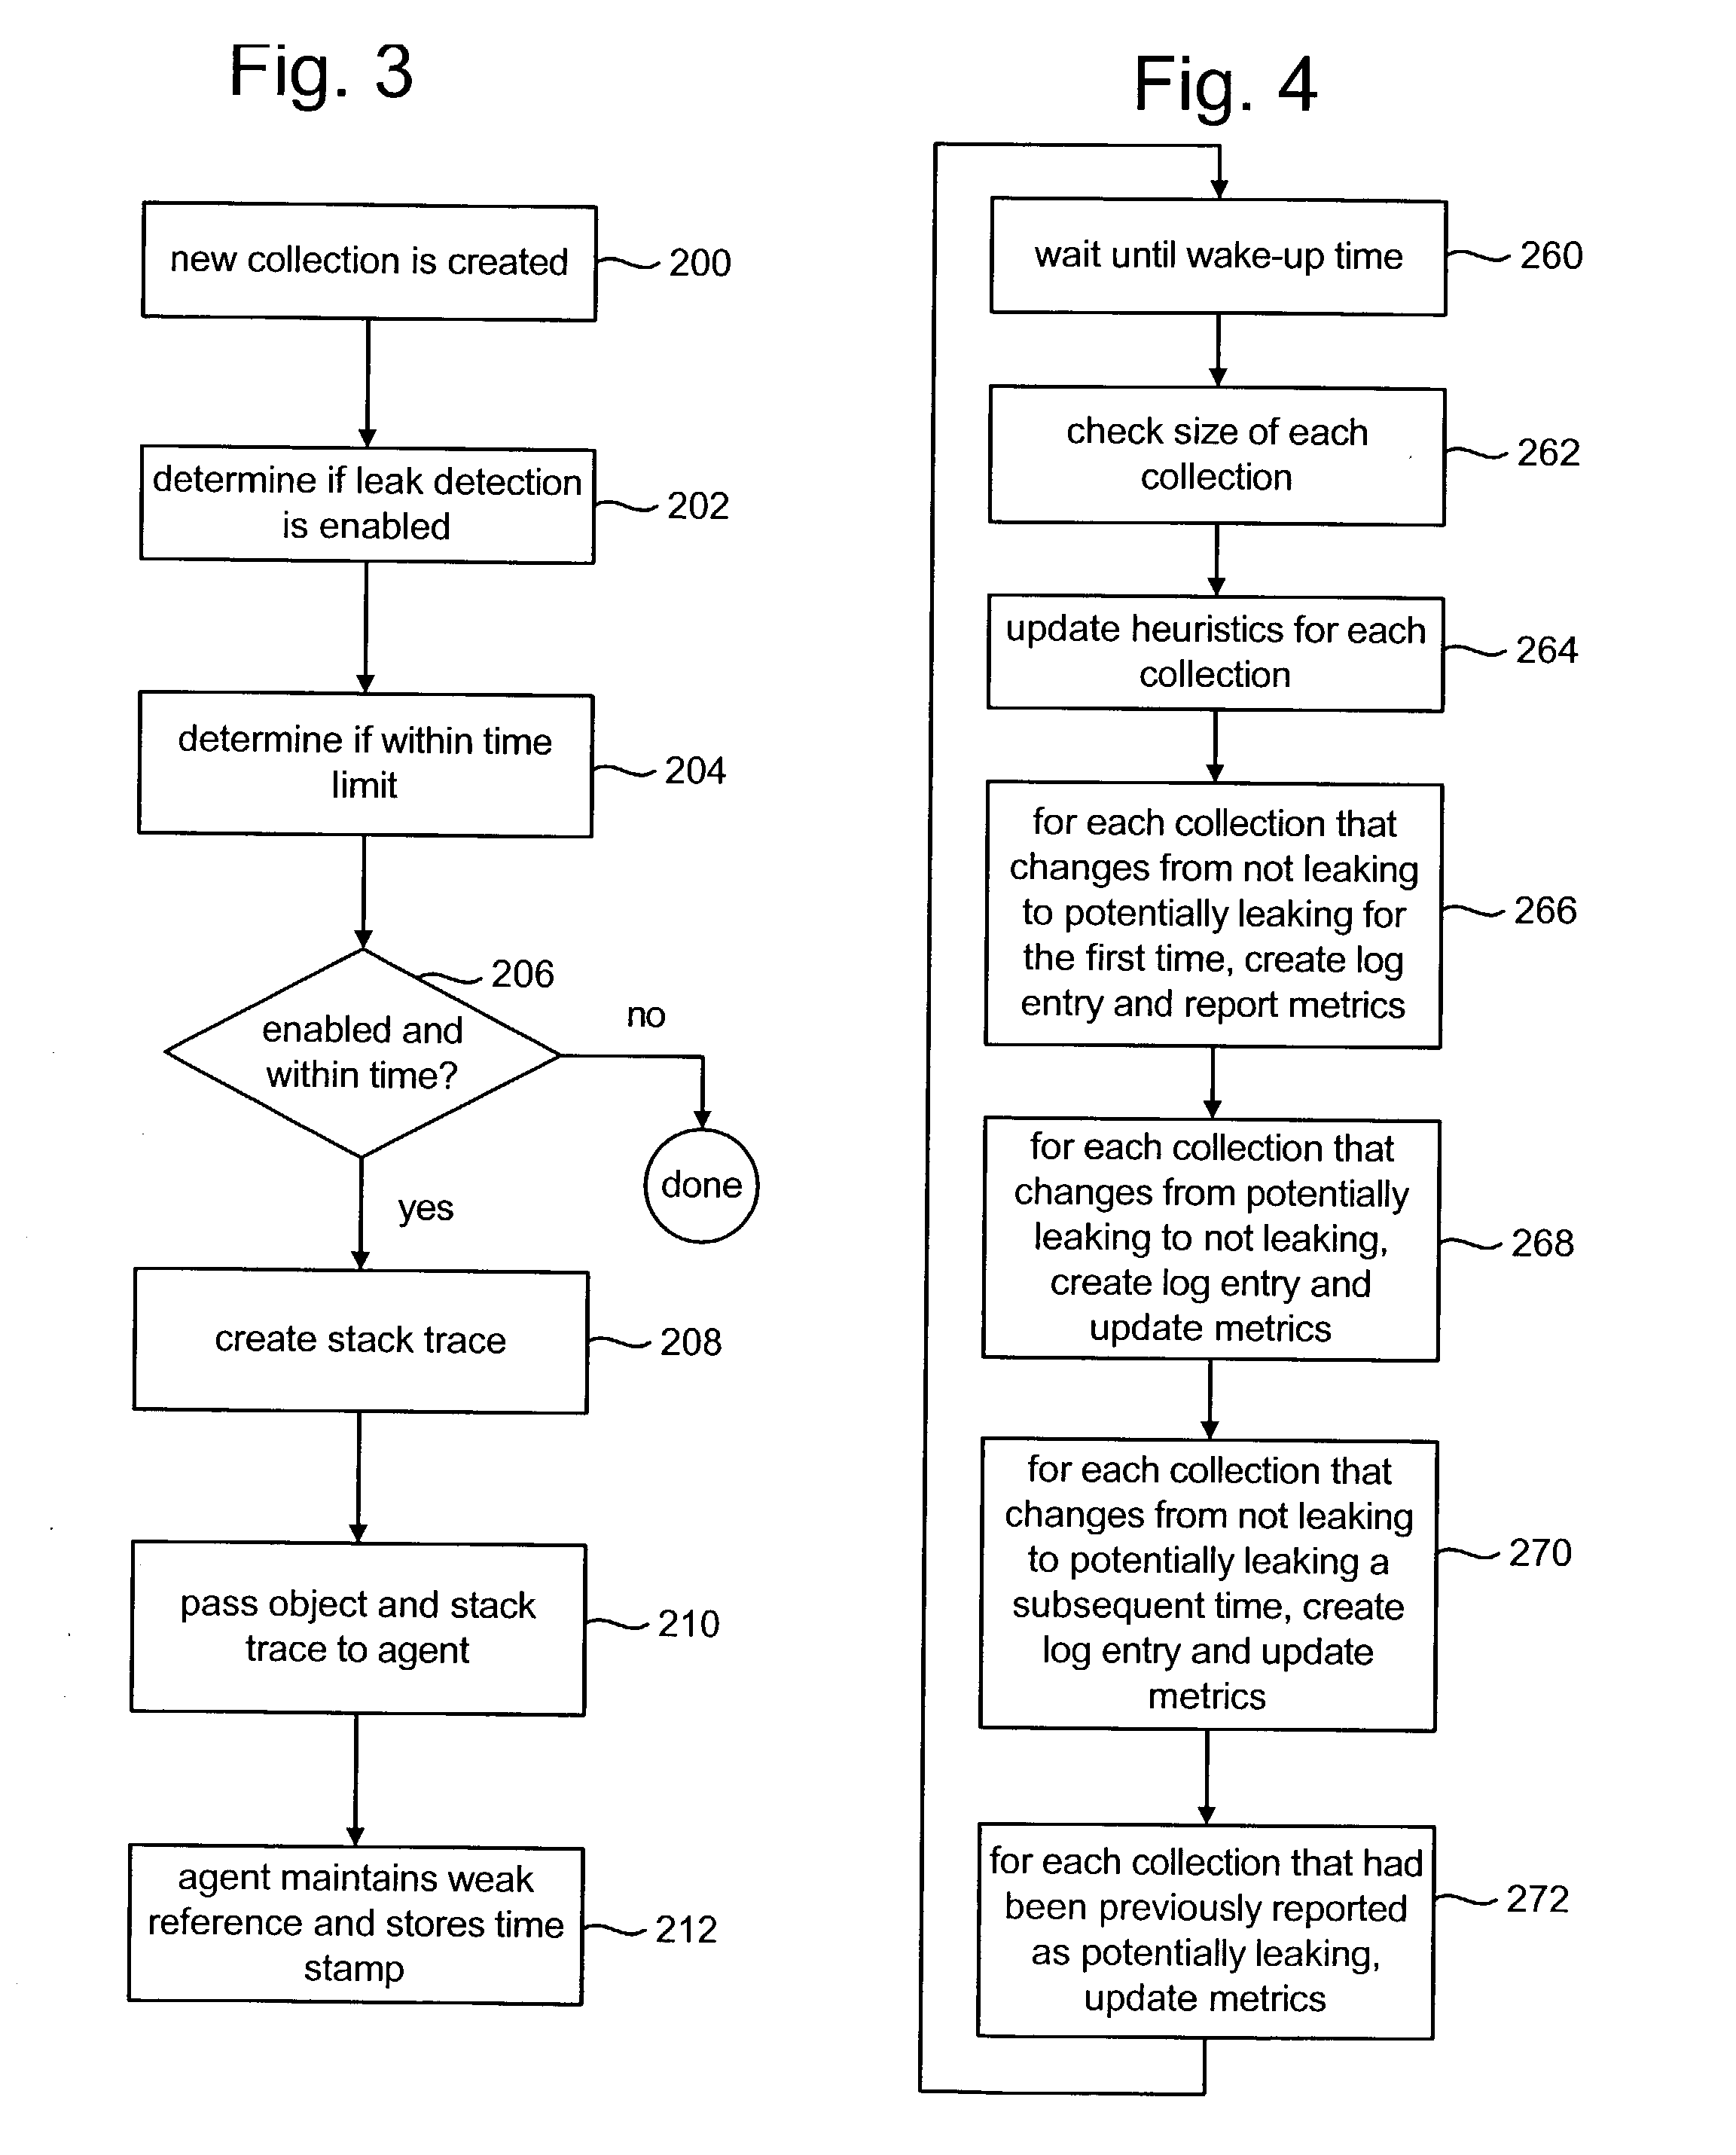
That group of stored items is reported as being a potential source of a memory leak if the received size satisfies the current value of the threshold and a set of previous values of the threshold have also been satisfied.
By using the tool in production operation, a software developer or the entity responsible for debugging the software will have the opportunity to see the errors that occur when the software is used in its intended environment rather than in an unrealistic debugging environment.
Sometimes, however, the source code is not available.
There could be millions of objects in an application, and tracking every object could degrade performance.
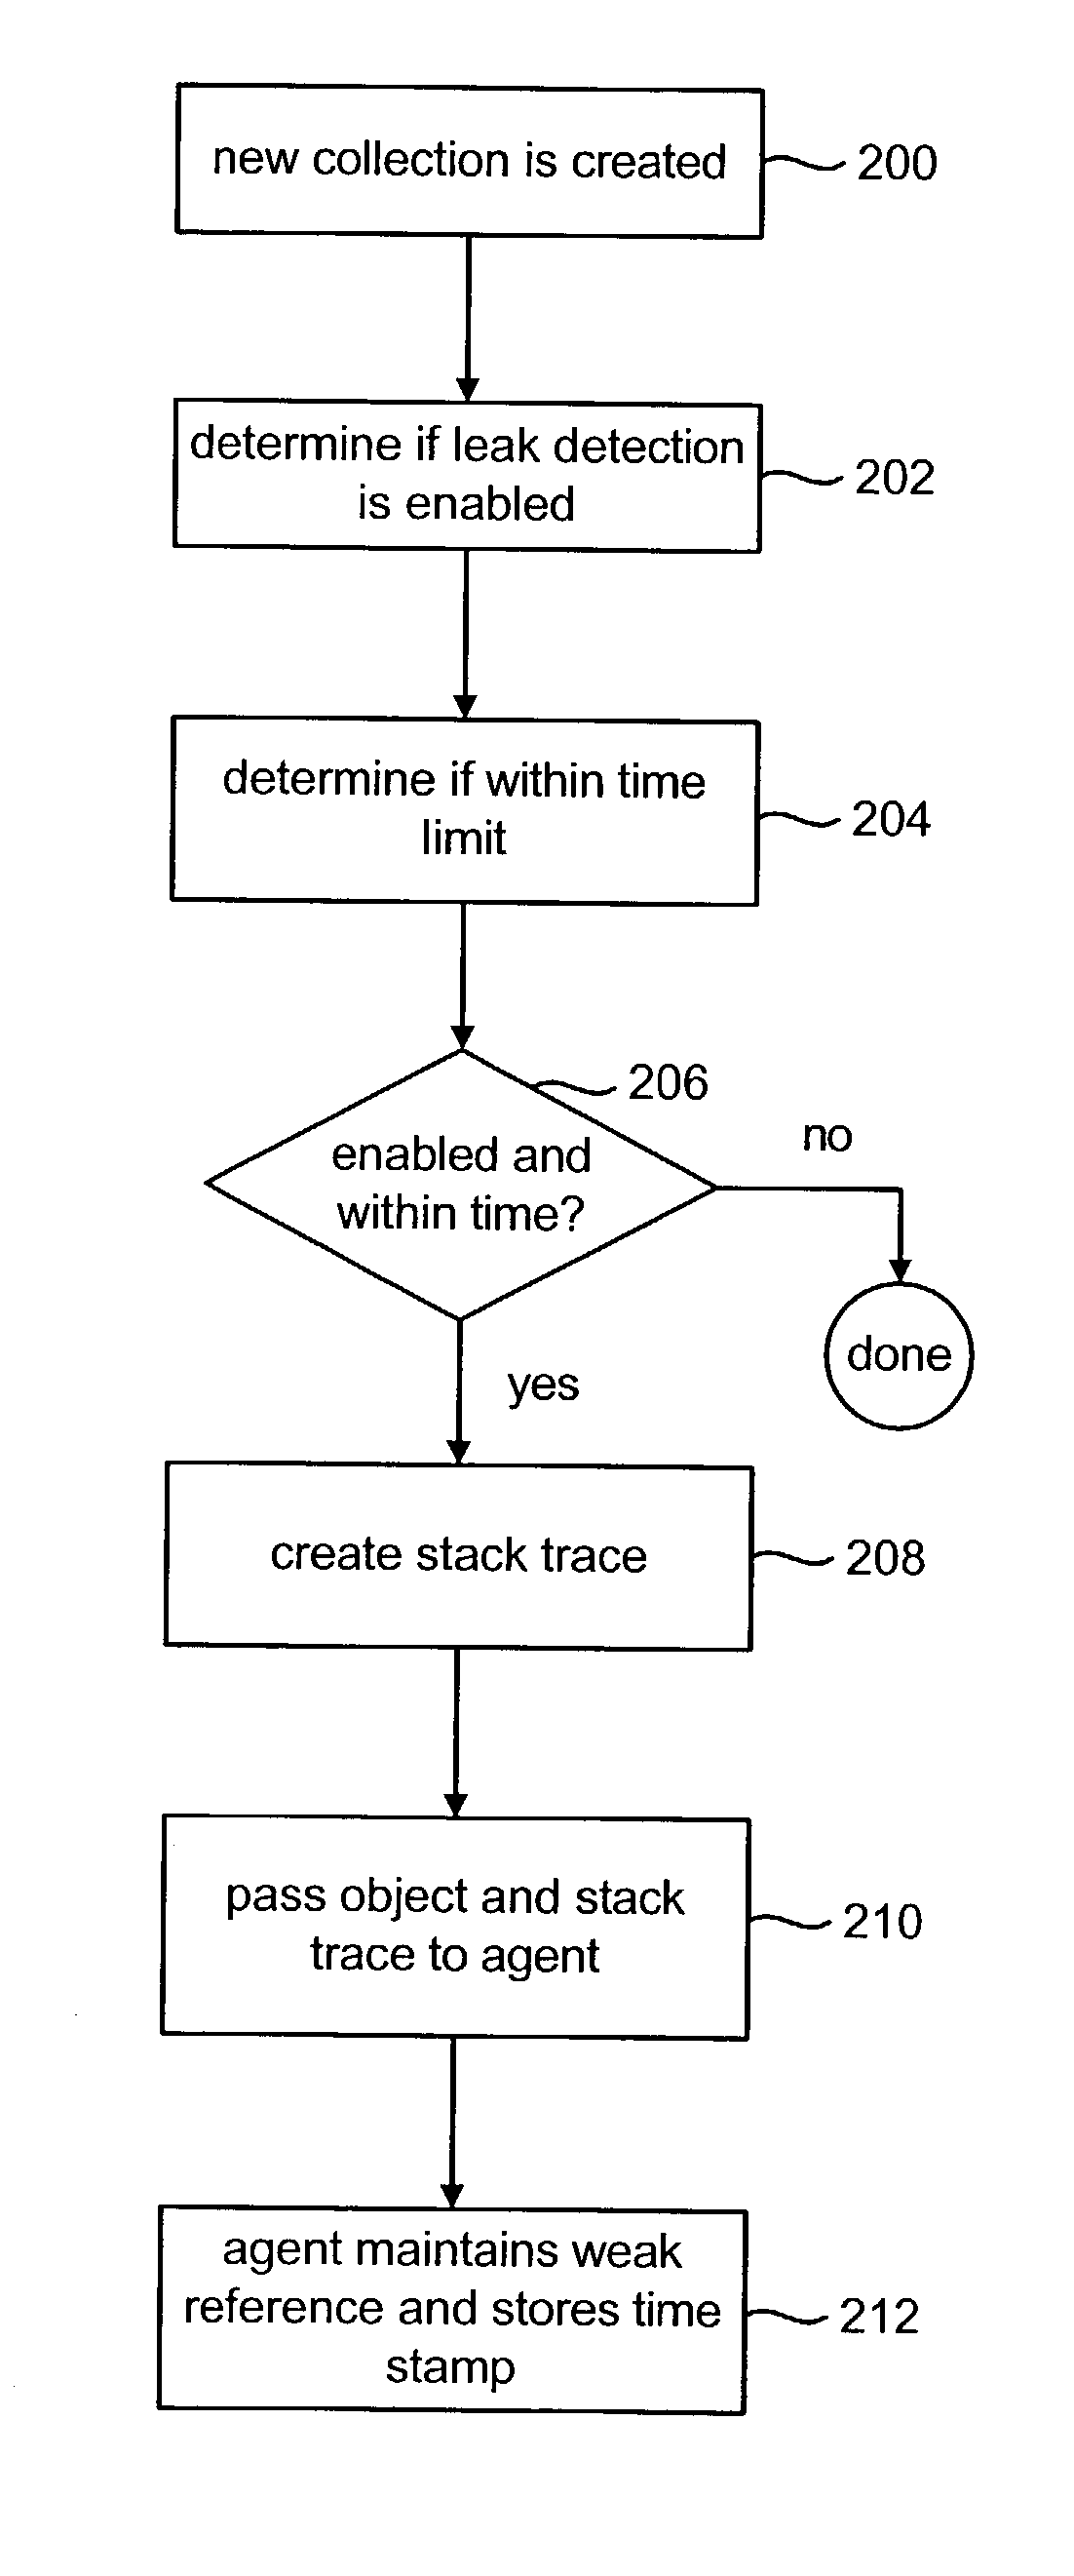
After the time out period expires, the system does not track newly allocated collections; however, it continues to track collections that have ever been flagged as potential leaks.
When the change counter is greater than 3, the collection will be reported as a potential source of a leak.
In other words, when the size of the collection grows so that more than three thresholds have been exceeded, the collection is reported as being a potential source of a leak.
The lower the sensitivity counter, the more likely the collection will be reported as a potential source of a leak.
Once the threshold value has been changed X times, the collection is considered to be a potential source of a memory leak.
Therefore, during step 266 of iteration 7, the collection was reported as being a potential source of a memory leak.
Method used
View moreImage
Smart ImageViewing Examples
Examples
Embodiment Construction
has been presented for purposes of illustration and description. It is not intended to be exhaustive or to limit the invention to the precise form disclosed. Many modifications and variations are possible in light of the above teaching. The described embodiments were chosen in order to best explain the principles of the invention and its practical application to thereby enable others skilled in the art to best utilize the invention in various embodiments and with various modifications as are suited to the particular use contemplated. It is intended that the scope of the invention be defined by the claims appended hereto.
Login to View More PUM
 Abstract
Potential sources of memory leaks are identified by tracking the size of groups of stored items and determining based on the growth pattern of the groups whether the groups of stored items are potential sources of memory leaks. An example of a group of stored items is an instance of a Java collection. If the growth pattern of a particular group of stored items indicates that it may be the source of a memory leak, that group is reported to a user and will continue to be tracked.
Description
[0001] This application claims the benefit of U.S. Provisional Application No. 60 / 419,689, "Web Application Monitoring," filed on Oct. 18, 2002, which is incorporated herein by reference in its entirety.[0002] 1. Field of the Invention[0003] The present invention is directed to technology for finding the source of memory leaks.[0004] 2. Description of the Related Art[0005] Memory leaks are allocated memory that are no longer in use. They should have been freed, but were not. Memory leaks slow program execution and can cause programs to run out of memory. Many times the effects of memory leaks can cause a program to crash. Memory leaks are very difficult to detect because memory leaks rarely produce directly noticeable effects, but instead cumulatively degrade and / or affect overall performance. That is, a memory leak is typically does not have a direct symptom. The cumulative effects of memory leaks is that memory is lost which increases the size of the working memory being used. In ...
Claims
Login to View More Application Information
Patent Timeline
 IPC IPC(8): G06F12/00
CPCG06F11/3476G06F11/348G06F2201/865G06F2201/81G06F11/362
Inventor CIRNE, LEWIS K.BLEY, JOHN B.PURYEAR, DARYL L.LATHAM, DAVID
Owner CA TECH INC


