System and method of predicting future fractures
- Summary
- Abstract
- Description
- Claims
- Application Information
AI Technical Summary
Benefits of technology
Problems solved by technology
Method used
Image
Examples
example 1
Correlation of Micro-Structural and Macro-Structural Parameters to Fracture Load
[0111] Using 15 fresh cadaveric femurs, the following analyses were performed to determine the correlation of various micro-structural and macro-structural parameters to fracture load, as determined by biomechanical testing. Parameters measured included one or more of the following
Parameter NameDescriptionMeasurements on gray values of extracted structuresStd. dev. ofNormalized ROI is subtracted from the background using a difference ofnormalized ROIgaussian filter. The standard deviation reflects the “roughness” of thetrabecular structures.Measurements on binarization of extracted structuresTrab. PerimeterTotal length of outline (perimeter) of extracted trabecular structures in aROI.Trab.Trabecular perimeter normalized by area of extracted trabecular structures.Perimeter / Trab.AreaTrab.Trabecular perimeter normalized by ROI area.Perimeter / TotalAreaTrabecular BoneChange of perimeter per change of area....
example 2
Correlation of 2D and 3D Measurements
[0130] To demonstrate that these methods that use 2D x-ray technology to quantitatively assess trabecular architecture are as effective as 3D μCT, which serves as a gold standard for such measurements, the following experiments were performed. Bone cores (n=48) were harvested from cadaveric proximal femora. Specimen radiographs were obtained and 2D structural parameters were measured on the radiographs. Cores were then subjected to 3D μCT and biomechanical testing. The μCT images were analyzed to obtained 3D micro-structural measurements. Digitized 2D x-ray images of these cores were also analyzed as described herein to obtain comparative micro-structural measurements.
[0131] Results showed very good correlation among the numerous 2D parameters and 3D μCT measurements, including for example correlation between 2D Trabecular Perimeter / Trabecular Area (Tb.P / Tb.A) with 3D Bone Surface / Bone Volume (r=0.92, p<0.001), and 2D Trabecular Separation (Tb....
example 3
Sliding Window Analysis and Watershed Segmentation
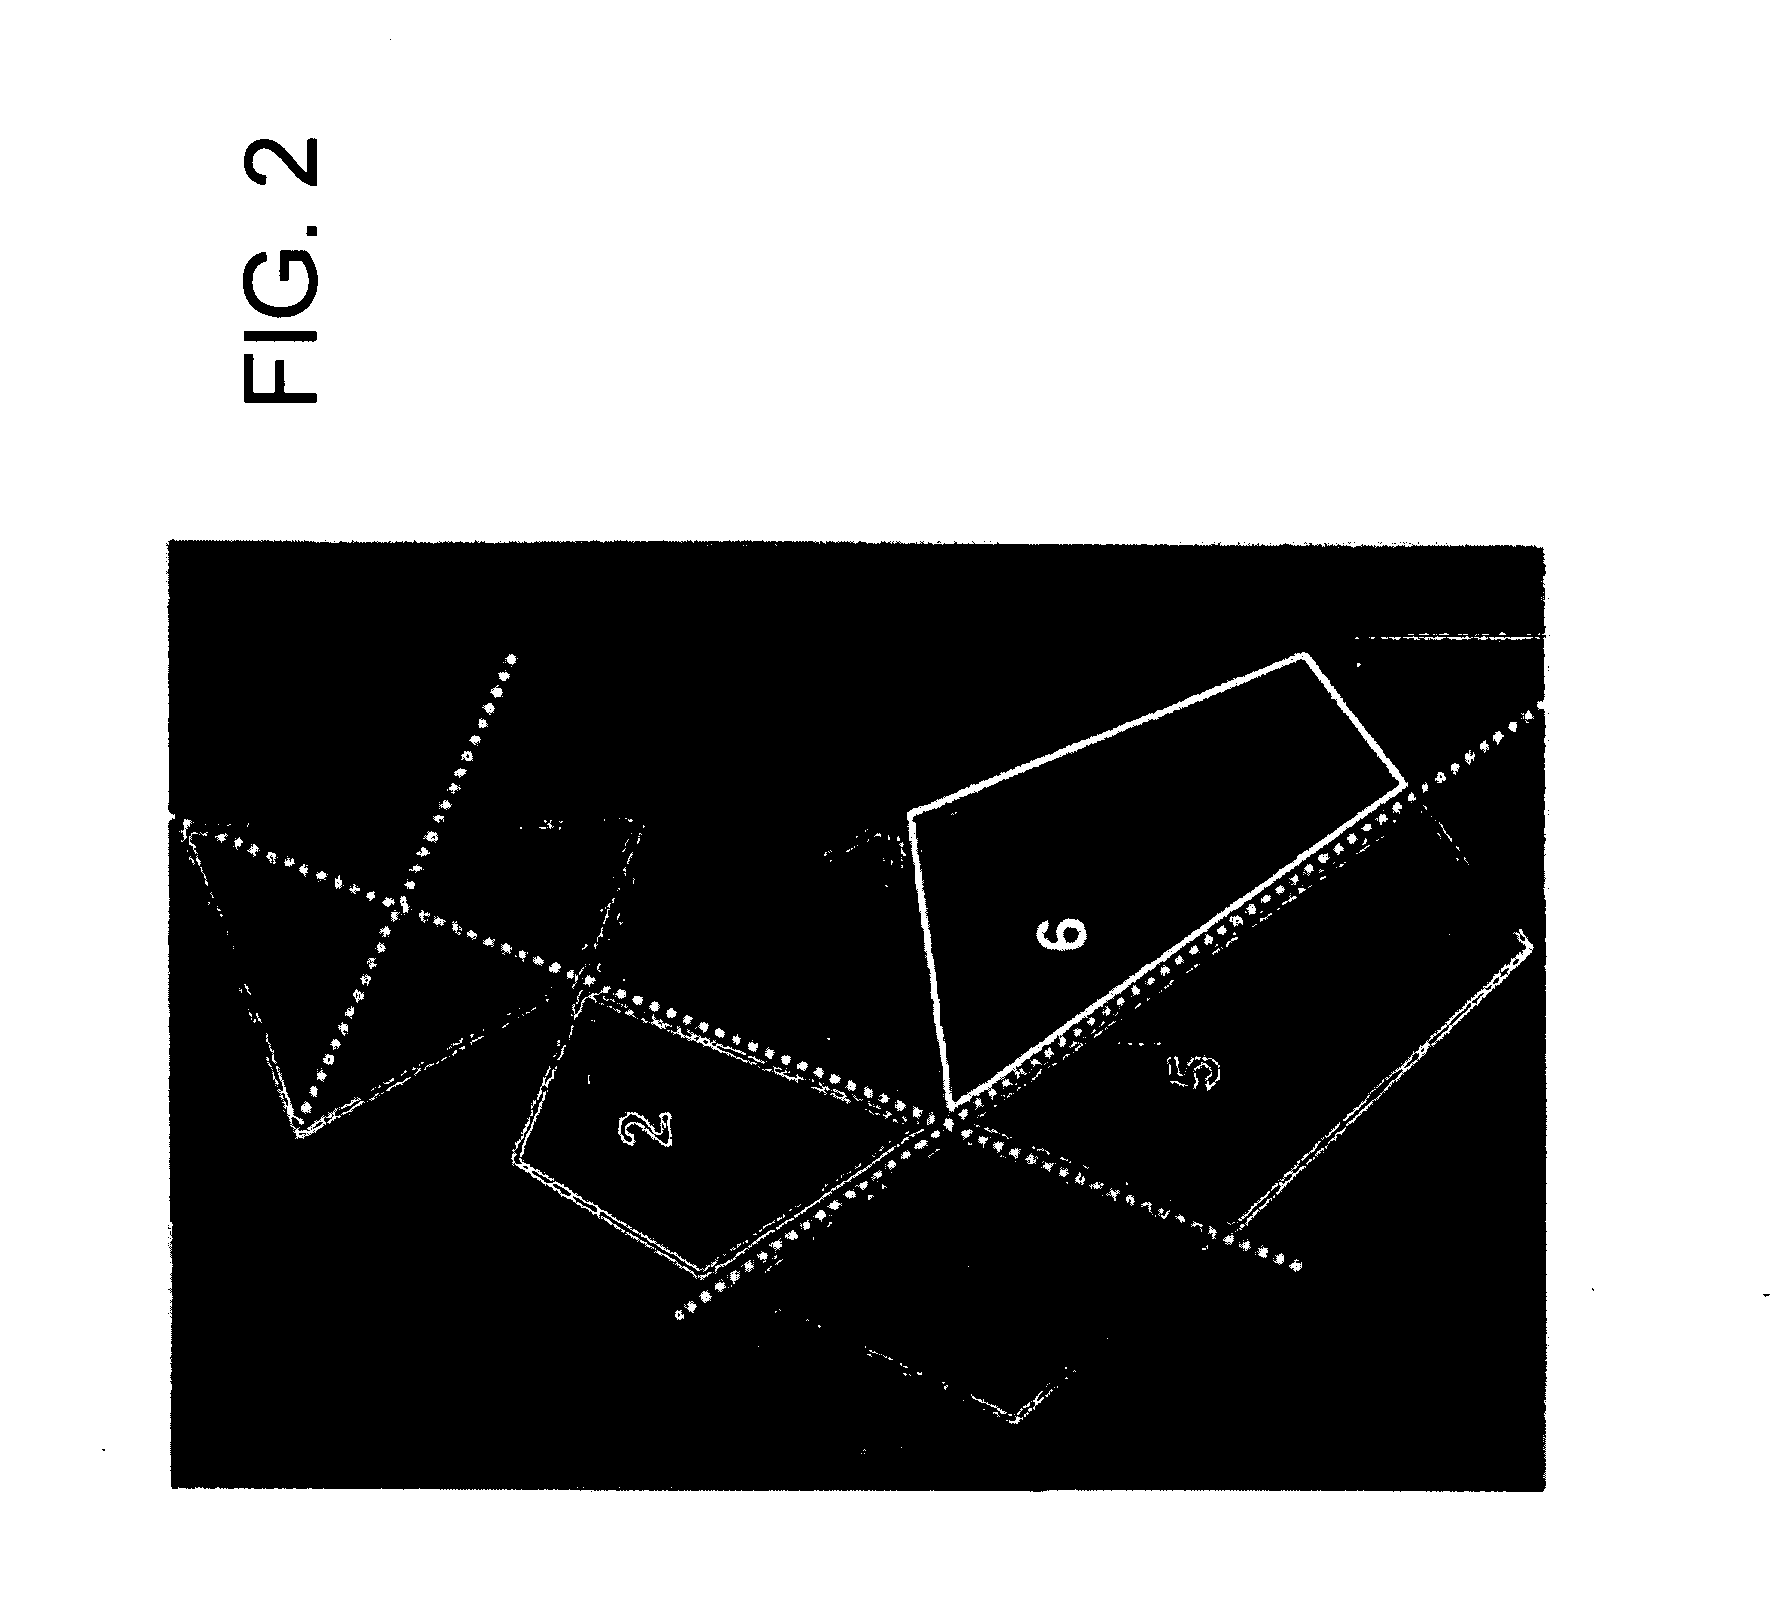
[0133] To show feasibility of the approach to better predict an individual's failure load and fracture risk, a sliding window analysis of the proximal femur in 3 cadaveric samples was also performed. Instead of using fixed ROI's as described in FIG. 2, a regular grid was laid over the proximal femur in the x-ray taken before the mechanical failure tests. A rectangular region of interest of a fixed size was placed at each grid node, and bone structure parameters were evaluated within the boundaries of the ROI at each position. This resulted in a value for each bone parameter at each grid node, which was displayed in a color-coded map of the proximal femur for each parameter.
[0134] The pre-fracture x-rays were then aligned with the post-fracture images, so that the fracture lines can be shown in the color maps, as shown in FIG. 6. It can be seen in the samples presented in FIG. 6 that certain parameters (e.g., for Area Ratio and Trab...
PUM
 Abstract
Description
Claims
Application Information
 - R&D
- Intellectual Property
- Life Sciences
- Materials
- Tech Scout
- Unparalleled Data Quality
- Higher Quality Content
- 60% Fewer Hallucinations
Browse by: Latest US Patents, China's latest patents, Technical Efficacy Thesaurus, Application Domain, Technology Topic, Popular Technical Reports.
© 2025 PatSnap. All rights reserved.Legal|Privacy policy|Modern Slavery Act Transparency Statement|Sitemap|About US| Contact US: help@patsnap.com


