Systems and methods of classification utilizing intensity and spatial data

a technology of intensity and spatial data, applied in image data processing, medical data mining, medical informatics, etc., can solve the problems of relying on manual or automated segmentation, resource-intensive manual volumetric results, and process with its own limitations, so as to effectively classify new subjects

Active Publication Date: 2006-05-18
MCGILL UNIV
View PDF0 Cites 60 Cited by
  • Summary
  • Abstract
  • Description
  • Claims
  • Application Information

AI Technical Summary

Benefits of technology

[0013] It has been found that in at least some circumstances, the chosen VOI contains sufficient discriminatory information based on a combination of image intensity and registration features to effectively classify new subjects based on those features.

Problems solved by technology

Classification of neurological diseases based solely on their imaging characteristics is a challenging task for computer vision.
Obtaining manual volumetric results is resource intensive and necessitates neuroanatomical expertise.
The drawbacks of structure-centered analysis reside mostly in their reliance on manual or automated segmentation, a process with its own limitations.

Method used


Image

  • Systems and methods of classification utilizing intensity and spatial data
  • Systems and methods of classification utilizing intensity and spatial data
  • Systems and methods of classification utilizing intensity and spatial data

Examples


Embodiment Construction

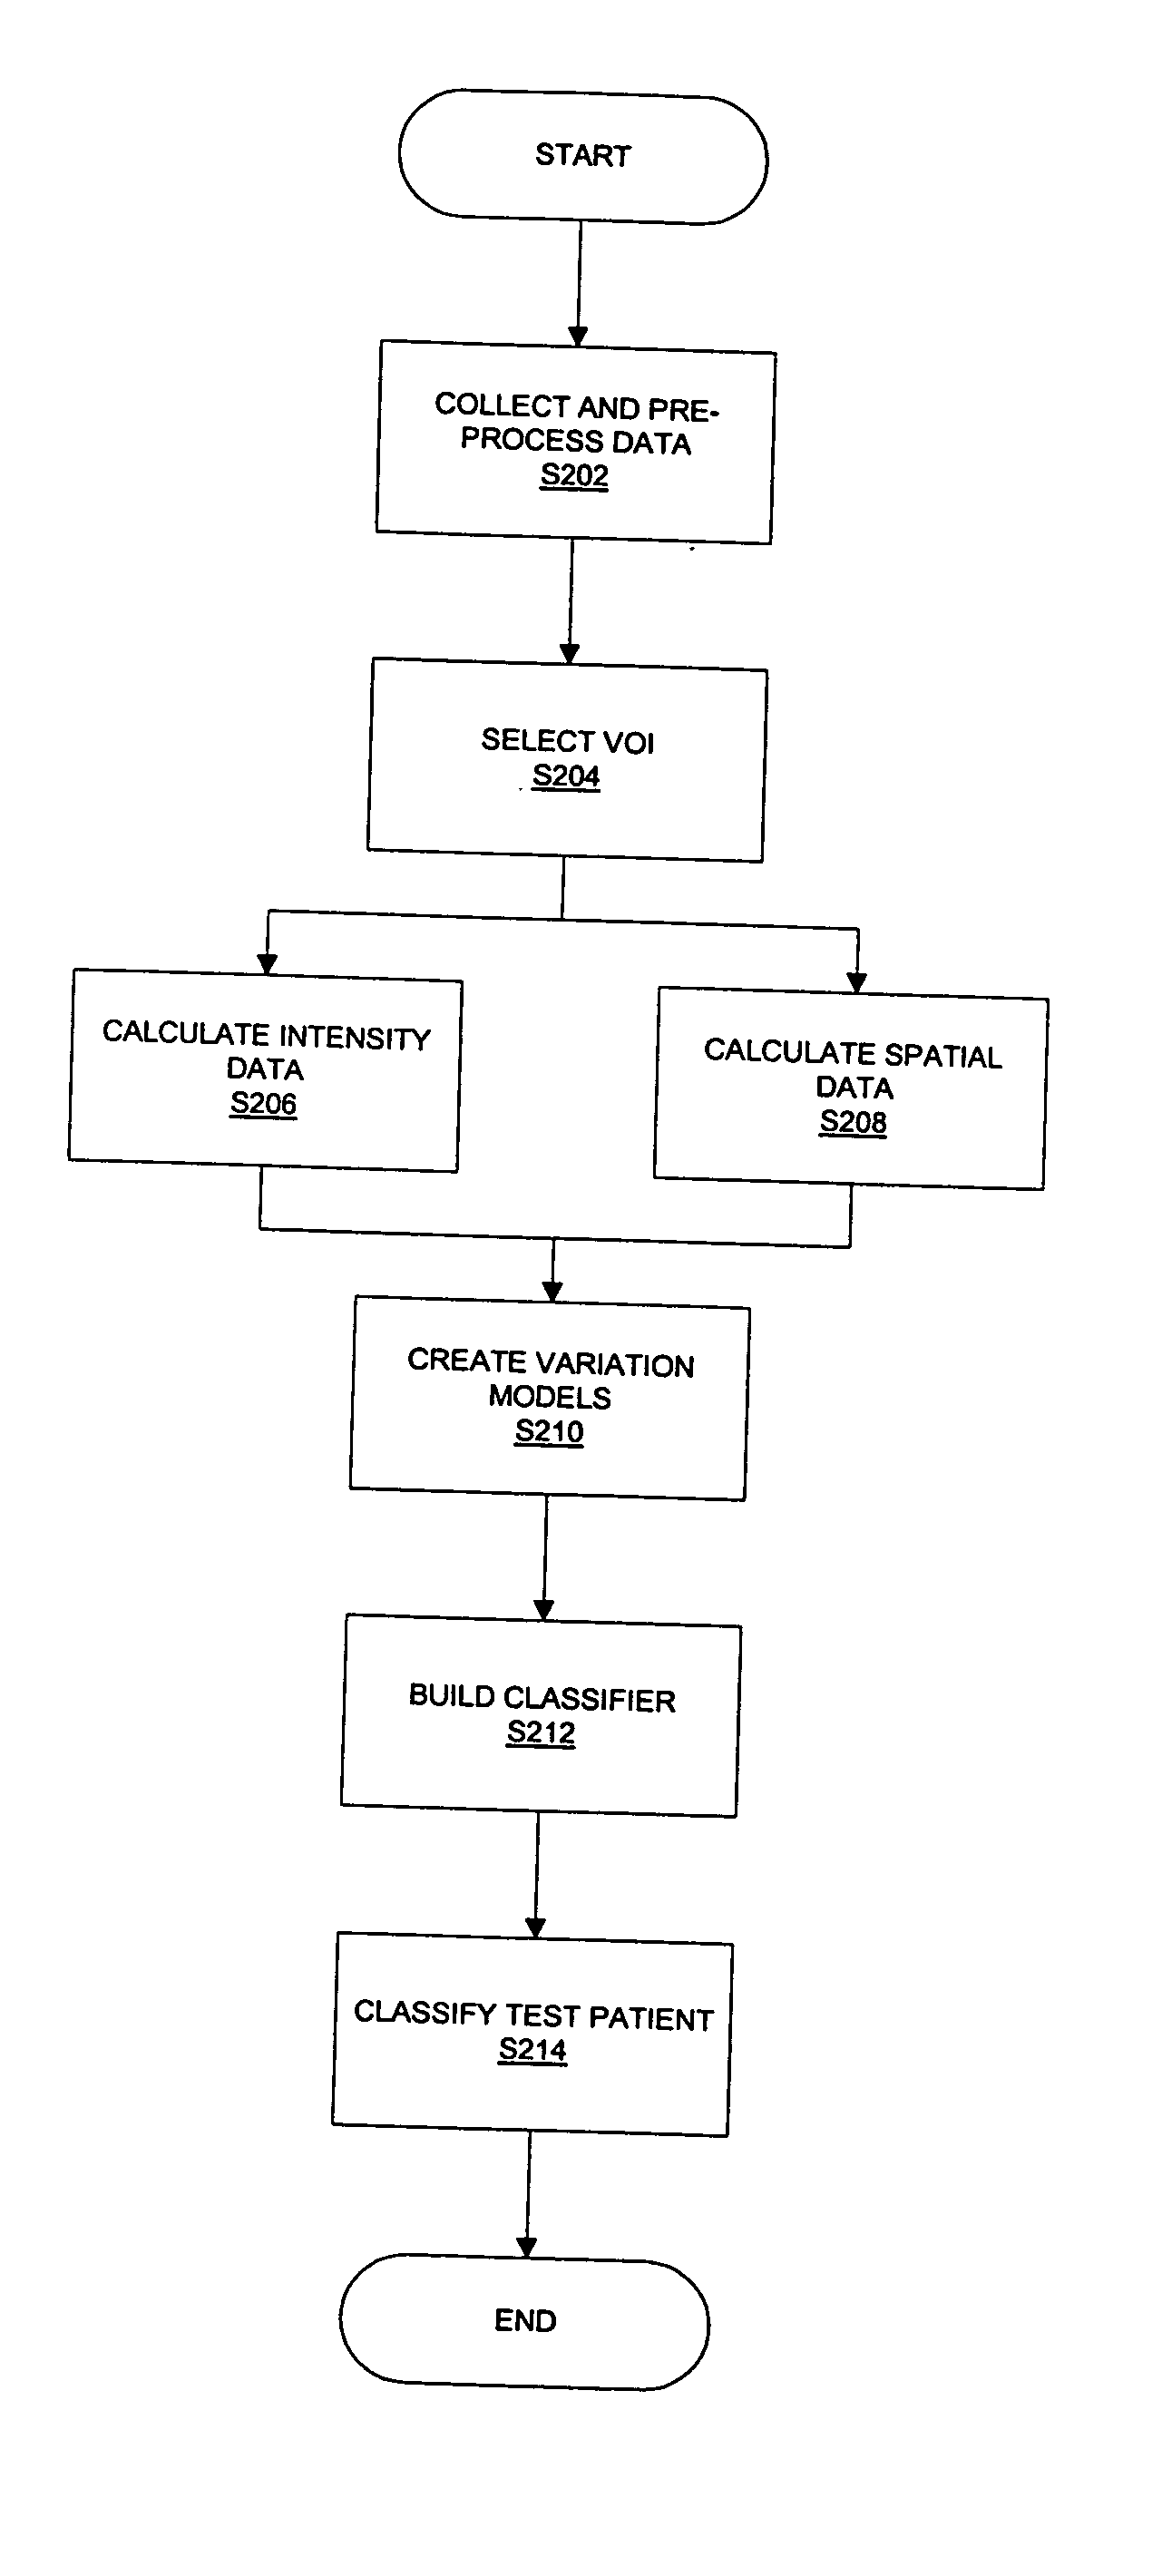
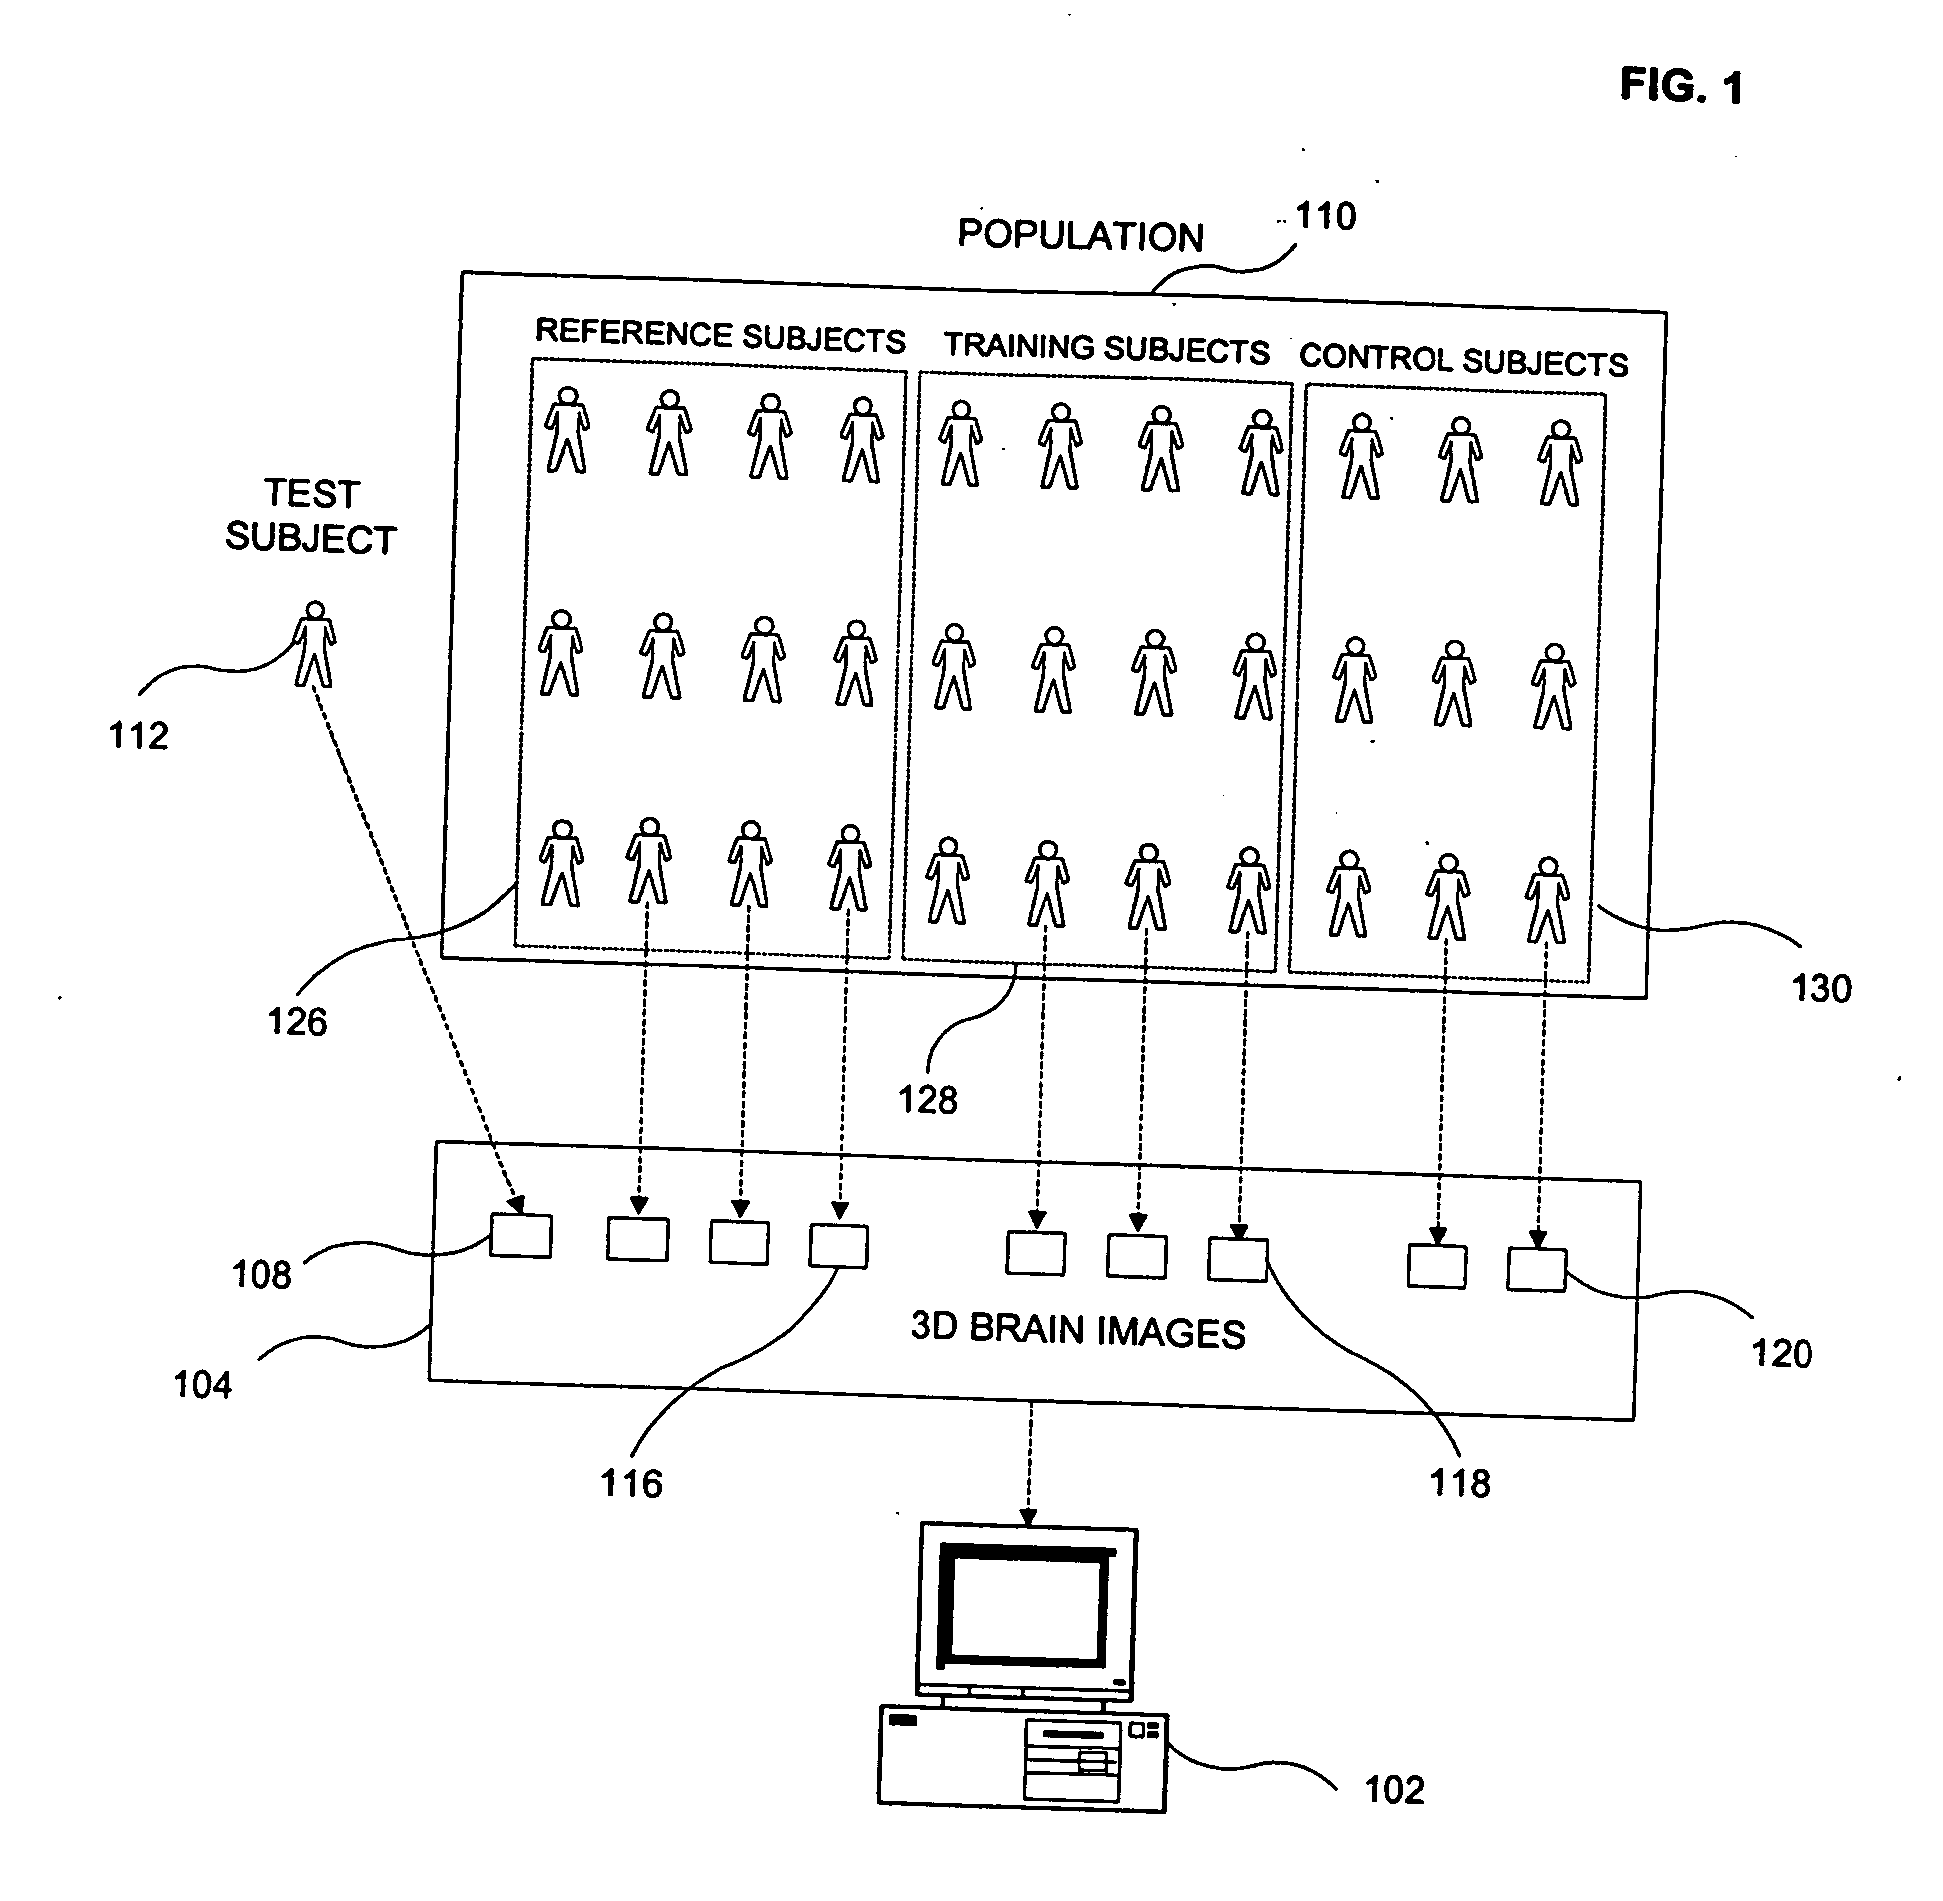
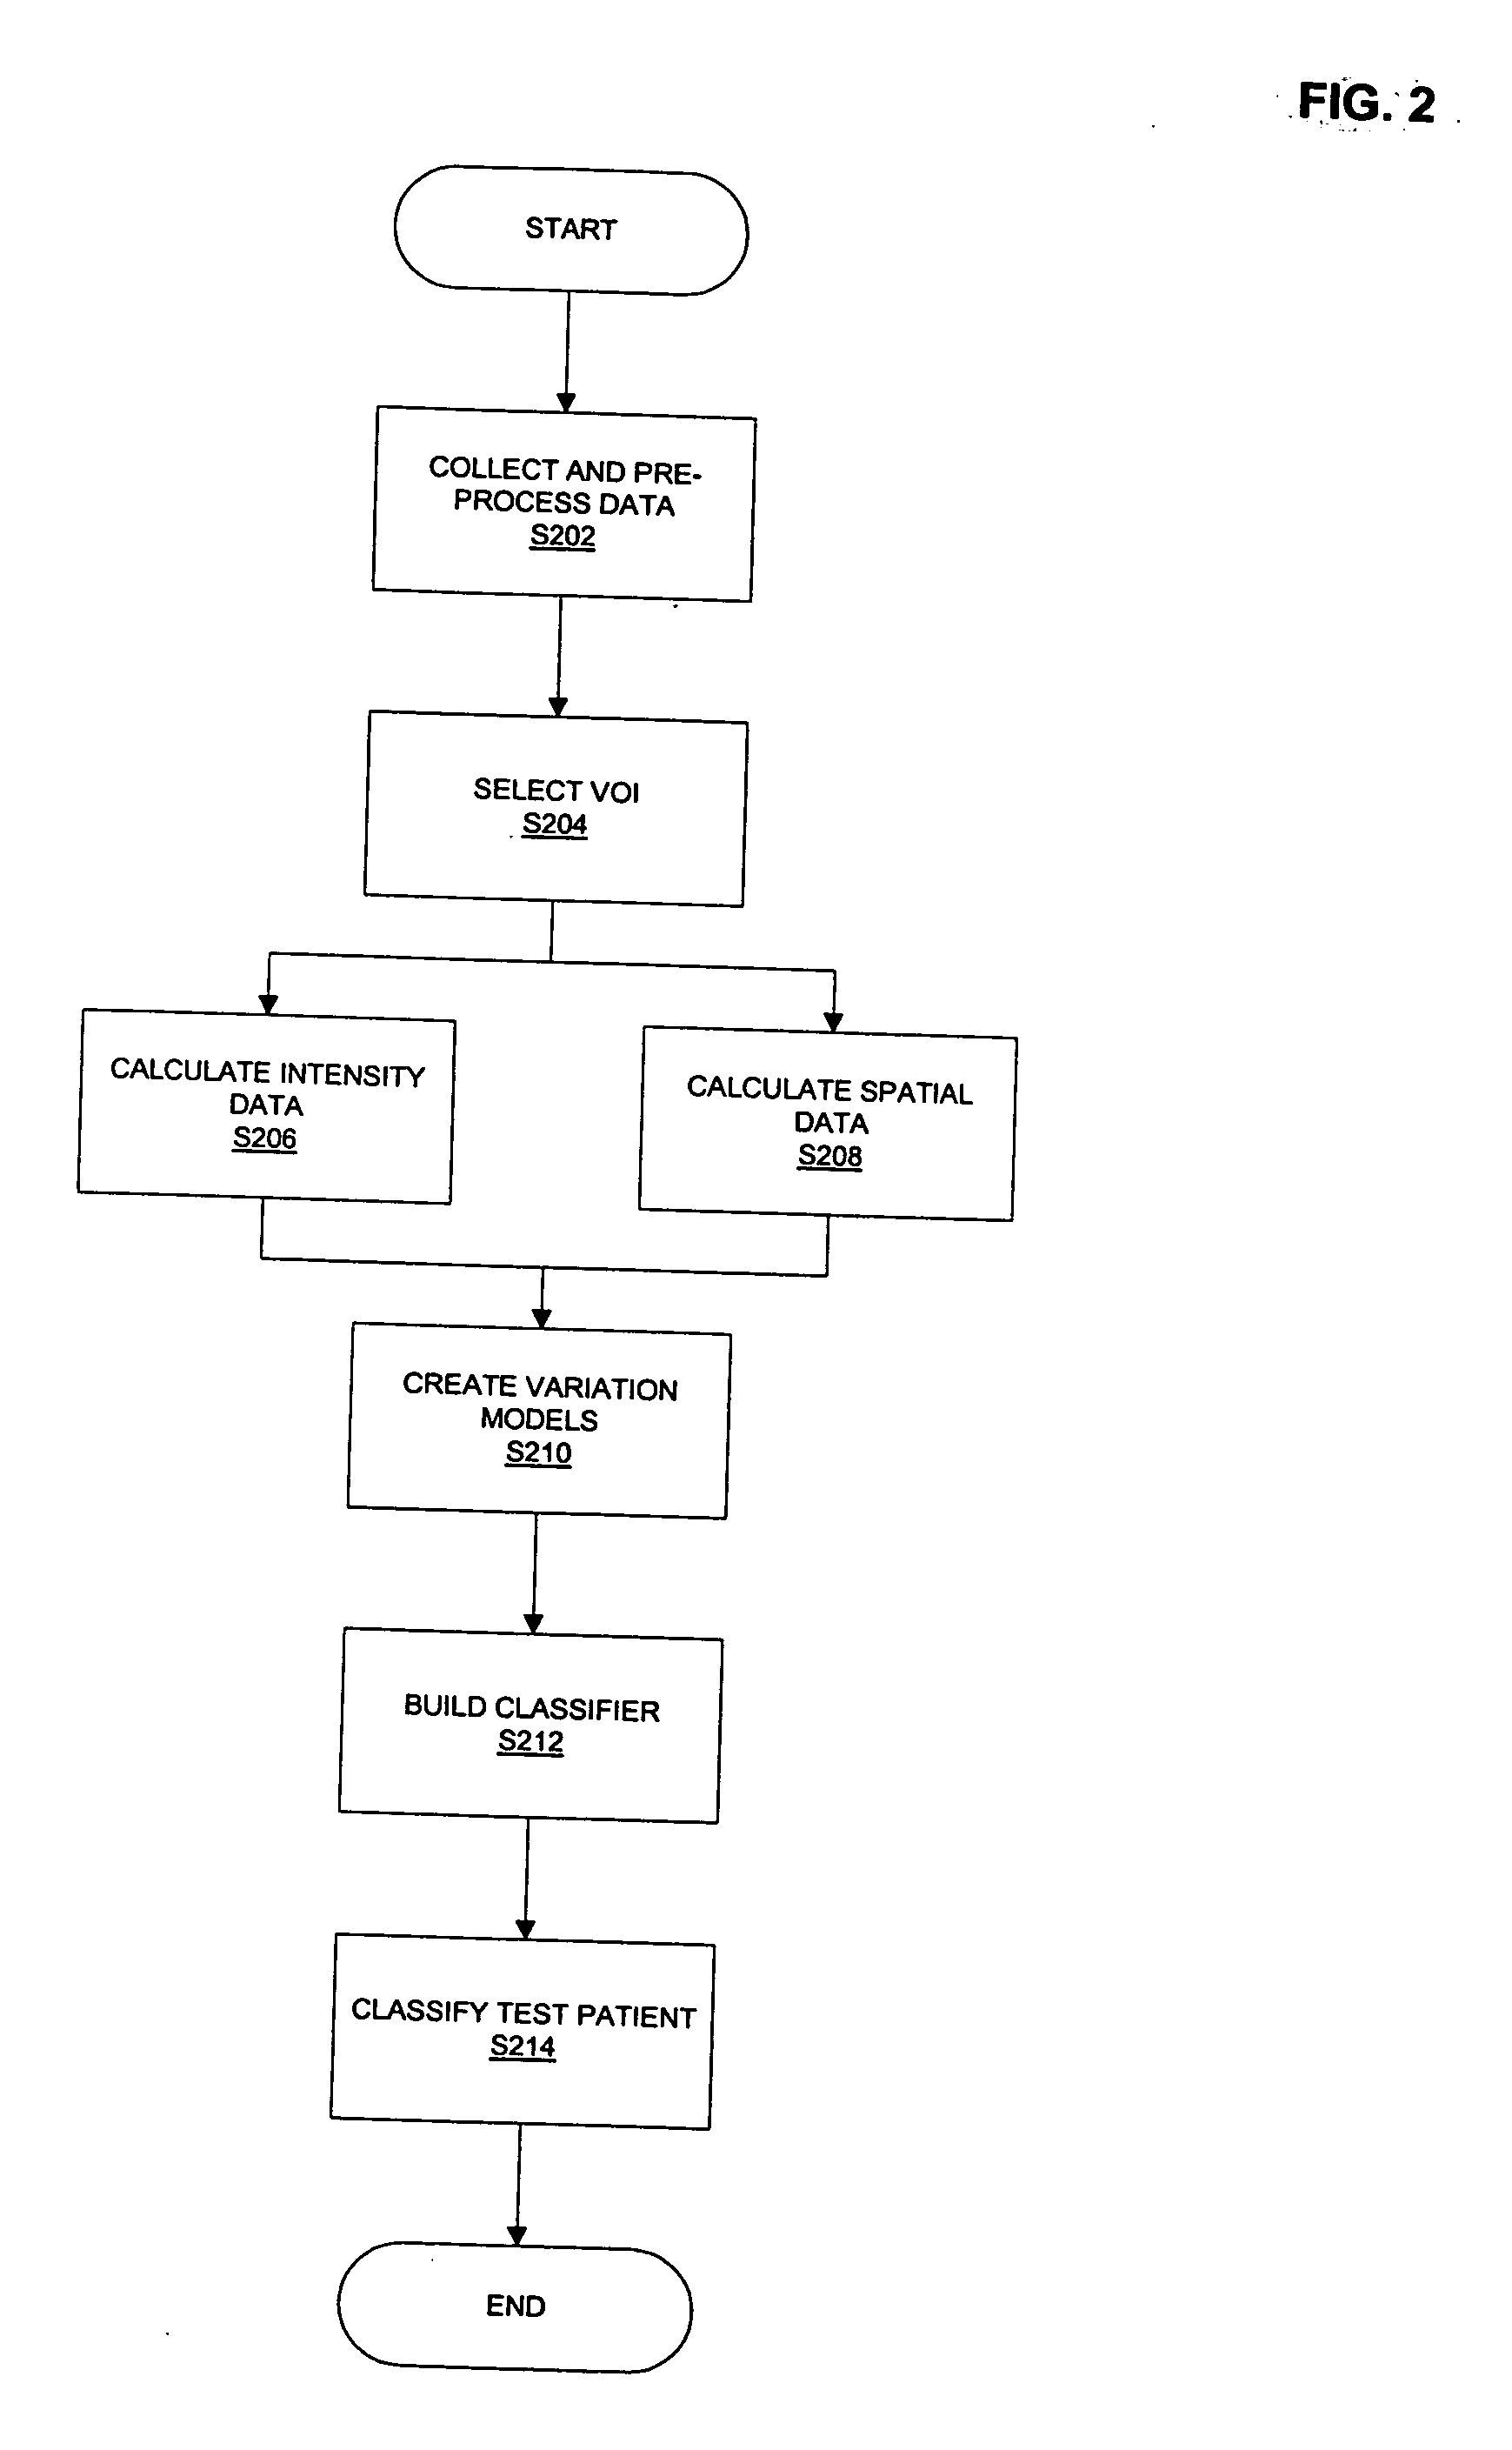
[0029] A schematic illustration of the design of an automated classification system 102 in manners exemplary of the present invention is shown in FIG. 1. The example automated classification system 102 determines a classification and diagnosis of the neurological disease state of a given test subject 112, based on 3D image data of the brain 104. The image data 104 may be mono-modal or multi-modal. Possible types of images that may be acquired include, but are not limited to images based on: T1w MRI, T2w MRI, PD MRI, PET, SPECT, and CT.

[0030] As illustrated, example automated classification system 102 is determined using a general purpose computing device, executing software exemplary of the aspects of the present invention. The computing device may have any suitable combination of dynamic and persistent storage memory. To classify the disease state of a test subject 112, a plurality of 3D images 104 is first collected from subjects in population 110 (in some embodiments, typically ...


PUM


Abstract

A method of classifying a test subject comprises collecting imaging data for a plurality of training subjects, control subjects and a test subject. An intensity volume of interest (VOI) and a spatial VOI are selected from said imaging data. Training intensity data and spatial data are calculated for the intensity and spatial VOI. A statistical model can then be created based on the training intensity data and training spatial data to provide a universe of subjects. Control intensity data and spatial data are also calculated for the intensity and spatial VOI. A classifier can then be built dividing the universe into at least two regions. The test subject data can then be applied to the classifier to provide a determination of whether said test subject falls within the first region or the second region. The condition can be a neurological disease state such as temporal lobe epilepsy or Alzheimer's dementia.

Description

FIELD OF THE INVENTION [0001] The present invention relates generally to systems and methods of classification utilizing intensity and spatial data. This invention has particular, but not exclusive application as a computer-aided method and system of achieving diagnosis of neurological diseases or disorders in subjects, via analysis of in vivo medical images of the brain. BACKGROUND OF THE INVENTION [0002] The quantitative analysis of in vivo medical images of the human brain is a growing field of activity and research. A general approach for diagnosis is to detect subtle differences in the composition, morphology or other behavior in the brain as can be imaged by different techniques and equipment (ie. modalities) and relate these differences to clinical phenomena of interest. [0003] Image data can be obtained from various sources including T1 weighted Magnetic Resonance Imaging (“T1w MRI”), T2 weighted MRI (“T2w MRI”), Proton Density weighted MRI (“PD MRI”), Photon Emission Tomogr...

Claims


Application Information

Patent Timeline
Patent Type & Authority Applications(United States)
IPC IPC(8): G06K9/00G06K9/62
CPCG06F19/3443G06T7/0012G06T2207/30016G16H50/70
Inventor COLLINS, LOUISDUCHESNE, SIMON
Owner MCGILL UNIV
Why Eureka
Try Eureka