Method for visualization of optical network topology

a topology and optical network technology, applied in the field of network topology visualization, can solve the problems that none of the current technologies provides adequate visualization for monitoring both network topology and network performance, and achieve the effect of improving network performance monitoring, facilitating and improving network reliability

Inactive Publication Date: 2006-06-15
TROPIC NETWORKS
View PDF11 Cites 36 Cited by
  • Summary
  • Abstract
  • Description
  • Claims
  • Application Information

AI Technical Summary

Benefits of technology

[0006] It is therefore an object of the invention to provide a method for visualization of the topology of an optical network, which would avoid the afore-mentioned drawbacks.
[0029] The described method of visualization of the network topology has the following advantages. It provides more effective monitoring of the network performance and ensures much easier and more reliable control of operation of the network.

Problems solved by technology

Unfortunately, none of the current technologies provides adequate visualization for monitoring both network topology and network performance.

Method used


Image

  • Method for visualization of optical network topology
  • Method for visualization of optical network topology
  • Method for visualization of optical network topology

Examples


Embodiment Construction

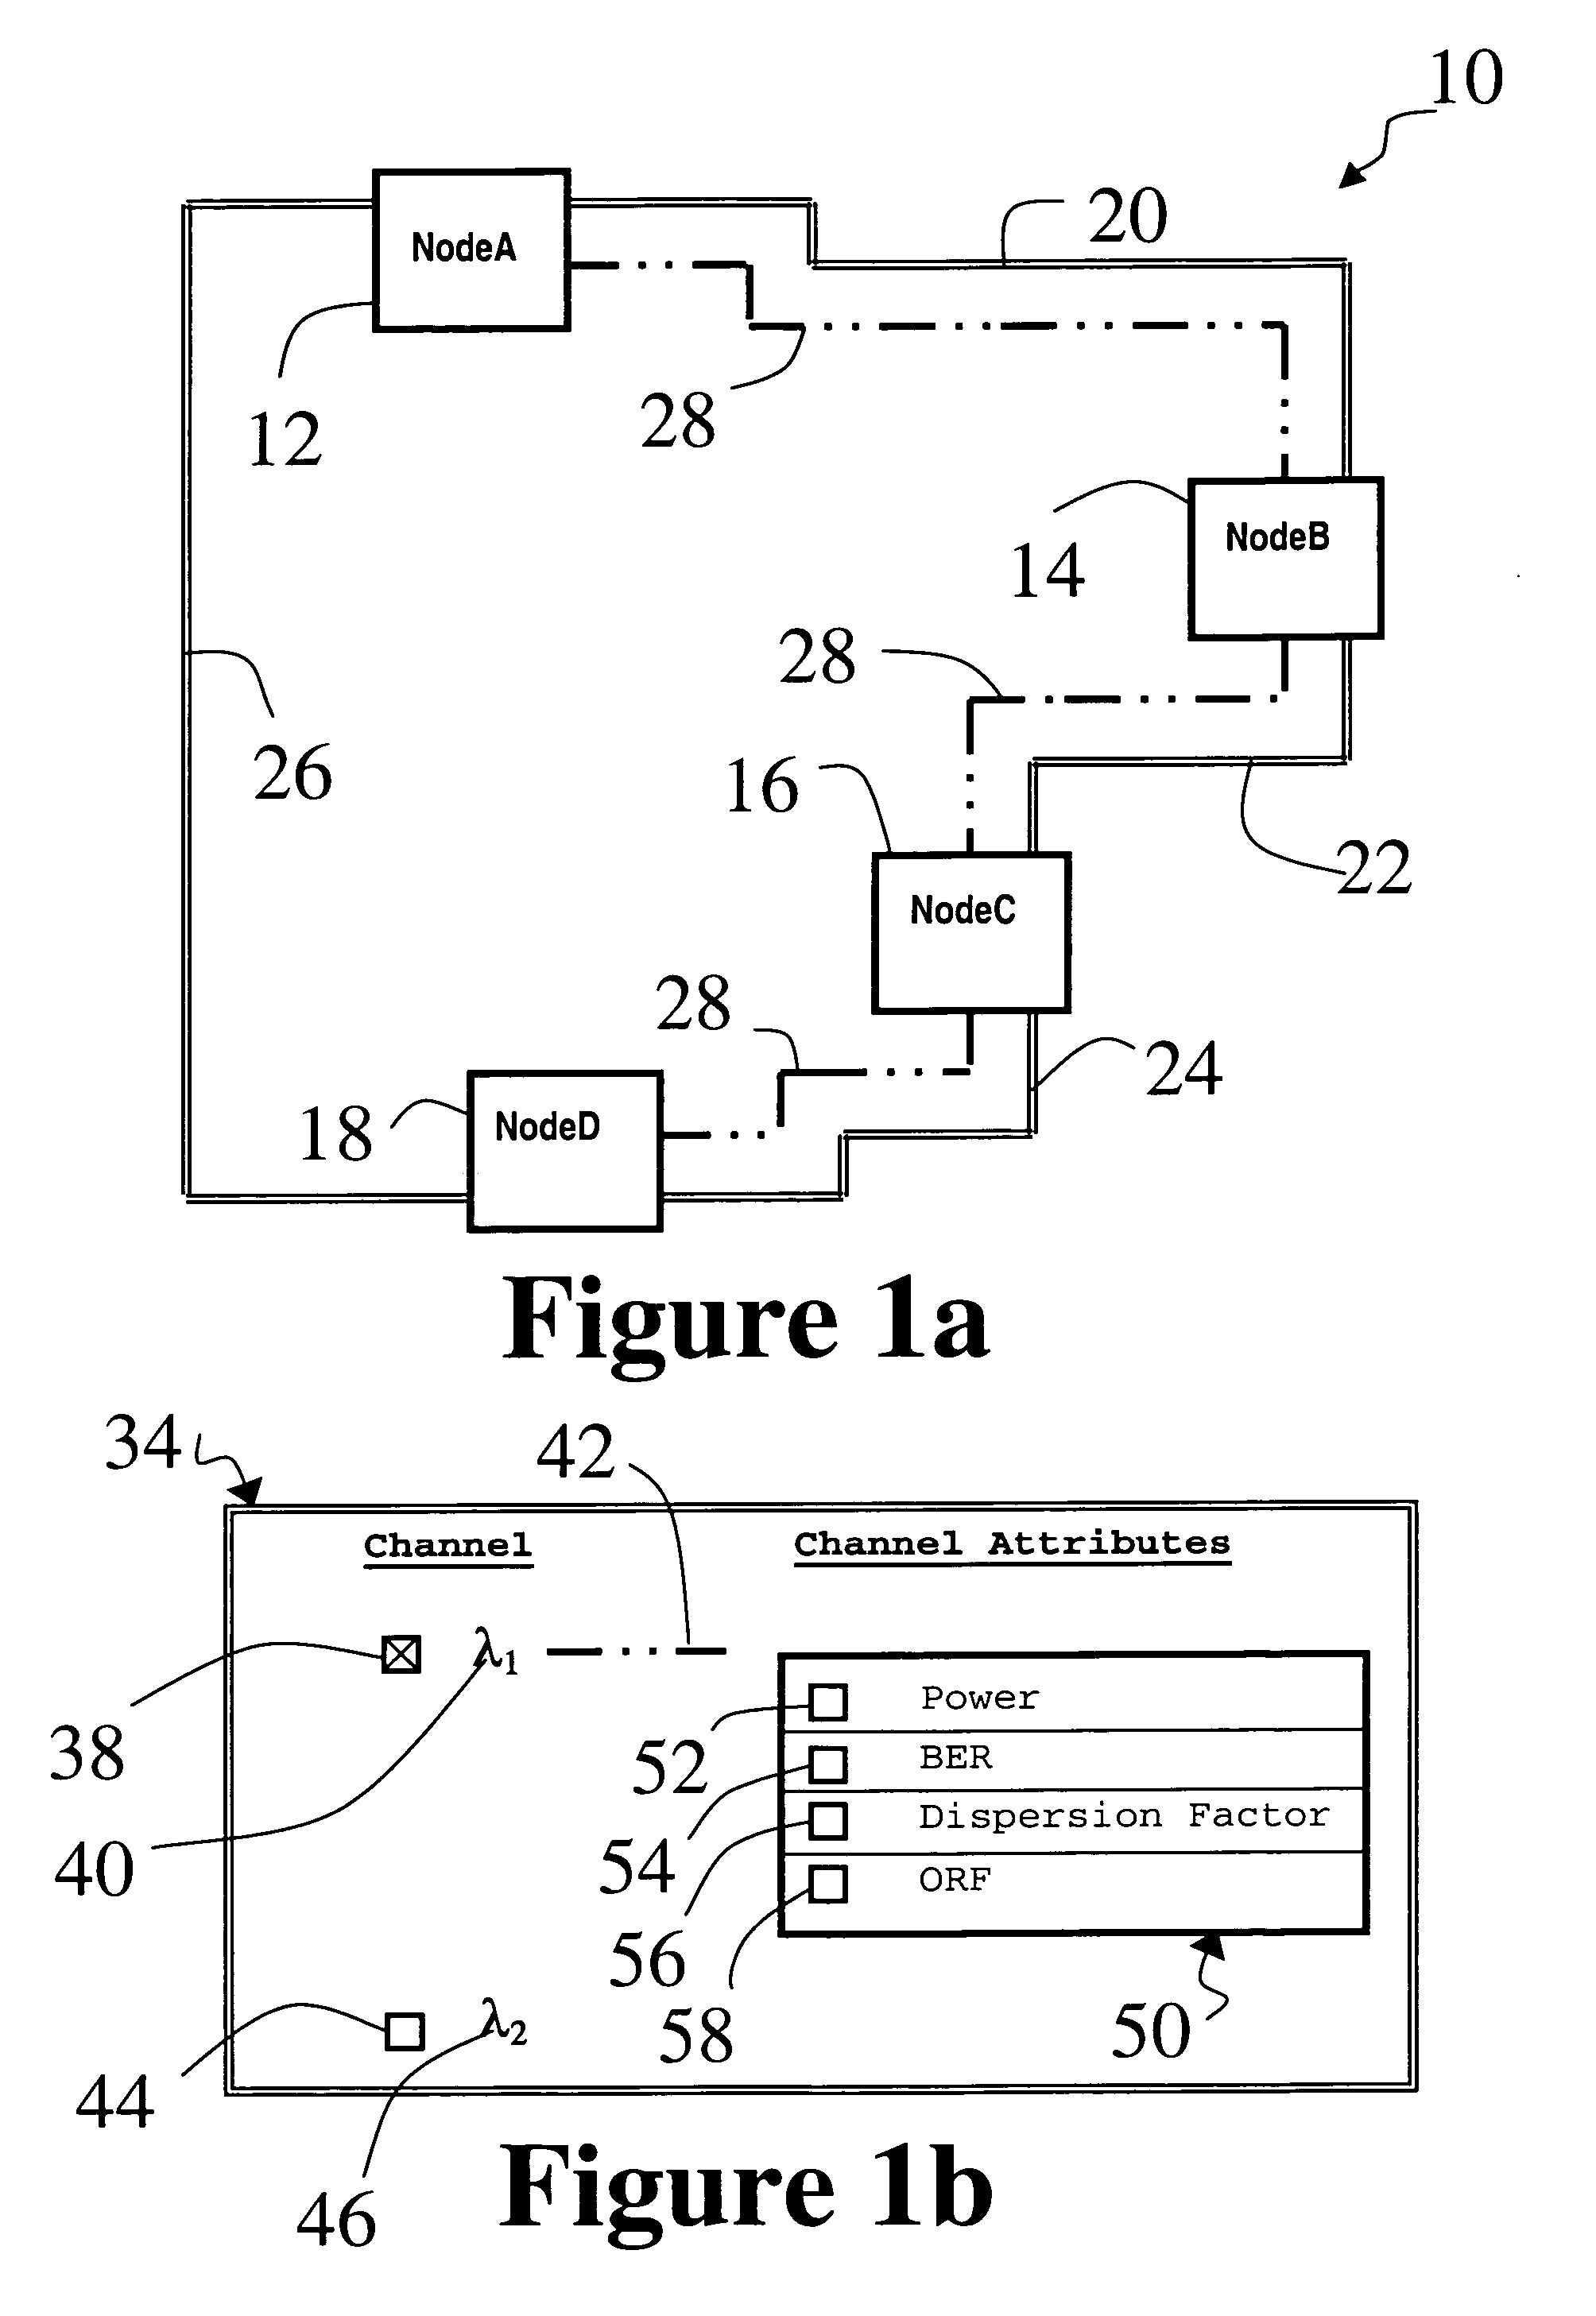
[0046]FIG. 1a illustrates the visualization of an optical network by means of a graphical display 10, according to a first embodiment of the invention. The network comprises four network elements called nodeA, nodeB, nodeC and nodeD, and labeled 12, 14, 16 and 18 respectively. An optical fiber link 20 connects NodeA to nodeB, another link 22 connects nodeB to nodeC, yet another link 24 connects nodeC to nodeD, and link 26 connects nodeD to nodeA. An optical wavelength channel 28, hereinafter referred to as a channel, is shown being carried by the optical fiber 20 between the nodeA 12 and nodeB 14. The same channel 28 is carried by optical fiber 22 between nodeB 14 and nodeC 16, and again by optical fiber 24 between nodeC 16 and nodeD 18. Thus, the channel 28 traverses a path between nodeA 12 and nodeD 18, comprising three segments (fiber links 20, 22 and 24 respectively), each segment being highlighted with an identifying pattern, a long dash and two dots in FIG. 1a. FIG. 1b illustr...


PUM


Abstract

A method for the simultaneous graphical display of paths of optical wavelength channels in a telecommunications network together with one or more channel attributes is provided. The graphical display of the network also shows the direction of data flow transported by the channels. An audible or visual alarm for an error condition for a channel attribute on a link in the network can be produced if requires. The operator can also obtain detailed information on a channel by positioning the mouse over a channel.

Description

RELATED APPLICATIONS [0001] This application is a divisional application from the U.S. application Ser. No. 10 / 101,155 filed 20 Mar. 2002 to Nelles entitled “A Method for Visualization of optical Network Topology”, which is incorporated herein by reference.FIELD OF THE INVENTION [0002] The invention relates to networks, and in particular to a method and system for visualizing a topology of a network. BACKGROUND OF THE INVENTION [0003] As communications networks have grown in complexity, the task of effective network management has become increasingly important. An important aspect of network management is the topology of the network, which traditionally includes network connectivity. Equally important for effective network management and planning is information concerning configuration and performance characteristics, such as bandwidth and load. [0004] The visual representation of networks in traditional network management systems is limited to the topology and connectivity of the n...

Claims


Application Information

Patent Timeline
Patent Type & Authority Applications(United States)
IPC IPC(8): G06F17/00H04B10/08H04J14/02H04L12/24
CPCH04B10/07H04J14/0227H04J14/0283H04L41/12H04L41/22H04J14/0241
Inventor NELLES, DAVID EDWARDADAMSKI, DANIELOBEDA, PAUL DAVIDDONNELLY, VICTORIA
Owner TROPIC NETWORKS
Why Eureka
Try Eureka