Application delay analysis

a technology of application delay and analysis method, applied in the field of network analysis, can solve the problems of reducing the ability of network manager or application developer to effectively access and use this information, significant amount of time can be wasted, and the network manager or application developer may not be aware of the entire range of capabilities of a particular tool, etc., to facilitate the understanding of the cause of delays

Active Publication Date: 2007-02-01
RIVERBED TECH LLC
View PDF12 Cites 34 Cited by
  • Summary
  • Abstract
  • Description
  • Claims
  • Application Information

AI Technical Summary

Benefits of technology

[0002] This invention relates to the field of network analysis, and in particular to a graphic user interface that facilitates an understanding of the cause of delays within a network-based application, based on a hierarchical organization and presentation of timing information related to the application.
[0006] It is an objective of this invention to provide a method and system that facilitates the analysis of timing information related to network-based applications. It is a further objective to provide an easy to use graphic interface for controlling and displaying timing information relating to network-based applications.
[0007] These objectives, and others, are achieved by a method and system that provides a graphic user interface that facilitates the analysis of timing parameters related to network-based applications in a hierarchical manner. At the top level of the hierarchy, the user is presented a summary of the delays incurred while running an application, or while simulating the running of an application, organized by delay categories, including processing delays at each node, as well as propagation delays at each link between nodes. The interface enables a user to “drill down” into lower levels of the timing information hierarchy by ‘clicking’ on currently displayed information. The information is presented in a form most appropriate to the level of analysis. The presentation forms include, for example, pie-charts, multi-variable timing diagrams (in both absolute and relative forms), data exchange charts, and so on, and ‘zoom’ capabilities are provided as appropriate to the particular display form.

Problems solved by technology

As the availability of information from network analysis tools increases, however, the ability of a network manager or application developer to effectively access and use this information tends to decrease.
A network manager or application developer may not be aware of the entire range of capabilities of a particular tool.
In many instances, a particular user may not use the same vocabulary that the provider of the tool uses, and significant amounts of time can be wasted merely searching for a particular differently-named feature.
Additionally, even when the desired information is found, it is often difficult to determine which “next” information set to review, to further isolate a particular problem or investigation.
And, if this “next” information is presented in a different context than the currently viewed information, the context-shift may also tend to distract and / or confuse the user.

Method used


Image

  • Application delay analysis
  • Application delay analysis
  • Application delay analysis

Examples


Embodiment Construction

[0017] In the following description, for purposes of explanation rather than limitation, specific details are set forth such as the particular architecture, interfaces, techniques, etc., in order to provide a thorough understanding of the concepts of the invention. However, it will be apparent to those skilled in the art that the present invention may be practiced in other embodiments, which depart from these specific details. In like manner, the text of this description is directed to the example embodiments as illustrated in the Figures, and is not intended to limit the claimed invention beyond the limits expressly included in the claims. For purposes of simplicity and clarity, detailed descriptions of well-known devices, circuits, and methods are omitted so as not to obscure the description of the present invention with unnecessary detail.

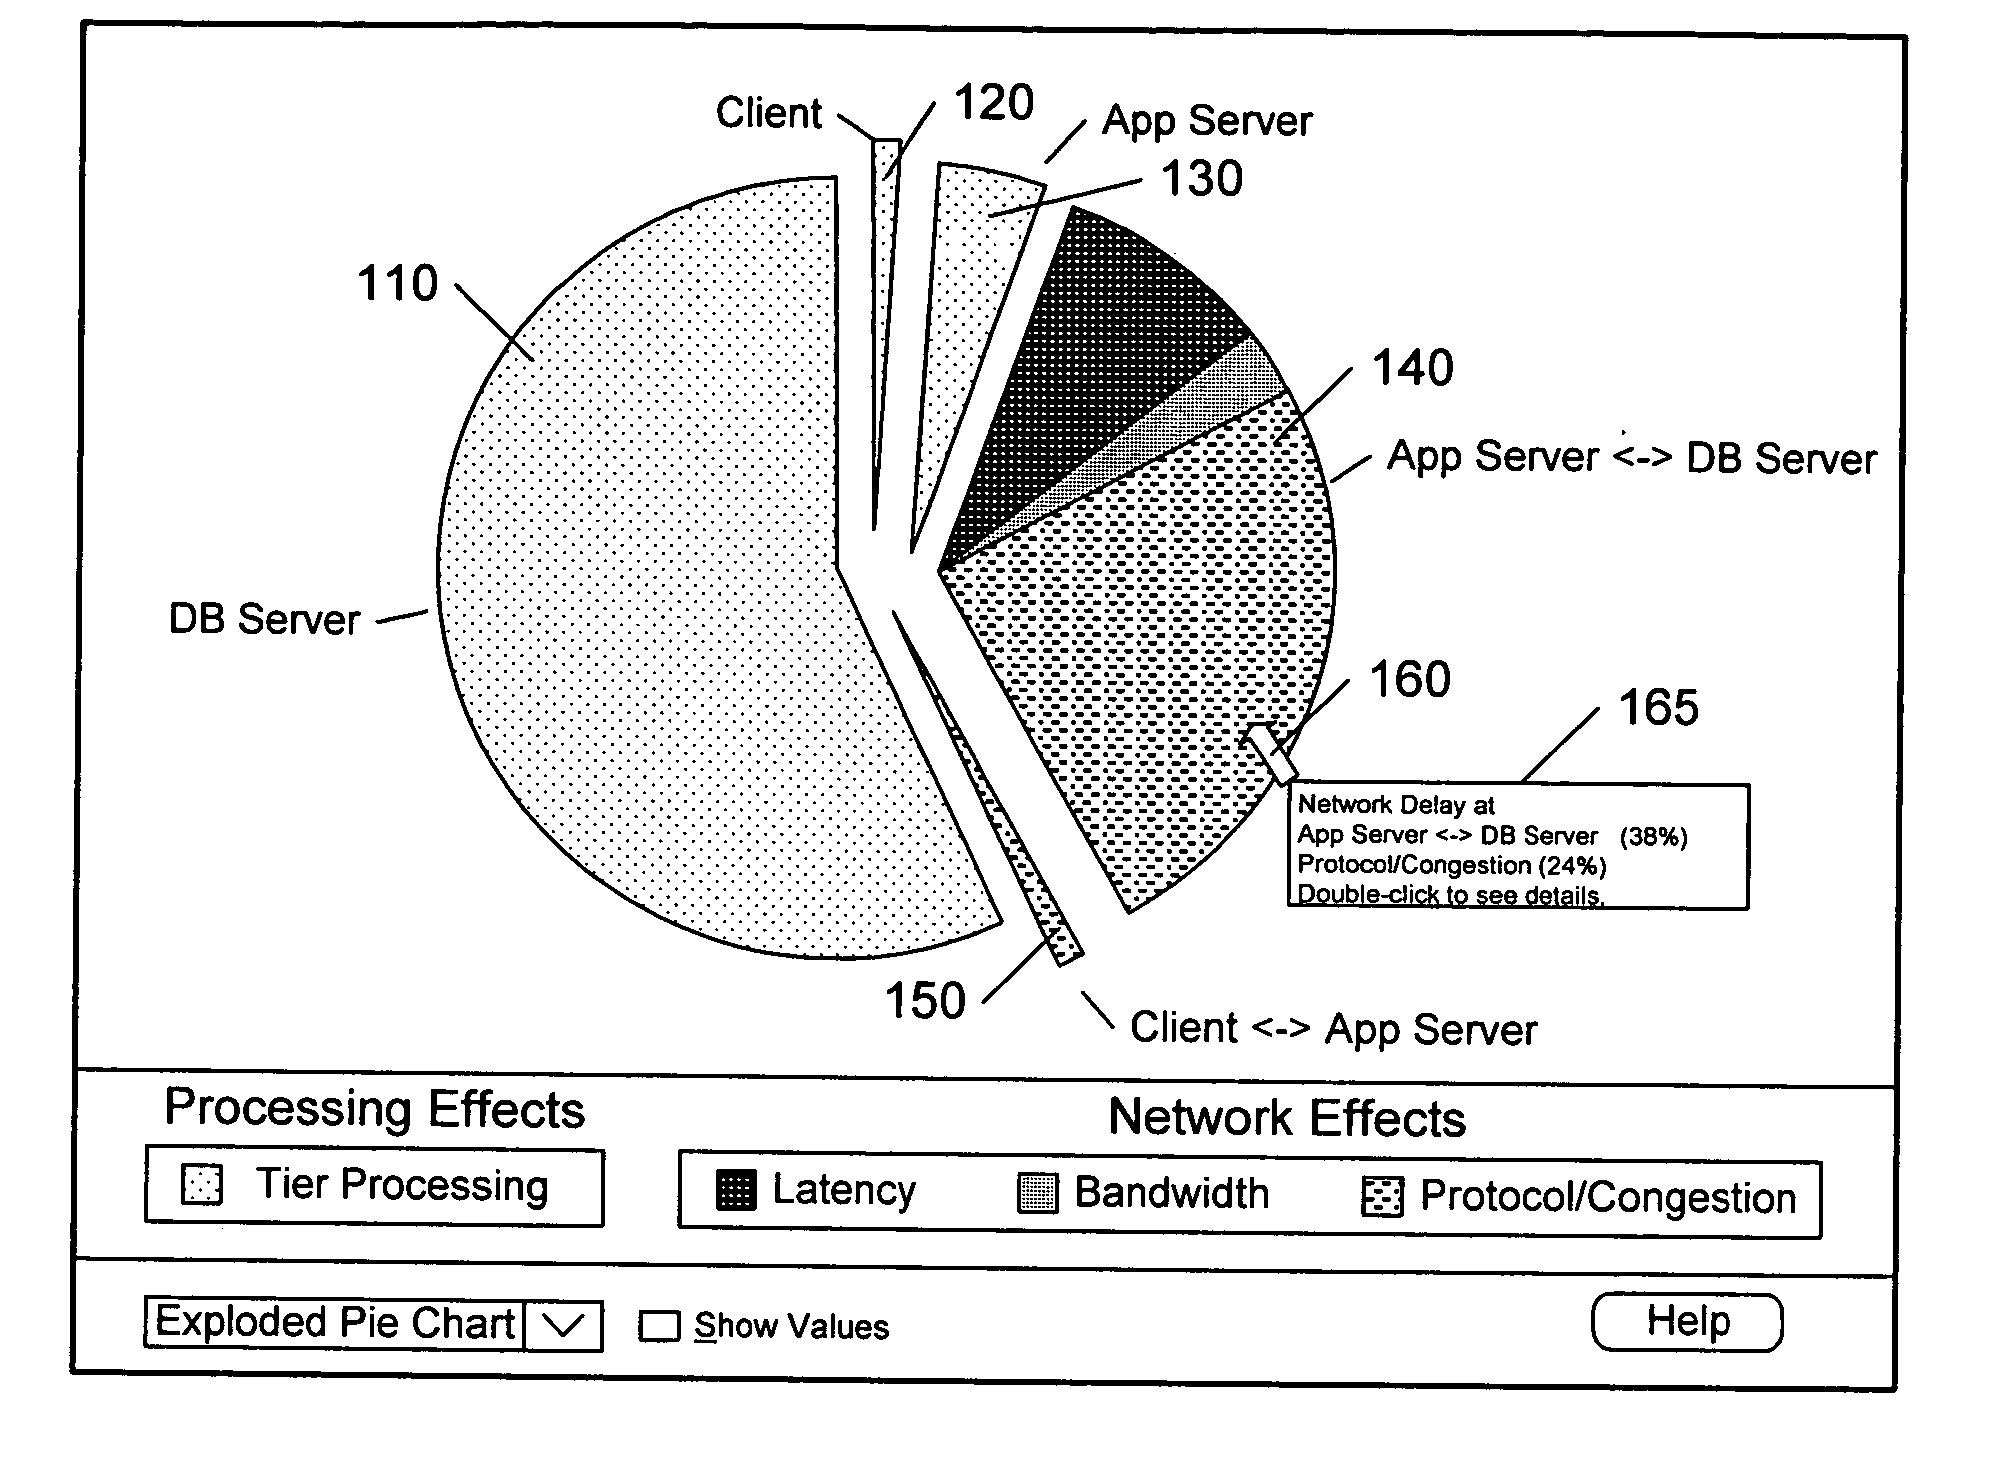
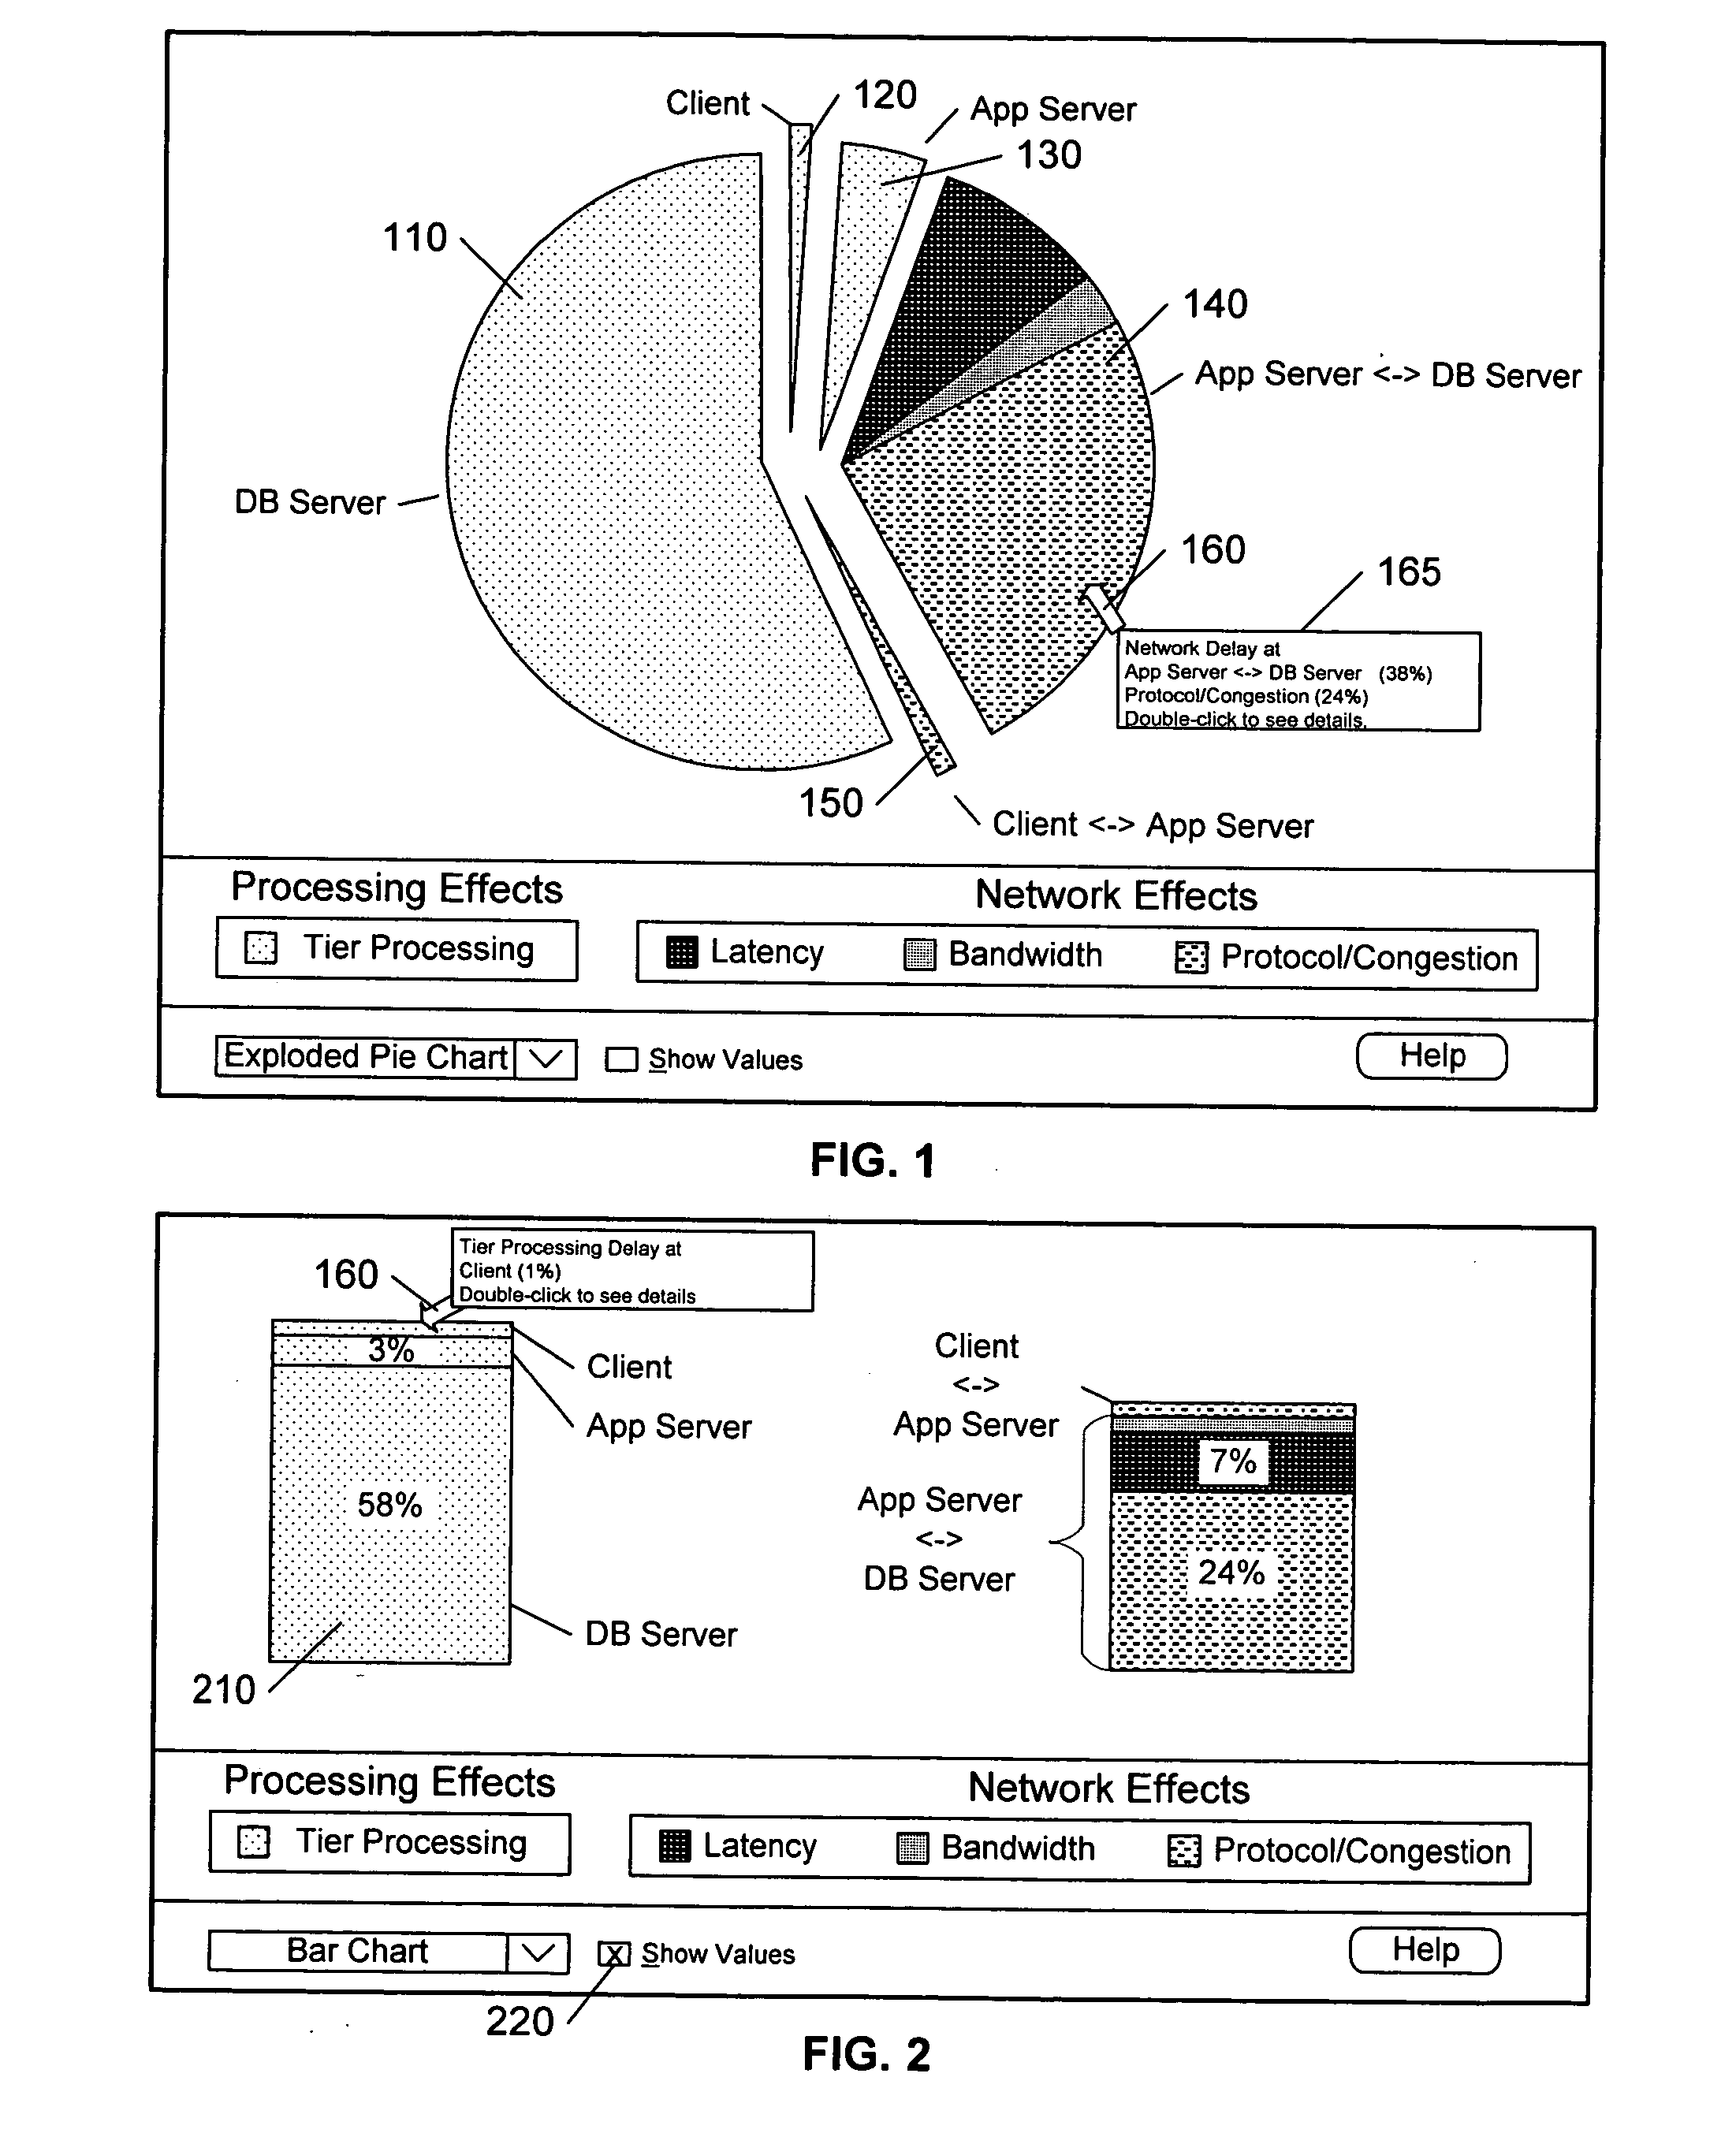
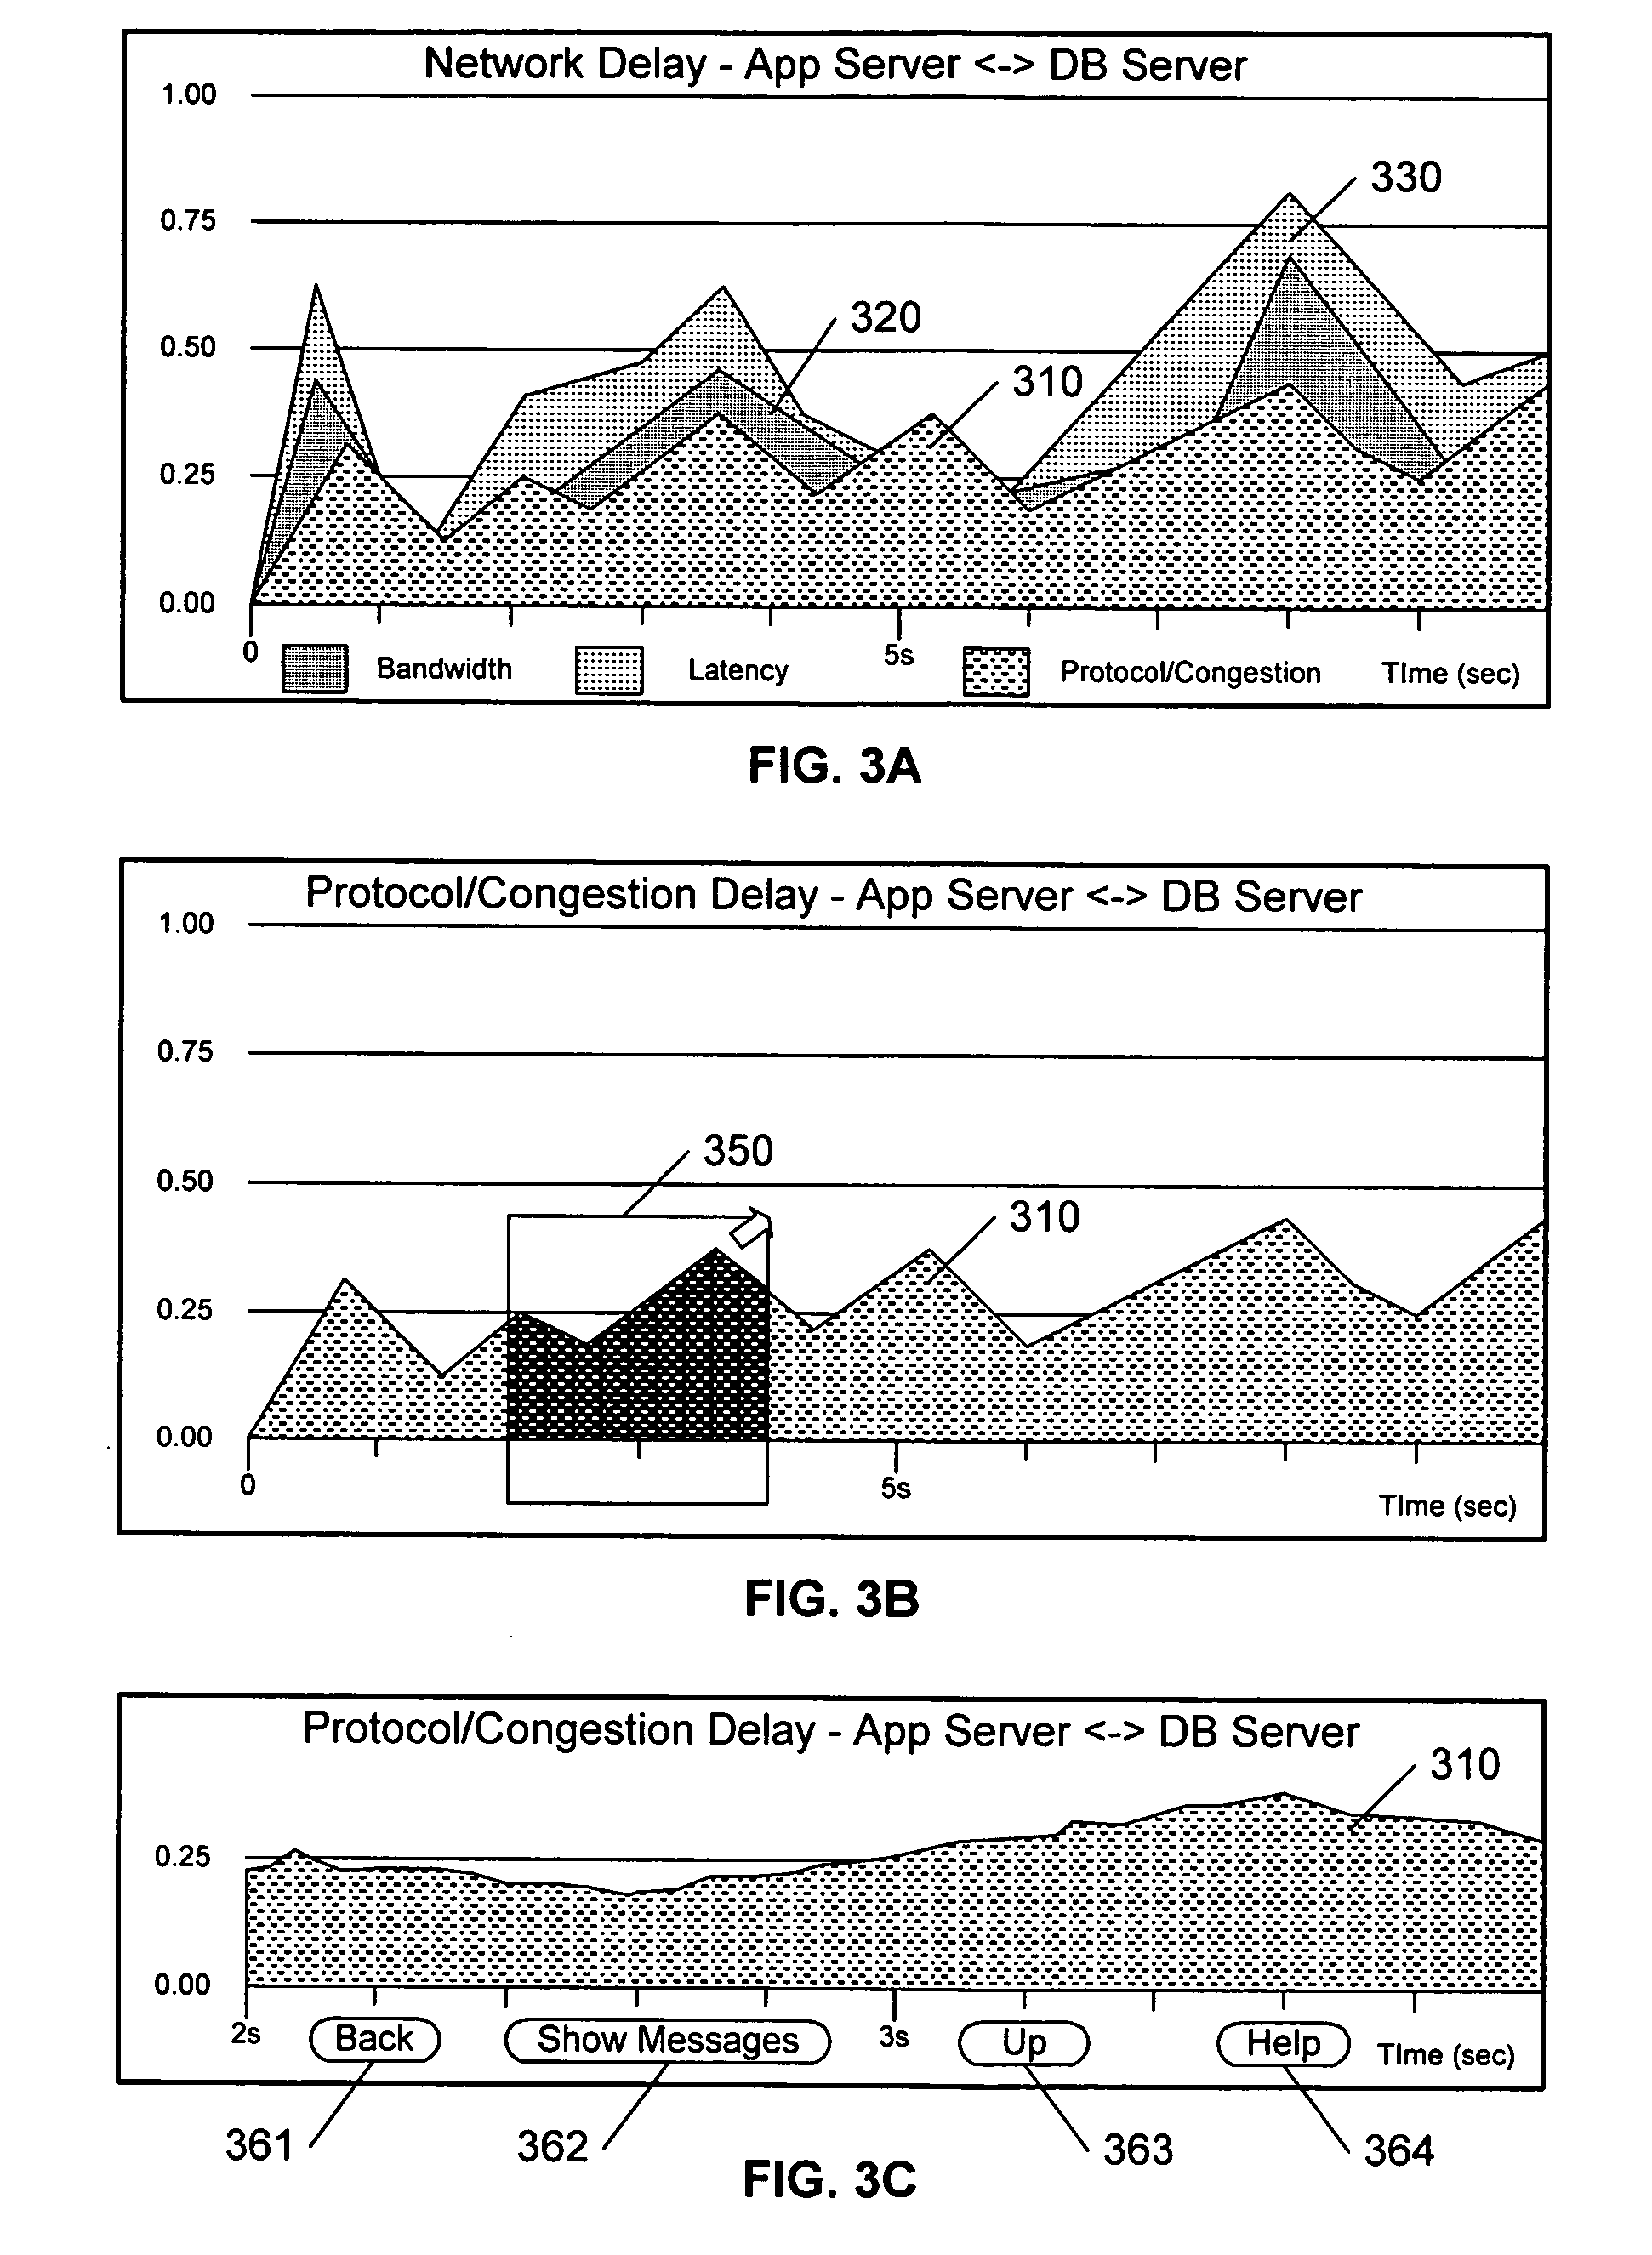
[0018] A goal of the invention is to present high-level information to the users in an intuitive fashion so that they can quickly identify sou...


PUM


Abstract

A graphic user interface facilitates the hierarchical analysis of timing parameters related to network-based applications. At the top level of the hierarchy, the user is presented a summary of the delays incurred while running an application, or while simulating the running of an application, organized by delay categories, including processing delays at each node, as well as propagation delays at each link between nodes. The interface enables a user to “drill down” into lower levels of the timing information hierarchy by ‘clicking’ on currently displayed information. The information is presented in a form most appropriate to the level of analysis. The presentation forms include, for example, pie-charts, multi-variable timing diagrams (in both absolute and relative forms), data exchange charts, and so on, and ‘zoom’ capabilities are provided as appropriate to the particular display form.

Description

[0001] This application claims the benefit of U.S. Provisional Patent Applications 60 / 703,584, filed 29 Jul. 2005.BACKGROUND AND SUMMARY OF THE INVENTION [0002] This invention relates to the field of network analysis, and in particular to a graphic user interface that facilitates an understanding of the cause of delays within a network-based application, based on a hierarchical organization and presentation of timing information related to the application. [0003] The capabilities of network analysis tools continue to increase, as the need for such tools increase in this age of virtually continuous communication, and communication expectations. The demand for efficient and effective communications is fueled by the increasing availability of network-enabled applications. Not only must a communication system provide efficient and reliable links between and among nodes, it must also provide for the efficient and reliable operation of the more popular applications on the network. [0004] ...

Claims


Application Information

Patent Timeline
Patent Type & Authority Applications(United States)
IPC IPC(8): G06F11/00
CPCH04L43/045H04L67/36H04L43/0852H04L67/75
Inventor ELSNER, RUSSELL MARKSTROHM, JOHN WILSONCANNEY, MICHAEL S.
Owner RIVERBED TECH LLC
Why Eureka
Try Eureka