Graphic element with multiple visualizations in a process environment

a process environment and graphic element technology, applied in the field of process plants, can solve the problems of limited usefulness to the specific process function, difficult, if not impossible, to use the graphical program created to support the control or other operator in maintenance, configuration or simulation functions, and the limited graphical capabilities of these displays are difficult to implement. to achieve the effect of more versatile graphic elements

Active Publication Date: 2007-06-14
FISHER-ROSEMOUNT SYST INC
View PDF36 Cites 313 Cited by
  • Summary
  • Abstract
  • Description
  • Claims
  • Application Information

AI Technical Summary

Benefits of technology

[0015] Smart graphic elements are provided for use as portions or components of one or more graphic displays, which may be executed in a process plant to display information to users about the process plant environment, such as the current state of devices within the process plant. Each of the graphic elements is an executable object that includes a property or a variable that may be bound to an associated process entity, like a field device, and that includes multiple visualizations, each of which may be used to graphically depict the associated process entity on a user interface when the graphic element is executed as part of the graphic display. Any of the gra

Problems solved by technology

However, these graphical display applications have, in the past, been created as part of or to support the specific applications with which they are associated, and thus are generally limited in usefulness to the specific process function for which they were created.
For example, it is difficult, if not impossible, to use a graphical program created to support a control or other operator in a maintenance, a configuration or a simulation function.
Still further, the limited graphical capabilities of these displays are hard to implement and are not done so as part of any graphical object.
This process is tedious, time consuming and may be fraught with error.
Unfortunately, the control modules and displays items discussed above are not modular in any manner.
In a plant having many copies of the same type of equipment (i.e., replicated equipment), this process is tedious, time consuming and fraught with operator introduced errors.
Still further, once programmed, these different control modules and displays are not aware of each other.
Therefore, to make a change to the control modules once created, the engineer or operator must manually make the same change to each of the different control modules for the different replicated equipment which, again, is time consuming and tedious.
The same problem applies for the graphical views created for the different sets of replicated equipment within the plant.
This problem is even more evident when graphical views are created for the same equipment but in different functional contexts within the plant, such as for control viewing, maintenance viewing and simulation functions.
As a result, the graphical editors, to the extent they existed, have only enabled the user to create graphics that support specific functionality needed by a specific application.
Previous process plants did not provide a graphical display editor that could be used by or that could support the graphical needs of various or multiple activities being performed in the context of plant configuration and support.
Thus, for example, a graphical display editor used to support or enable control configuration activities only enabled the user to create control programs and did not support

Method used


Image

  • Graphic element with multiple visualizations in a process environment
  • Graphic element with multiple visualizations in a process environment
  • Graphic element with multiple visualizations in a process environment

Examples


Embodiment Construction

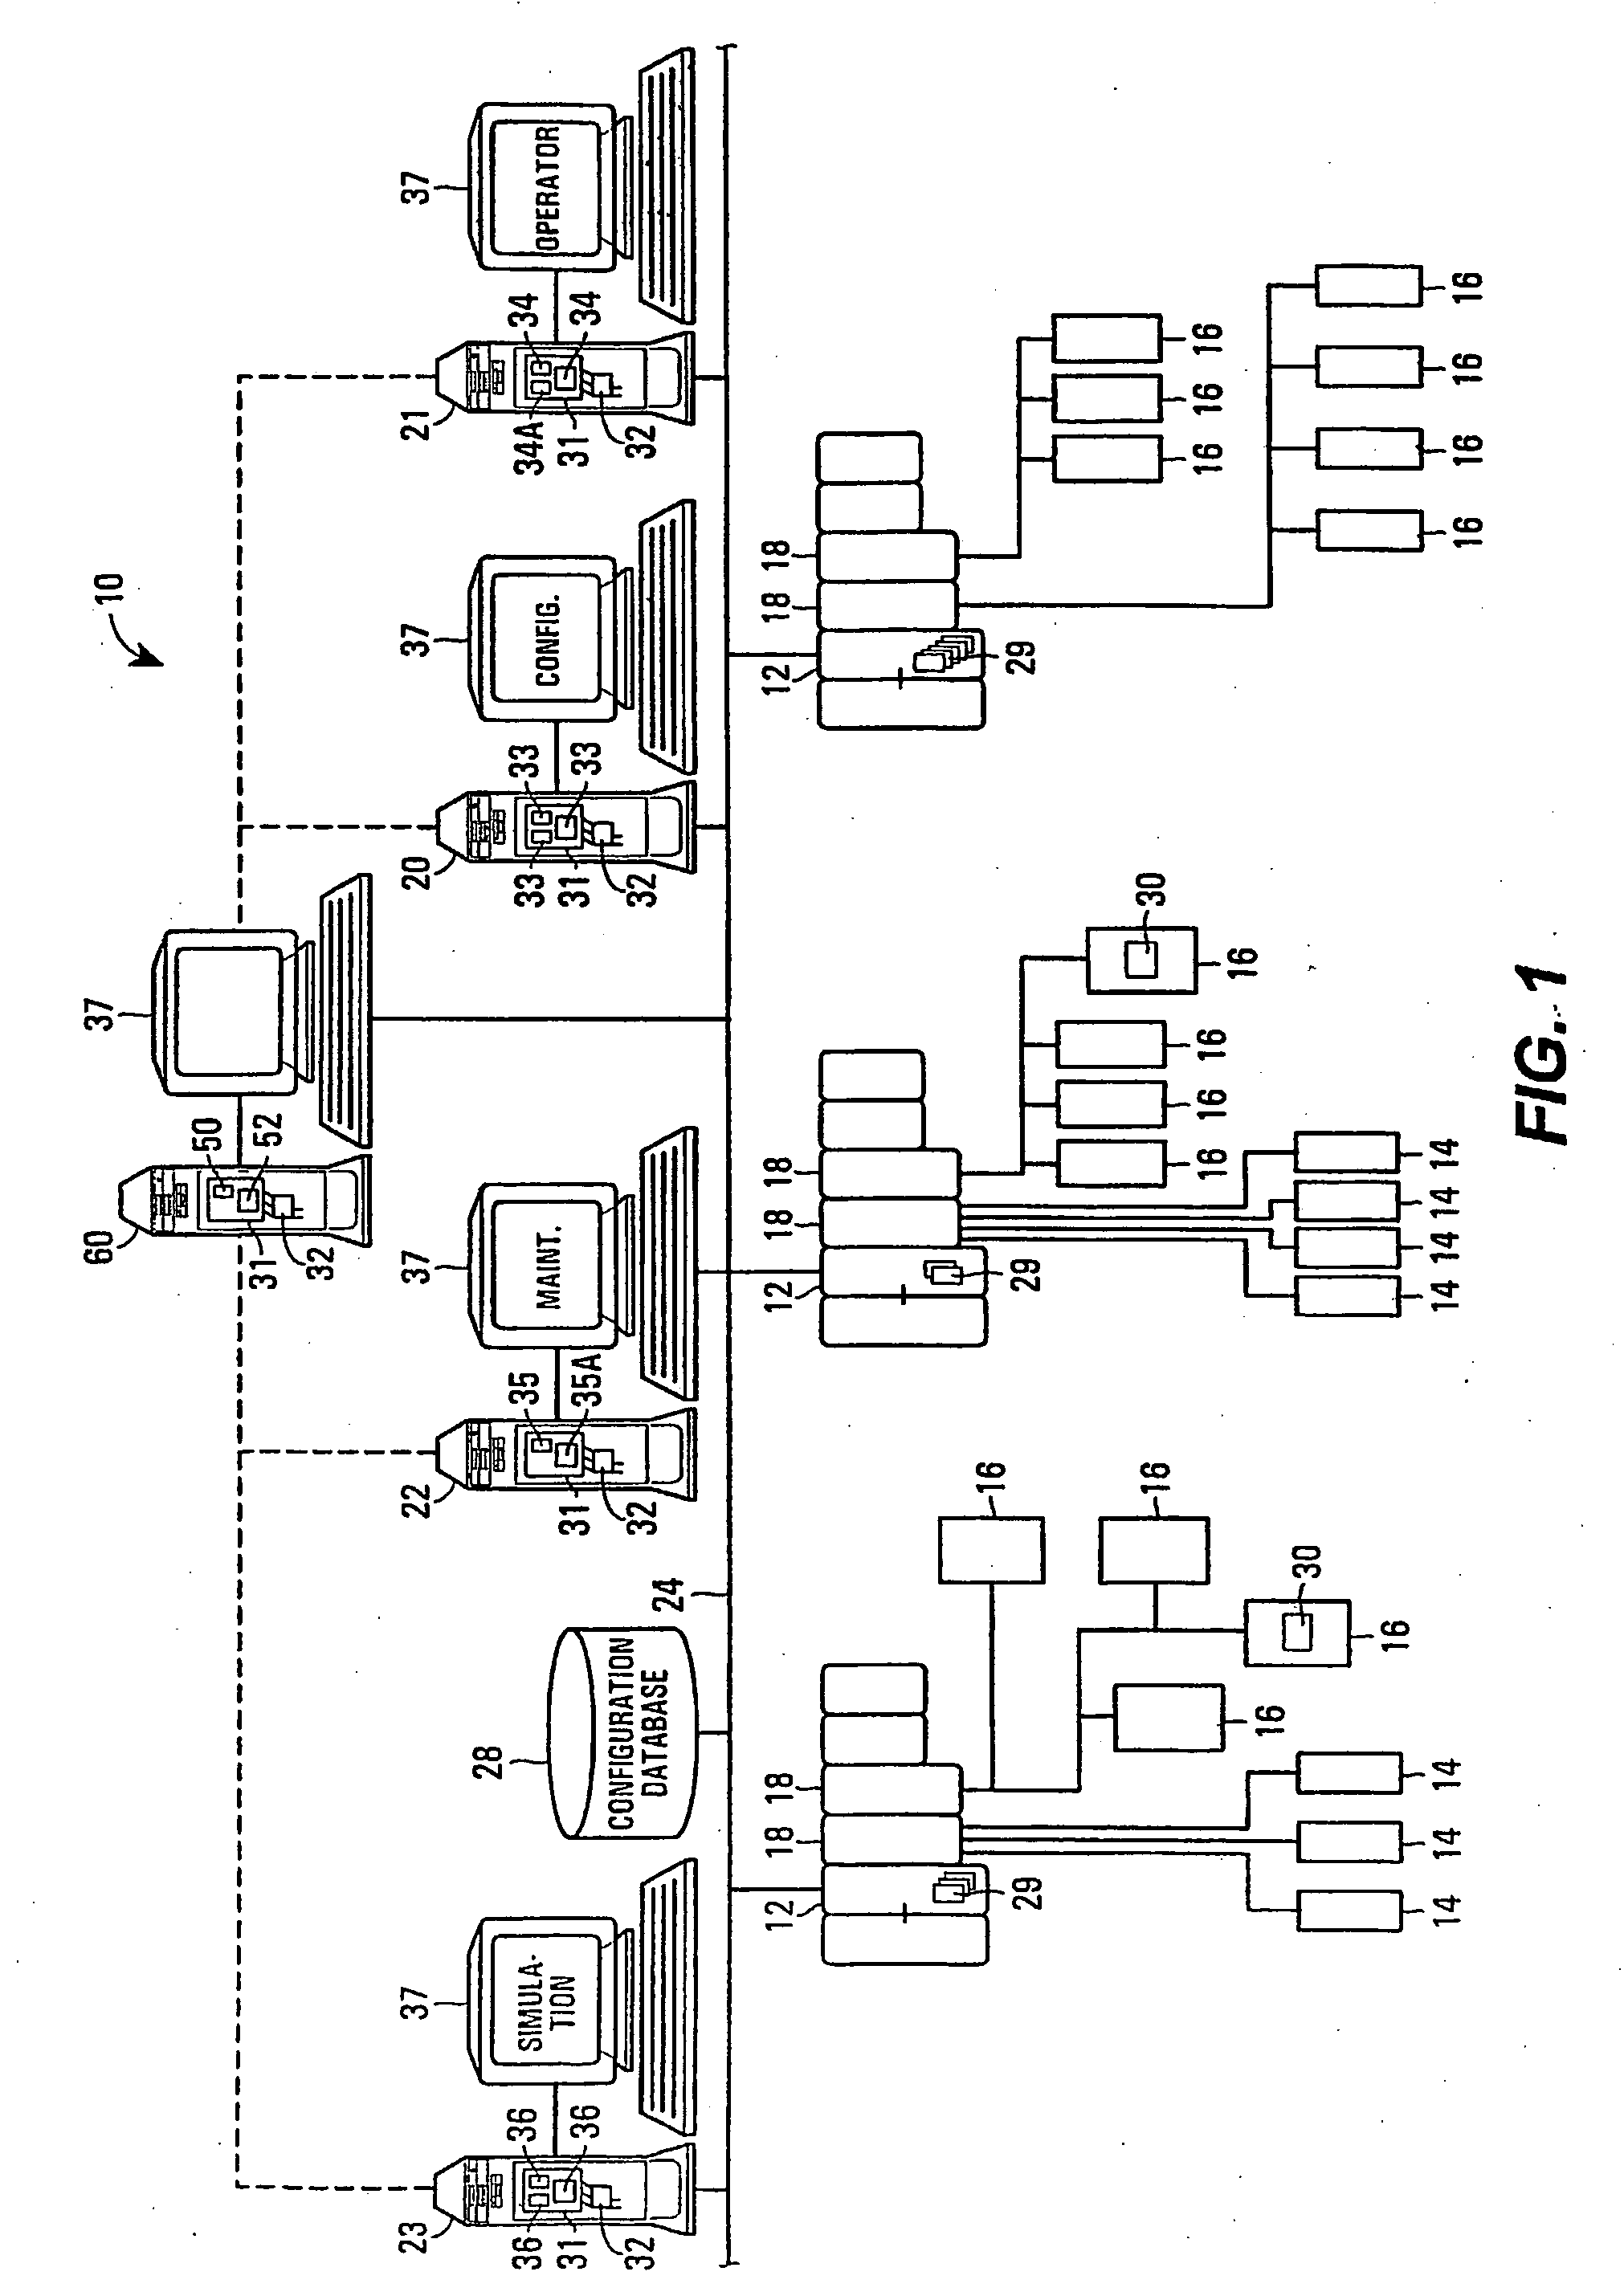
[0041]FIG. 1 illustrates an example process plant 10 in which system level graphical support is provided to various functional areas of the plant 10. As is typical, the process plant 10 includes a distributed process control system having one or more controllers 12, each connected to one or more field devices 14 and 16 via input / output (I / O) devices or cards 18 which may be, for example, Fieldbus interfaces, Profibus interfaces, HART interfaces, standard 4-20 ma interfaces, etc. The controllers 12 are also coupled to one or more host or operator workstations 20-23 via a data highway 24 which may be, for example, an Ethernet link. A database 28 may be connected to the data highway 24 and operates as a data historian to collect and store parameter, status and other data associated with the controllers and field devices within the plant 10 and / or as a configuration database that stores the current configuration of the process control system within the plant 10 as downloaded to and stor...


PUM


Abstract

Smart graphic elements are provided for use as portions or components of one or more graphic displays, which may be executed in a process plant to display information to users about the process plant environment, such as the current state of devices within the process plant. Each of the graphic elements is an executable object that includes a property or a variable that may be bound to an associated process entity, like a field device, and that includes multiple visualizations, each of which may be used to graphically depict the associated process entity on a user interface when the graphic element is executed as part of the graphic display. Any of the graphic element visualizations may be used in any particular graphic display and the same graphic display may use different ones of the visualizations at different times. The different visualizations associated with a graphic element make the graphic element more versatile, at they allow the same graphic element to be used in different displays using different graphical styles or norms. These visualizations also enable the same graphic element to be used in displays designed for different types of display devices, such as display devices having large display screens, standard computer screens and very small display screens, such as PDA and telephone display screens.

Description

RELATED APPLICATIONS [0001] This application is a regular filed application of and claims, for the purposes of priority, the benefit of U.S. Provisional Application Ser. No. 60 / 567,980, entitled “Graphical User Interface for Representing, Monitoring, and Interacting with Process Control Systems,” which was filed on May 4, 2004 and which this application hereby expressly incorporates by reference herein in its entirety. This application is also related to U.S. patent application Ser. No. 10 / 625,481, entitled “Integration of Graphic Display Elements, Process Modules and Control Modules in Process Plants,” which was filed on Jul. 21, 2003, and which published as U.S. Publication No. 2004 / 0153804 on Aug. 5, 2004, which, in turn, is a Continuation-in-Part of U.S. patent application Ser. No. 10 / 278,469, entitled “Smart Process Modules and Objects in Process Plants,” which was filed on Oct. 22, 2002, and which published as U.S. Publication No. 2004 / 0075689 on Apr. 22, 2004, the entire disc...

Claims


Application Information

Patent Timeline
IPC IPC(8): G09G5/00G05B19/042G05B23/02G06F9/44H04L29/08
CPCG05B19/0426G06T13/00G05B23/0267G05B2219/23424G05B2219/25067G05B2219/25428G05B2219/31467G05B2219/31469G05B2219/31472G05B2219/31474G05B2219/32128G05B2219/32342G06F8/20G06F9/4428G06N5/04G06Q10/06G06Q50/04H04L2012/4026H04L67/16H04L67/36H04L67/12H04L67/28H04L67/289Y10S715/965G06F8/38G06F9/4443G05B19/41885Y02P90/30Y02P90/84Y02P80/40Y04S40/18G06F9/4488G06F9/451Y02A10/40Y02P90/02Y02P90/80H04L67/56H04L67/51H04L67/75G06F30/12G06F2113/14G06F2111/12G05B19/042G05B19/0425G05B23/02G06F13/387G05B19/0428G05B19/4185G05B19/02G06F13/00G06F9/44G06F11/32G06F16/00G05B19/418G06F9/00
Inventor GILBERT, STEPHENBEOUGHTER, KEN J.LUCAS, J.MICHAELHAO, TENNYSONNIXON, MARK J.
Owner FISHER-ROSEMOUNT SYST INC
Why Eureka
Try Eureka