Fourier transform infrared (FTIR) chemometric method to determine cetane number of diesel fuels containing fatty acid alkyl ester additives
a technology of fatty acid alkyl ester and chemometric method, which is applied in the direction of fuels, instruments, material analysis, etc., can solve the problems of inability to measure, time-consuming and laborious, and cannot be used for controlling biodiesel production or certification
- Summary
- Abstract
- Description
- Claims
- Application Information
AI Technical Summary
Problems solved by technology
Method used
Image
Examples
example 1
Two Spectral Regions
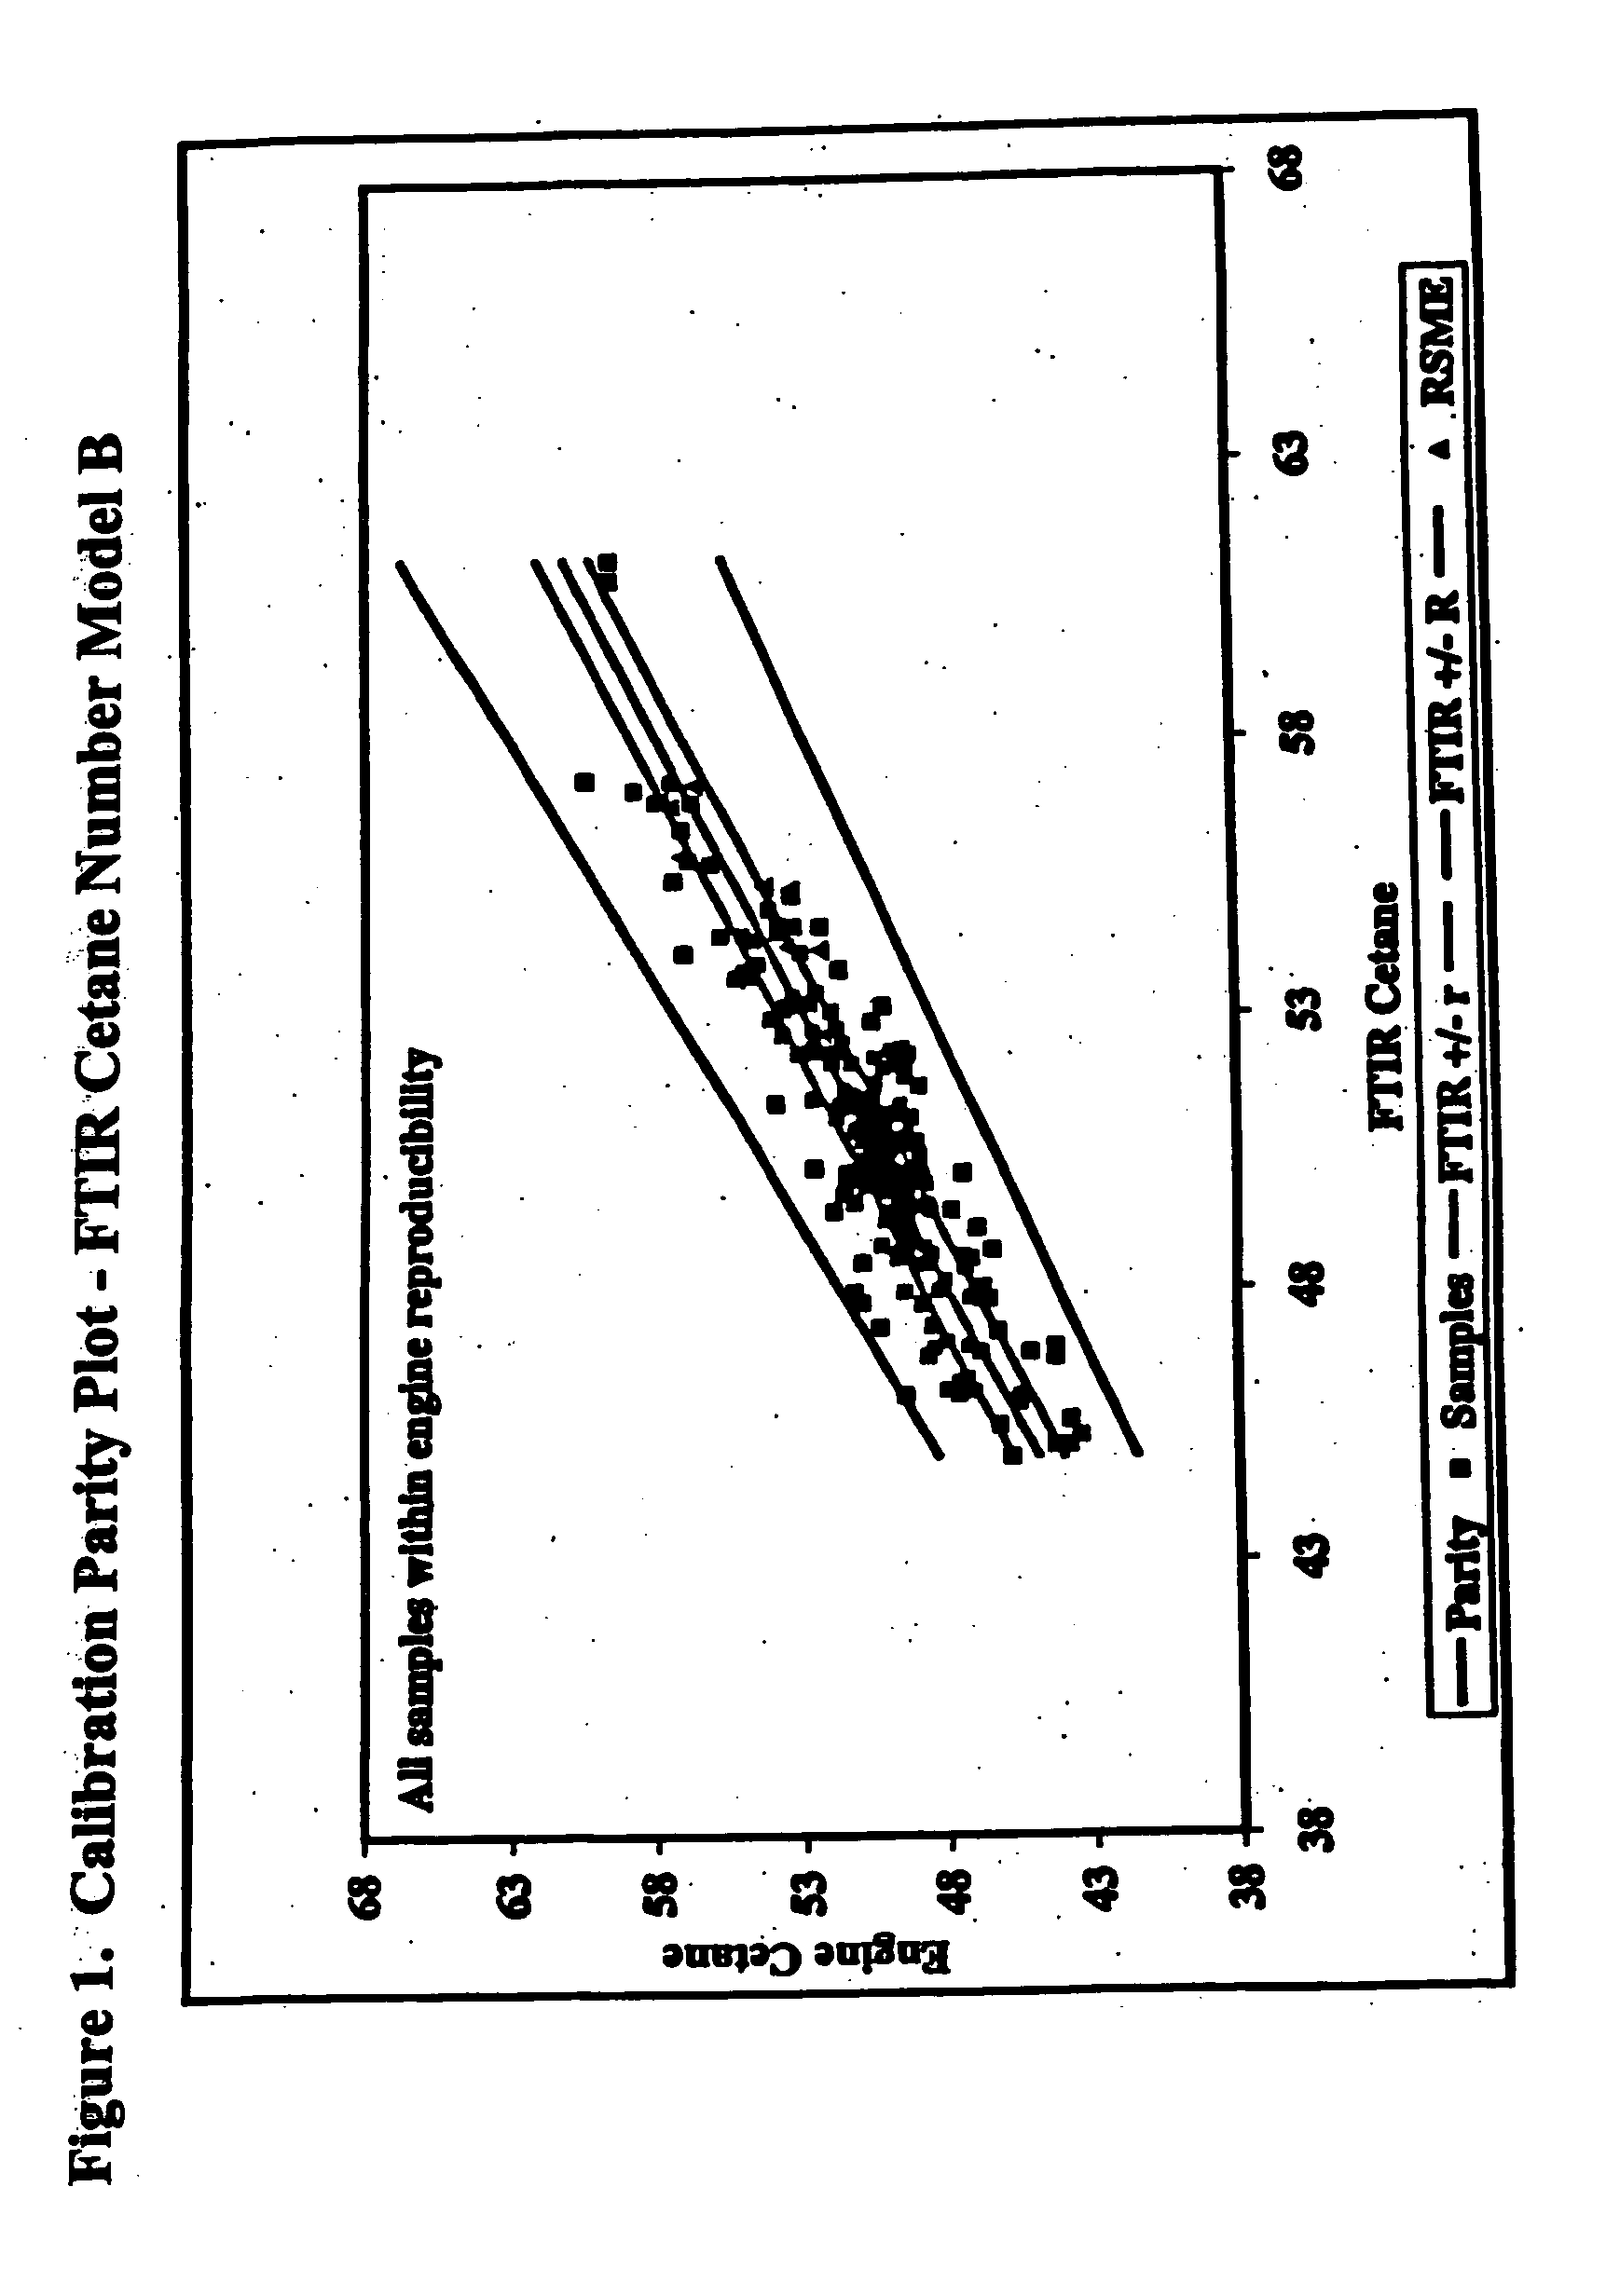
[0013] Two regions from the IR spectrum were used to develop the FTIR linear Model B. The frequency ranges included are, 1) 4900-3500 cm−1, and 2) 2200-1624 cm−1. The latter spectral range includes the frequency of the characteristic ester functional group of RSME (˜1746 cm−1). The calibration results are shown in the parity plot in FIG. 1. As can be seen in FIG. 1, all cetane predictions by FTIR fall within the Reproducibility (R) of the engine. The Standard Error of Calibration (SEC), used as a measure of the difference between cetane values estimated by the model and the values measured by the engine for the samples in the calibration set, was calculated to be 1.5 (Table 1). This value compares well with that of Model A (SEC=1.5). Most importantly, Model B recognizes all of the RSME-containing samples, and, contrary to Model A, samples representing an extrapolation of the model (i.e., spectral outliers) were not detected in the calibration set.
TABLE 1Calib...
example 2
Three Spectral Regions
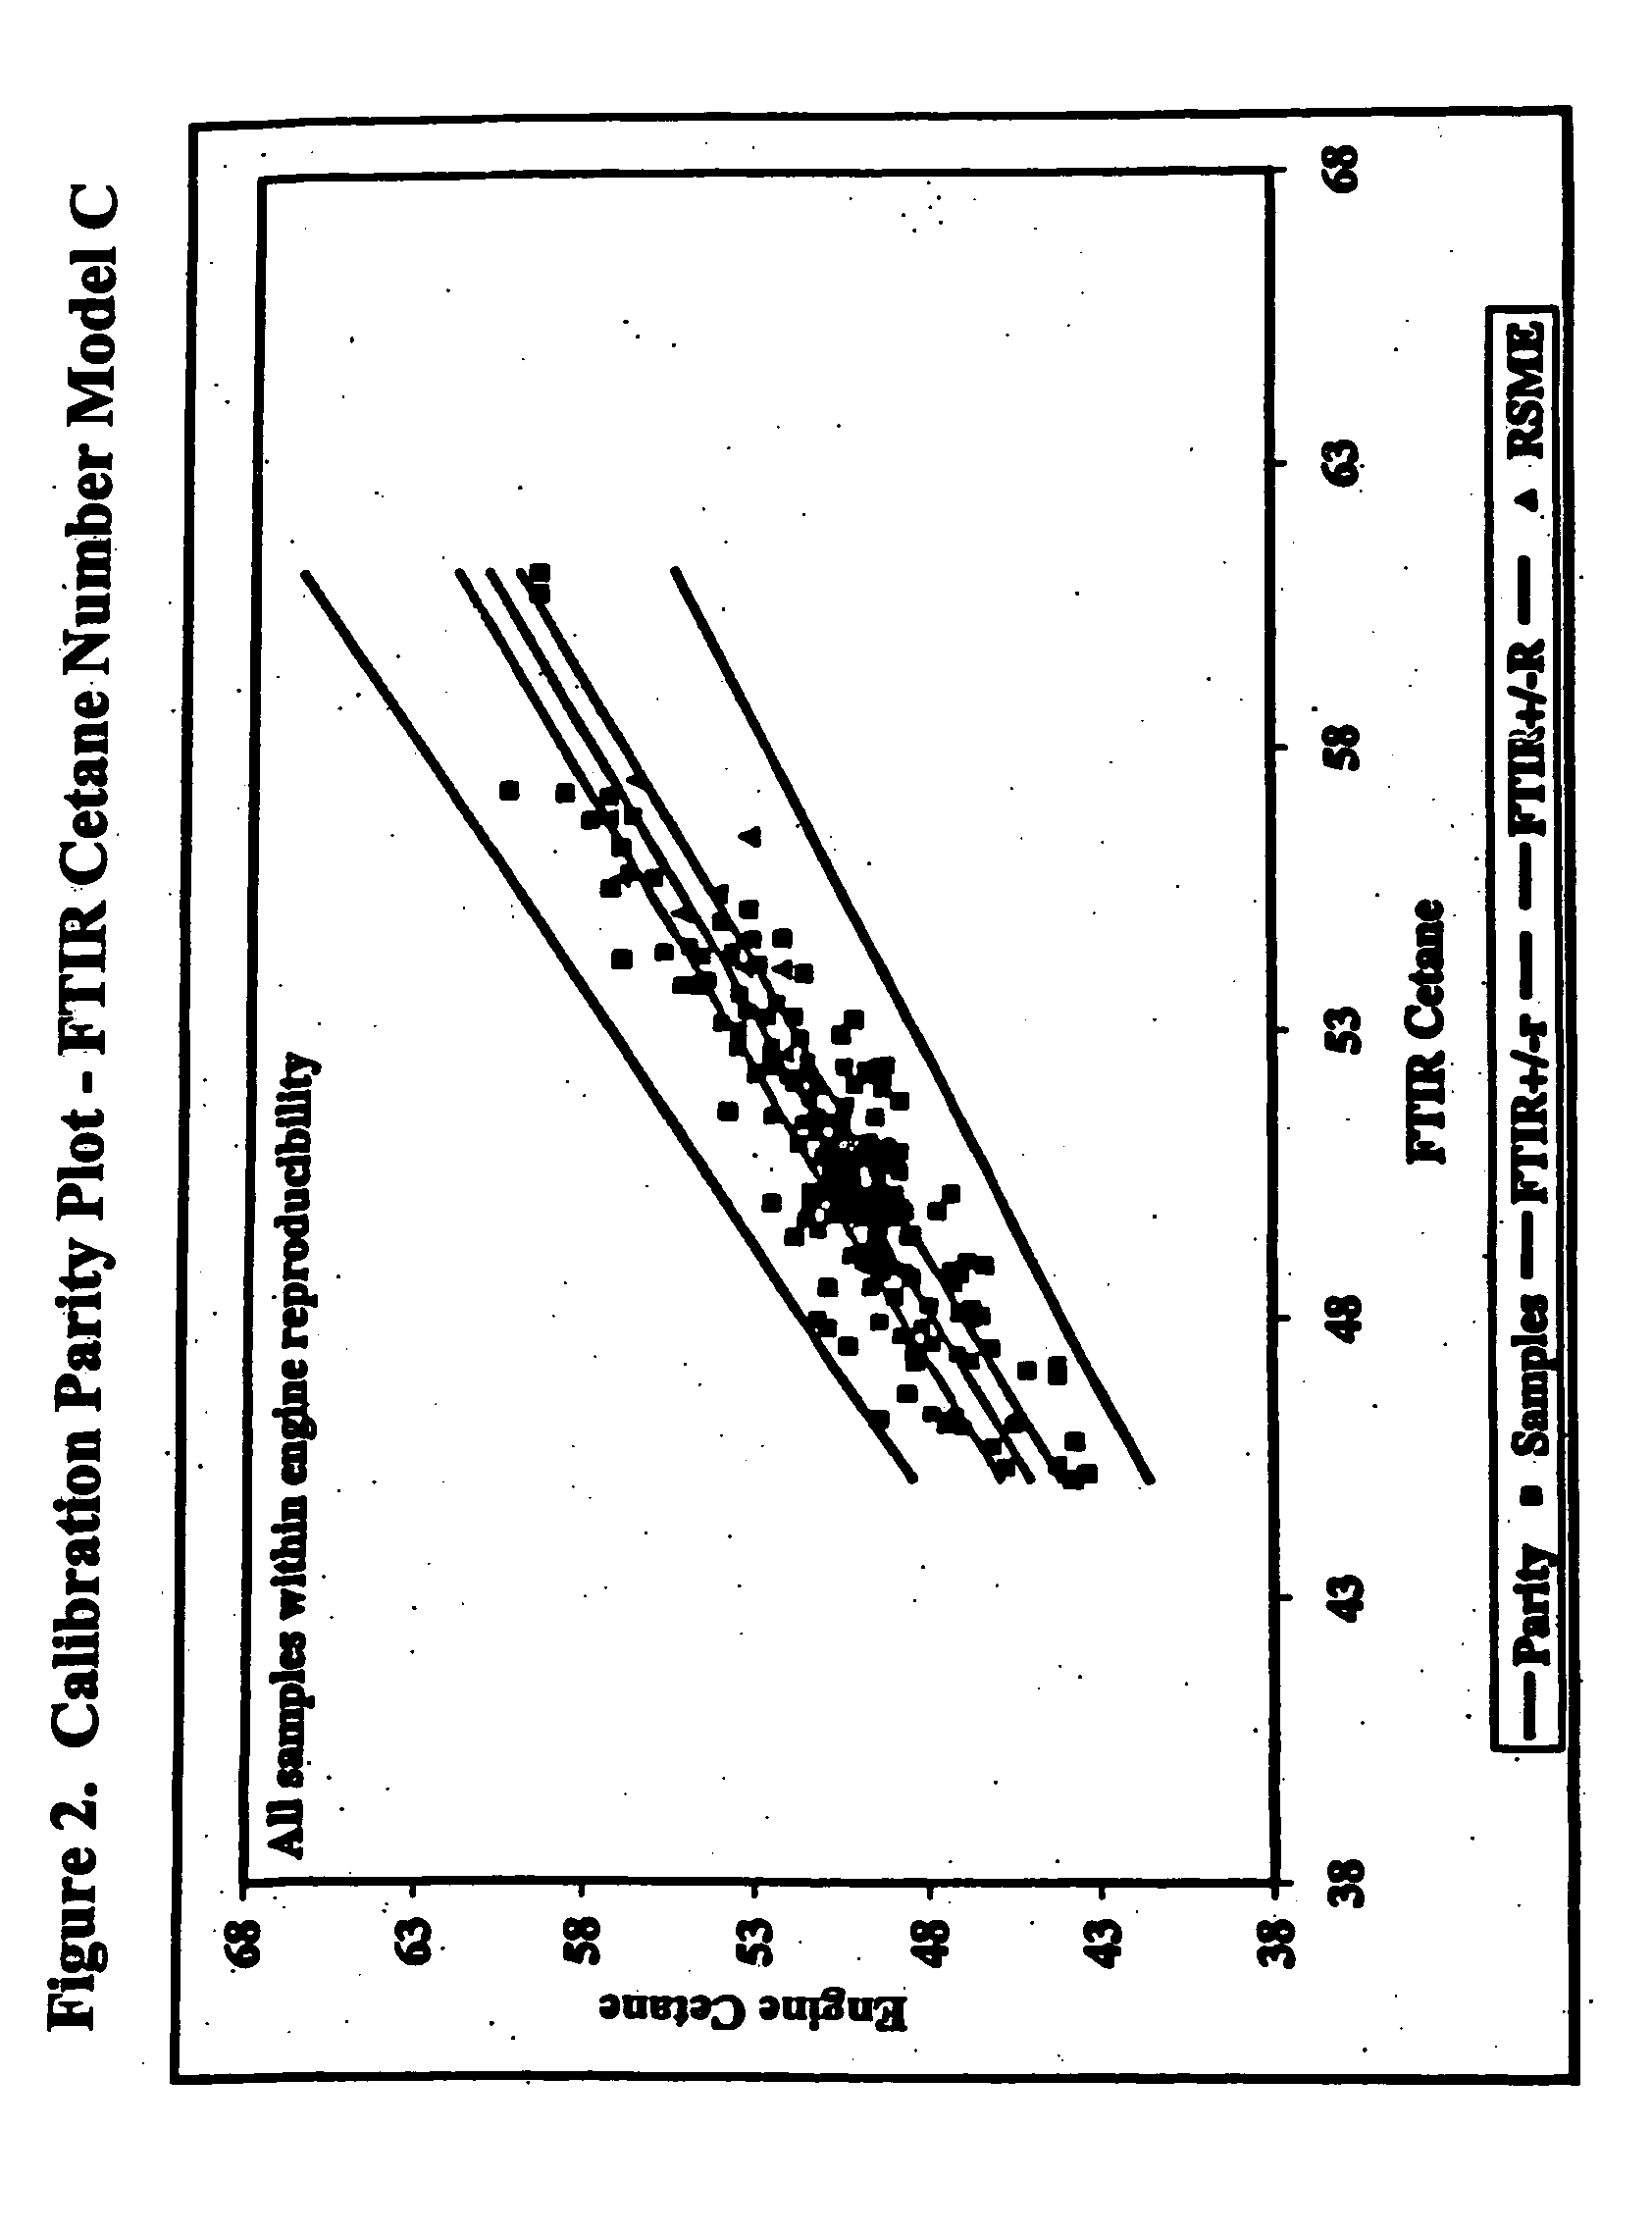
[0014] A different approach was used to develop Model C. The method consists of excluding the spectral region of the ester group of RSME (˜1746 cm−1) when constructing the model. The frequency ranges used are: 1) 4900-3500 cm−1, 2) 2200-1800 cm−1, and 3) 1700-1624 cm−1. This approach is attractive for use in those applications for which the absorbance of the ester group of RSME exceeds the linear range of the spectrometer. As for the previous models, the SEC for Model C was calculated to be 1.5. FIG. 2 shows the calibration parity plot associated with the three spectral regions approach. None of the RSME-containing samples appear a spectral outliers.
Comparison with Current Approach
[0015] Table 2 shows cetane number predictions on randomly selected samples taken from the diesel dataset and analyzed using Model A, and the approaches described herein (i.e., two or three spectral regions). As can be seen, Model A is not capable of predicting cetane number of d...
PUM
| Property | Measurement | Unit |
|---|---|---|
| cetane number | aaaaa | aaaaa |
| infrared spectrum | aaaaa | aaaaa |
| frequency | aaaaa | aaaaa |
Abstract
Description
Claims
Application Information
 - R&D
- Intellectual Property
- Life Sciences
- Materials
- Tech Scout
- Unparalleled Data Quality
- Higher Quality Content
- 60% Fewer Hallucinations
Browse by: Latest US Patents, China's latest patents, Technical Efficacy Thesaurus, Application Domain, Technology Topic, Popular Technical Reports.
© 2025 PatSnap. All rights reserved.Legal|Privacy policy|Modern Slavery Act Transparency Statement|Sitemap|About US| Contact US: help@patsnap.com


