Analysis method and apparatus

a technology of analysis method and apparatus, applied in the field of analysis technique for responses, can solve the problems of difficult introduction of this function, difficult to grasp the influence of the utilization state of the resources of each server on the response of the user, and complicated system to provide the servi

Inactive Publication Date: 2007-09-13
FUJITSU LTD
View PDF9 Cites 47 Cited by
  • Summary
  • Abstract
  • Description
  • Claims
  • Application Information

AI Technical Summary

Benefits of technology

[0007] Therefore, an object of this invention is to provide a technique for carrying out an analysis concerning the response of a computer system by using information that can be easily obtained from the computer system to be analyzed (hereinafter, to be monitored).
[0009] Thus, because the processing is carried out by using data that can be easily obtained such as the CPU utilization ratio and the processing history data, the analysis processing can be carried out while reducing the introduction cost, and without causing any problem on the security.
[0011] In addition, in the aforementioned estimating the average consumed CPU time, the average consumed CPU time per one request for each server may be estimated by carrying out a regression analysis by using the CPU utilization ratio of each server in a predesignated time range and the request frequency. Thus, by limiting to the predesignated time range, it is possible to exclude the time range when the request by the user is not processed so much and to improve the calculation accuracy.
[0012] Furthermore, in the aforementioned estimating the average delay time, a pertinent coefficient value representing a relation between the average consumed CPU time per one request for the server and the average delay time in the server may be read out by referring to a matrix storage storing said coefficient values for each predetermined unit of the CPU utilization ratio, which is an element to determine the coefficient value and for each number of CPUs, and the average delay time in the server may be calculated from the coefficient value and the average consumed CPU time per one request for the server. Because the coefficient value is a function of the CPU utilization ratio and the number of CPUs, the coefficient value can be calculated each time. However, because the calculation amount is actually increased, the coefficient values may be stored in the aforementioned matrix storage in order to enhance the processing speed.
[0020] This invention may further include: when the number of servers is changed, calculating an average consumed CPU time per one request for each server according to the changed number of servers, and storing the calculated average consumed CPU time into the storage device; calculating a CPU utilization ratio for each server after the change by using the number of CPUs and the average consumed CPU time per one request for each server after the change, which is stored in the storage device, and storing the calculated CPU utilization ratio into the storage device; and estimating an average delay time for each server after the change by using the average consumed CPU time per one request for each server after the change, which is stored in the storage device, and the CPU utilization ratio for each server after the change, and storing the estimated average delay time into the storage device. When the number of servers is increased, for example, it is possible to try how much the delay time is decreased, and the reasonability of the investment can be judged from the effect.

Problems solved by technology

Along with development of a network service, a system to provide the service becomes complicated and large-scale.
In such a system, it becomes very difficult to grasp how the utilization state of the resources of each server influences the response to the user.
However, the method (1) has to change the existing system and the service, and the introduction of this function is not easy.
In addition, the method (2) requires an expensive equipment and a storage having a large capacity for the packet capture.
Furthermore, in view of the security, the packet capture is not preferable.
However, this technique needs the “experiment”, and the analysis cannot be carried out while carrying out a regular processing.

Method used


Image

  • Analysis method and apparatus
  • Analysis method and apparatus
  • Analysis method and apparatus

Examples


Embodiment Construction

[Principle of this Invention]

A. Derivation of a Theoretical Value Xˆ (a Symbol That ˆ is Attached on the Top of X is Also Indicated as “Xˆ”) of an Average Delay Time in a Web System Model

A-1. Modeling of the Delay Time of a Single Server

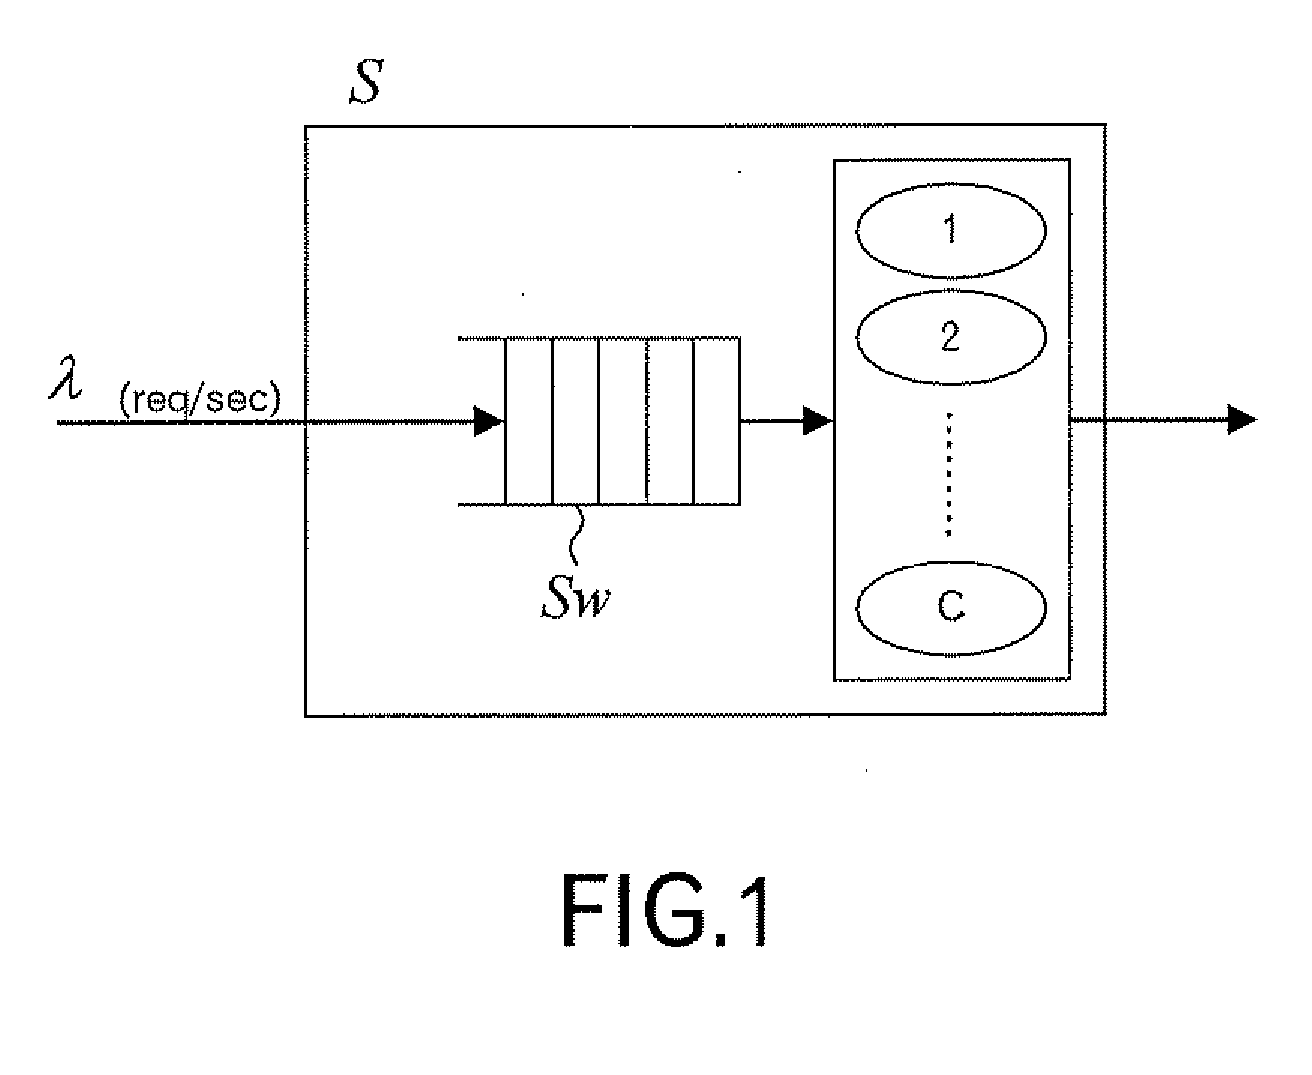
[0041] First, by using FIG. 1, it is considered that the average delay time in the single server S having plural CPUs is derived. The server S shown in FIG. 1 has C CPUs from CPU_1 to CPU_C, and requests input from the outside at the request frequency λ (req / sec) are input into a queue Sw and then processed by C CPUs. At this time, the utilization ratio of the CPU is represented as ρ(%). Then, from an analysis result of the M / M / s queue mode, an average stay time T (C, λ, ρ) is as follows: T⁡(C,λ,ρ)=F⁡(C,λ,ρ)⁢ ⁢G⁡(C,ρ)(1)F⁡(C,λ,ρ)=C⁢ ⁢ρλ(2)G⁡(C,ρ)=(C⁡(1-ρCC⁢ρC⁢C!⁢ ⁢∑r=0C-1⁢Cr⁢ρri!+1)⁢(1-ρ))-1+1(3)

[0042] From the expressions (1) to (3), the average stay time T(C, λ, ρ) in the server S satisfies the following relation. Incidentally, α represents a...


PUM


Abstract

An analysis method for carrying out an analysis for responses of a computer system including a plurality of servers, includes: obtaining data concerning a CPU utilization ratio of each of the plurality of servers from the computer system, and storing the data concerning the CPU utilization ratio into a CPU utilization ratio storage; obtaining processing history data generated in the computer system, generating data of a request frequency by users of the computer system, and storing the processing history data into a request frequency data storage; and estimating an average delay time in each server by using the CPU utilization ratio of each server, which is stored in the CPU utilization ratio storage, and the request frequency stored in the request frequency data storage, and storing the estimated average delay time into a server delay time storage. By carrying out such a processing, the analysis can be carried out without changing the computer system to be analyzed and any additional cost.

Description

CROSS-REFERENCE TO RELATED APPLICATIONS [0001] This application is a continuing application, filed under 35 U.S.C. section 111(a), of International Application PCT / JP2004 / 016051, filed Oct. 28, 2004.TECHNICAL FIELD OF THE INVENTION [0002] This invention relates to an analysis technique for responses in a computer system. BACKGROUND OF THE INVENTION [0003] Along with development of a network service, a system to provide the service becomes complicated and large-scale. A lot of services have come to be provided by combining many servers. In such a system, it becomes very difficult to grasp how the utilization state of the resources of each server influences the response to the user. [0004] Conventionally, following two methods are known in order to investigate what ratio the delay in each server of a system having plural servers occupies for a response time the user feels. Namely, (1) a special identification tag is attached to messages transmitted and received between servers, and th...

Claims


Application Information

Patent Timeline
Patent Type & Authority Applications(United States)
IPC IPC(8): G06F15/173
CPCG06F11/3419G06F11/3423H04L43/0852G06F2201/86H04L43/0817G06F11/3447
Inventor KIKUCHI, SHINJIYOKOYAMA, KENTAKEYAMA, AKIRASHIMAZAKI, KENICHIMAEDA, TAKAMITSUISHIBASHI, KOJISHINDO, SEIYATSURO, KOUTAROU
Owner FUJITSU LTD
Why Eureka
Try Eureka