Mouse MRI for drug screening

a technology of mouse mri and drug screening, which is applied in the field of mouse mri for drug screening, can solve the problems of insufficient spatial resolution, change in cerebral blood flow and volume, and inability to use mice with adequate spatial resolution

Inactive Publication Date: 2007-11-15
SMALL SCOTT +1
View PDF13 Cites 7 Cited by
  • Summary
  • Abstract
  • Description
  • Claims
  • Application Information

AI Technical Summary

Problems solved by technology

Visualizing ATP production directly is challenging, but imaging techniques have been developed that can visualize correlates of oxygen and glucose consumption caused by the coupling between energy demand and supply which leads to changes in cerebral blood flow and volume when the local energy metabolism changes.
These techniques work well in humans and larger primates but do not have an adequate spatial resolution to use in mice.
These approaches have a number of limitations for mapping CBV longitudinally over time.
Typically, a cut-down surgical procedure is used to access a large vein, a traumatic procedure associated with frequent morbidity and occasional mortality.
Alternatively one of the two tail veins can be used, but these veins cannot be probed multiple times. A second limitation is the use of iron-containing contrast agents, which may lead to organ toxicity when used at high-doses or repeatedly (15), limiting the number of times a CBV map can be generated over time, which is required for mapping the spatiotemporal pattern of disease onset and progression.

Method used


Image

  • Mouse MRI for drug screening
  • Mouse MRI for drug screening
  • Mouse MRI for drug screening

Examples


experiment # 1

Experiment #1

Optimizing CBV Maps Generated with IP Gadodiamide

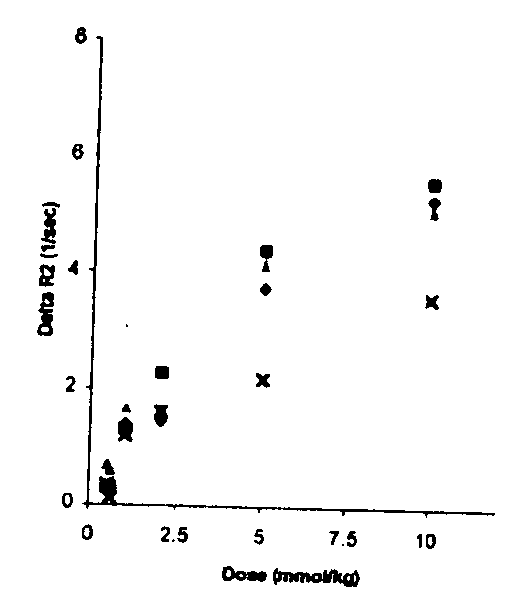
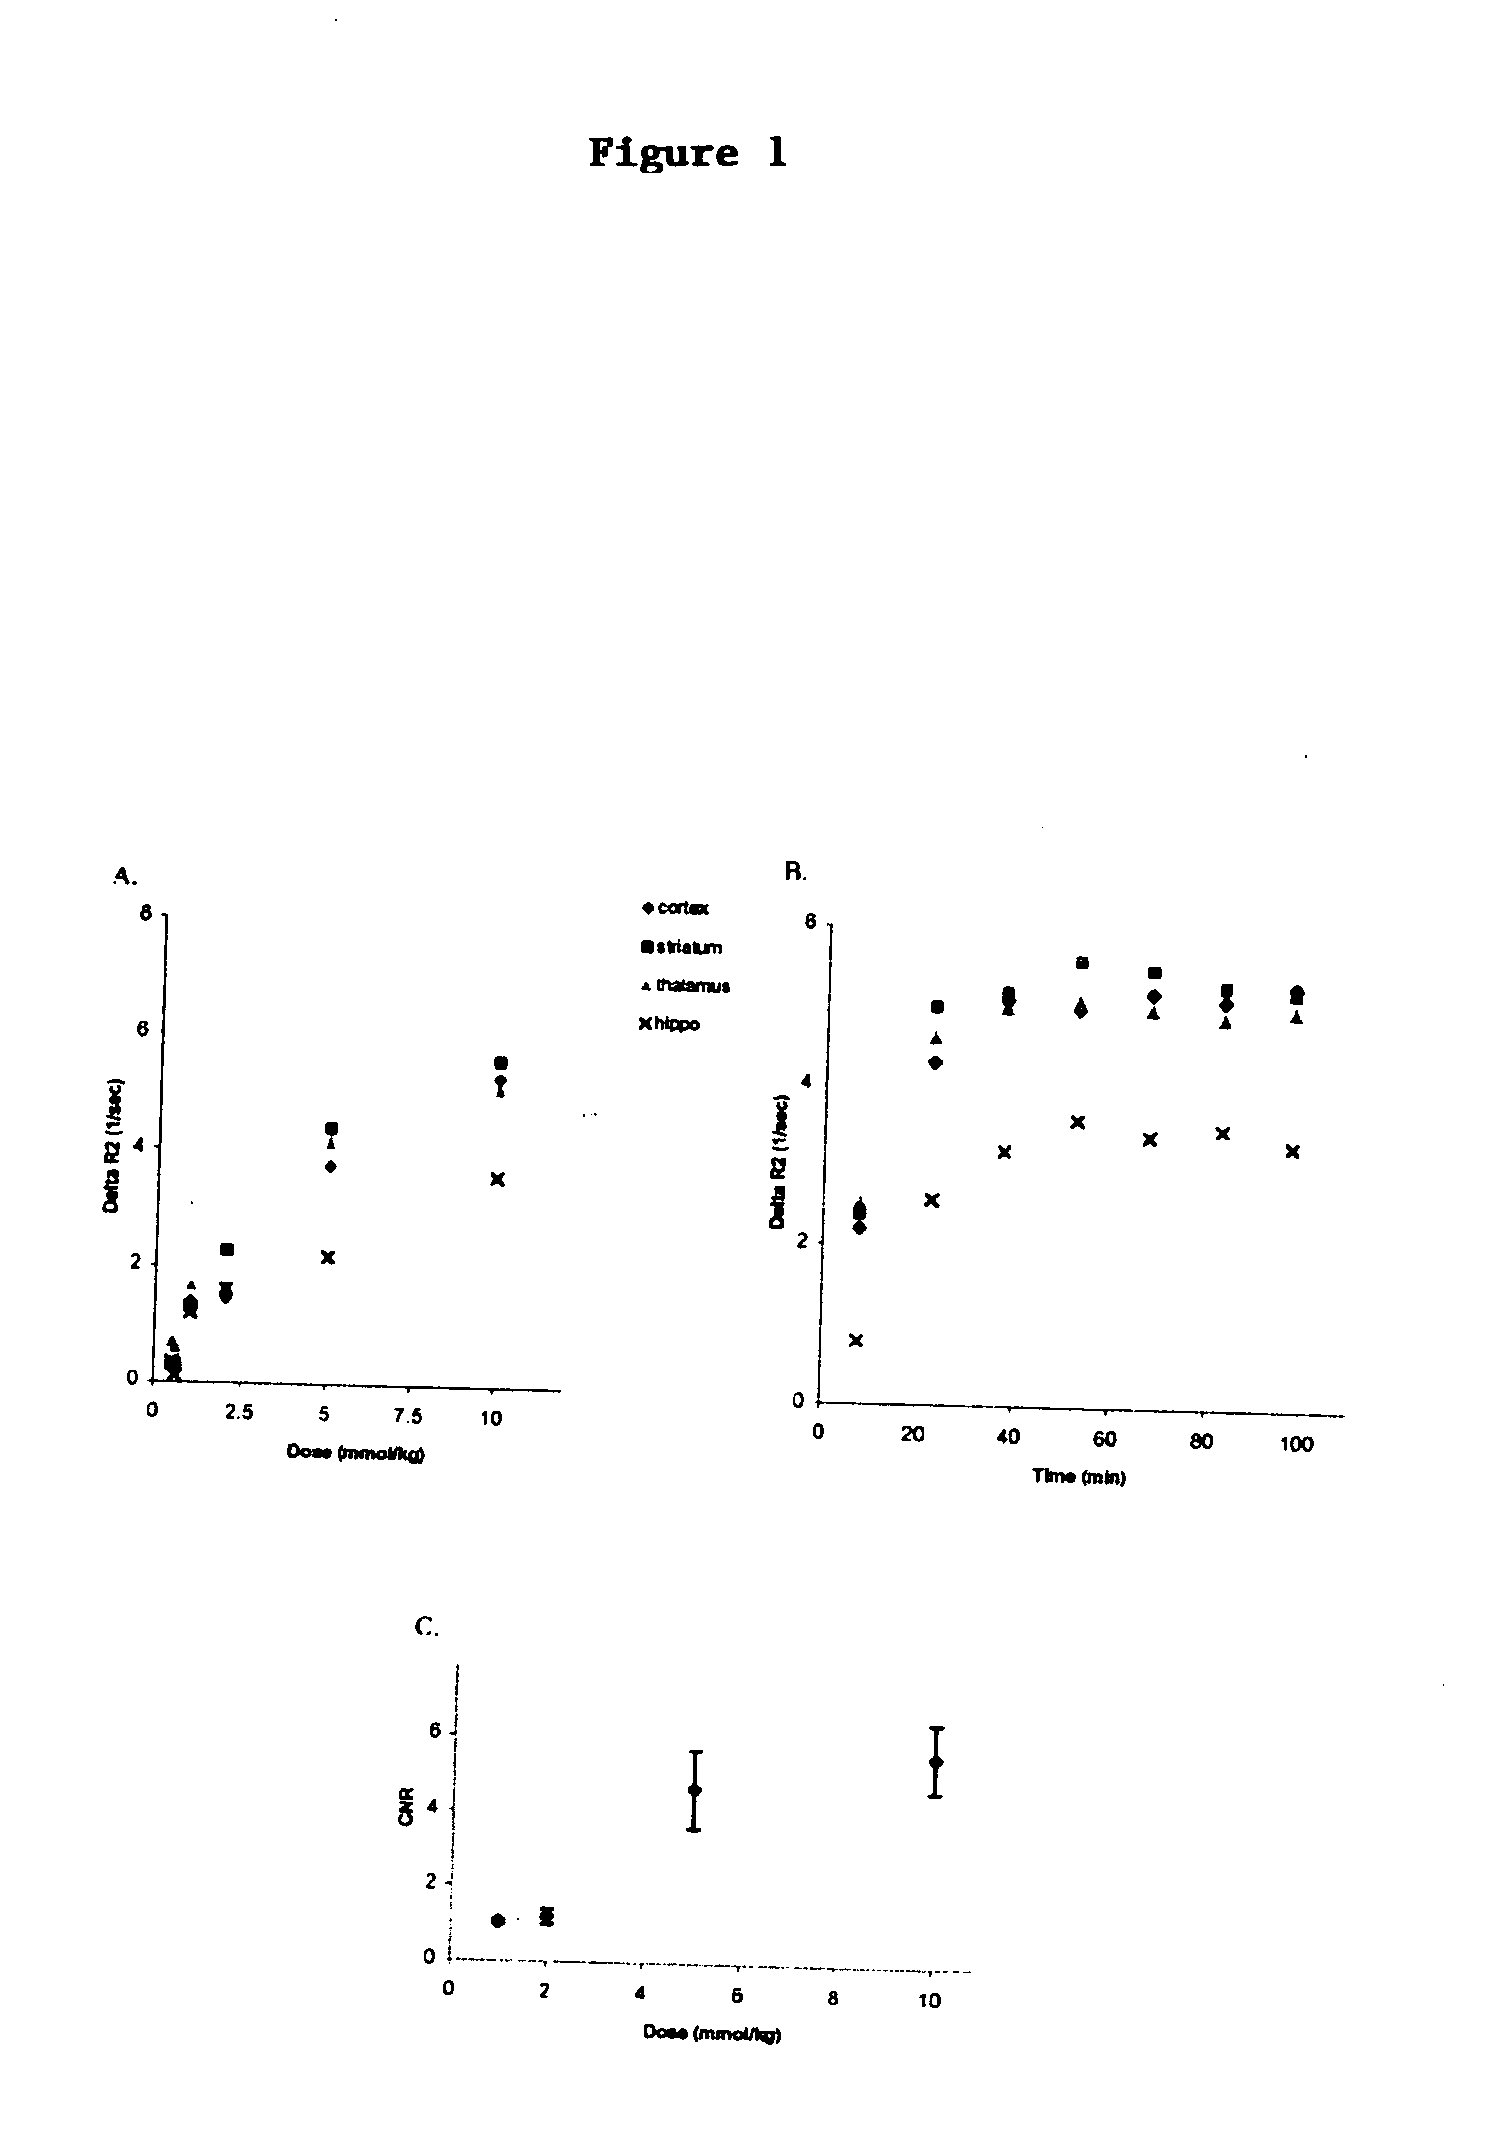
[0083] As expected, higher doses of GD resulted in an increase in AR2 and in CNR (FIGS. 1 A&C). However, a 15 mmol / kg dose caused toxicity, manifested as significant changes in vitals signs in two mice (low SaO2 and RR 72 / 100 and 65 / 110 respectively), therefore the procedure was aborted. Thus, 10 mmol / kg was identified as the optimum dose of GD, and this dose was used for all further experiment unless otherwise indicated. A time course analysis, where the time interval of post-contrast image was systematically varied, showed that the AR2 peaked at approximately 37.5 to 53 minutes post-contrast (FIG. 1B). Since the goal is to keep scan time as short as possible, in order to minimize morbidity and mortality, a 45 minutes time point was identified as the optimum post-contrast time interval.

[0084] As predicted (3, 12), AR2* generated with GE pulse sequences were more sensitive to large vessels compared to AR2 maps generated...

experiment # 2

Experiment #2

Comparing CBV Maps Generated with IV and IP Contrast Agents

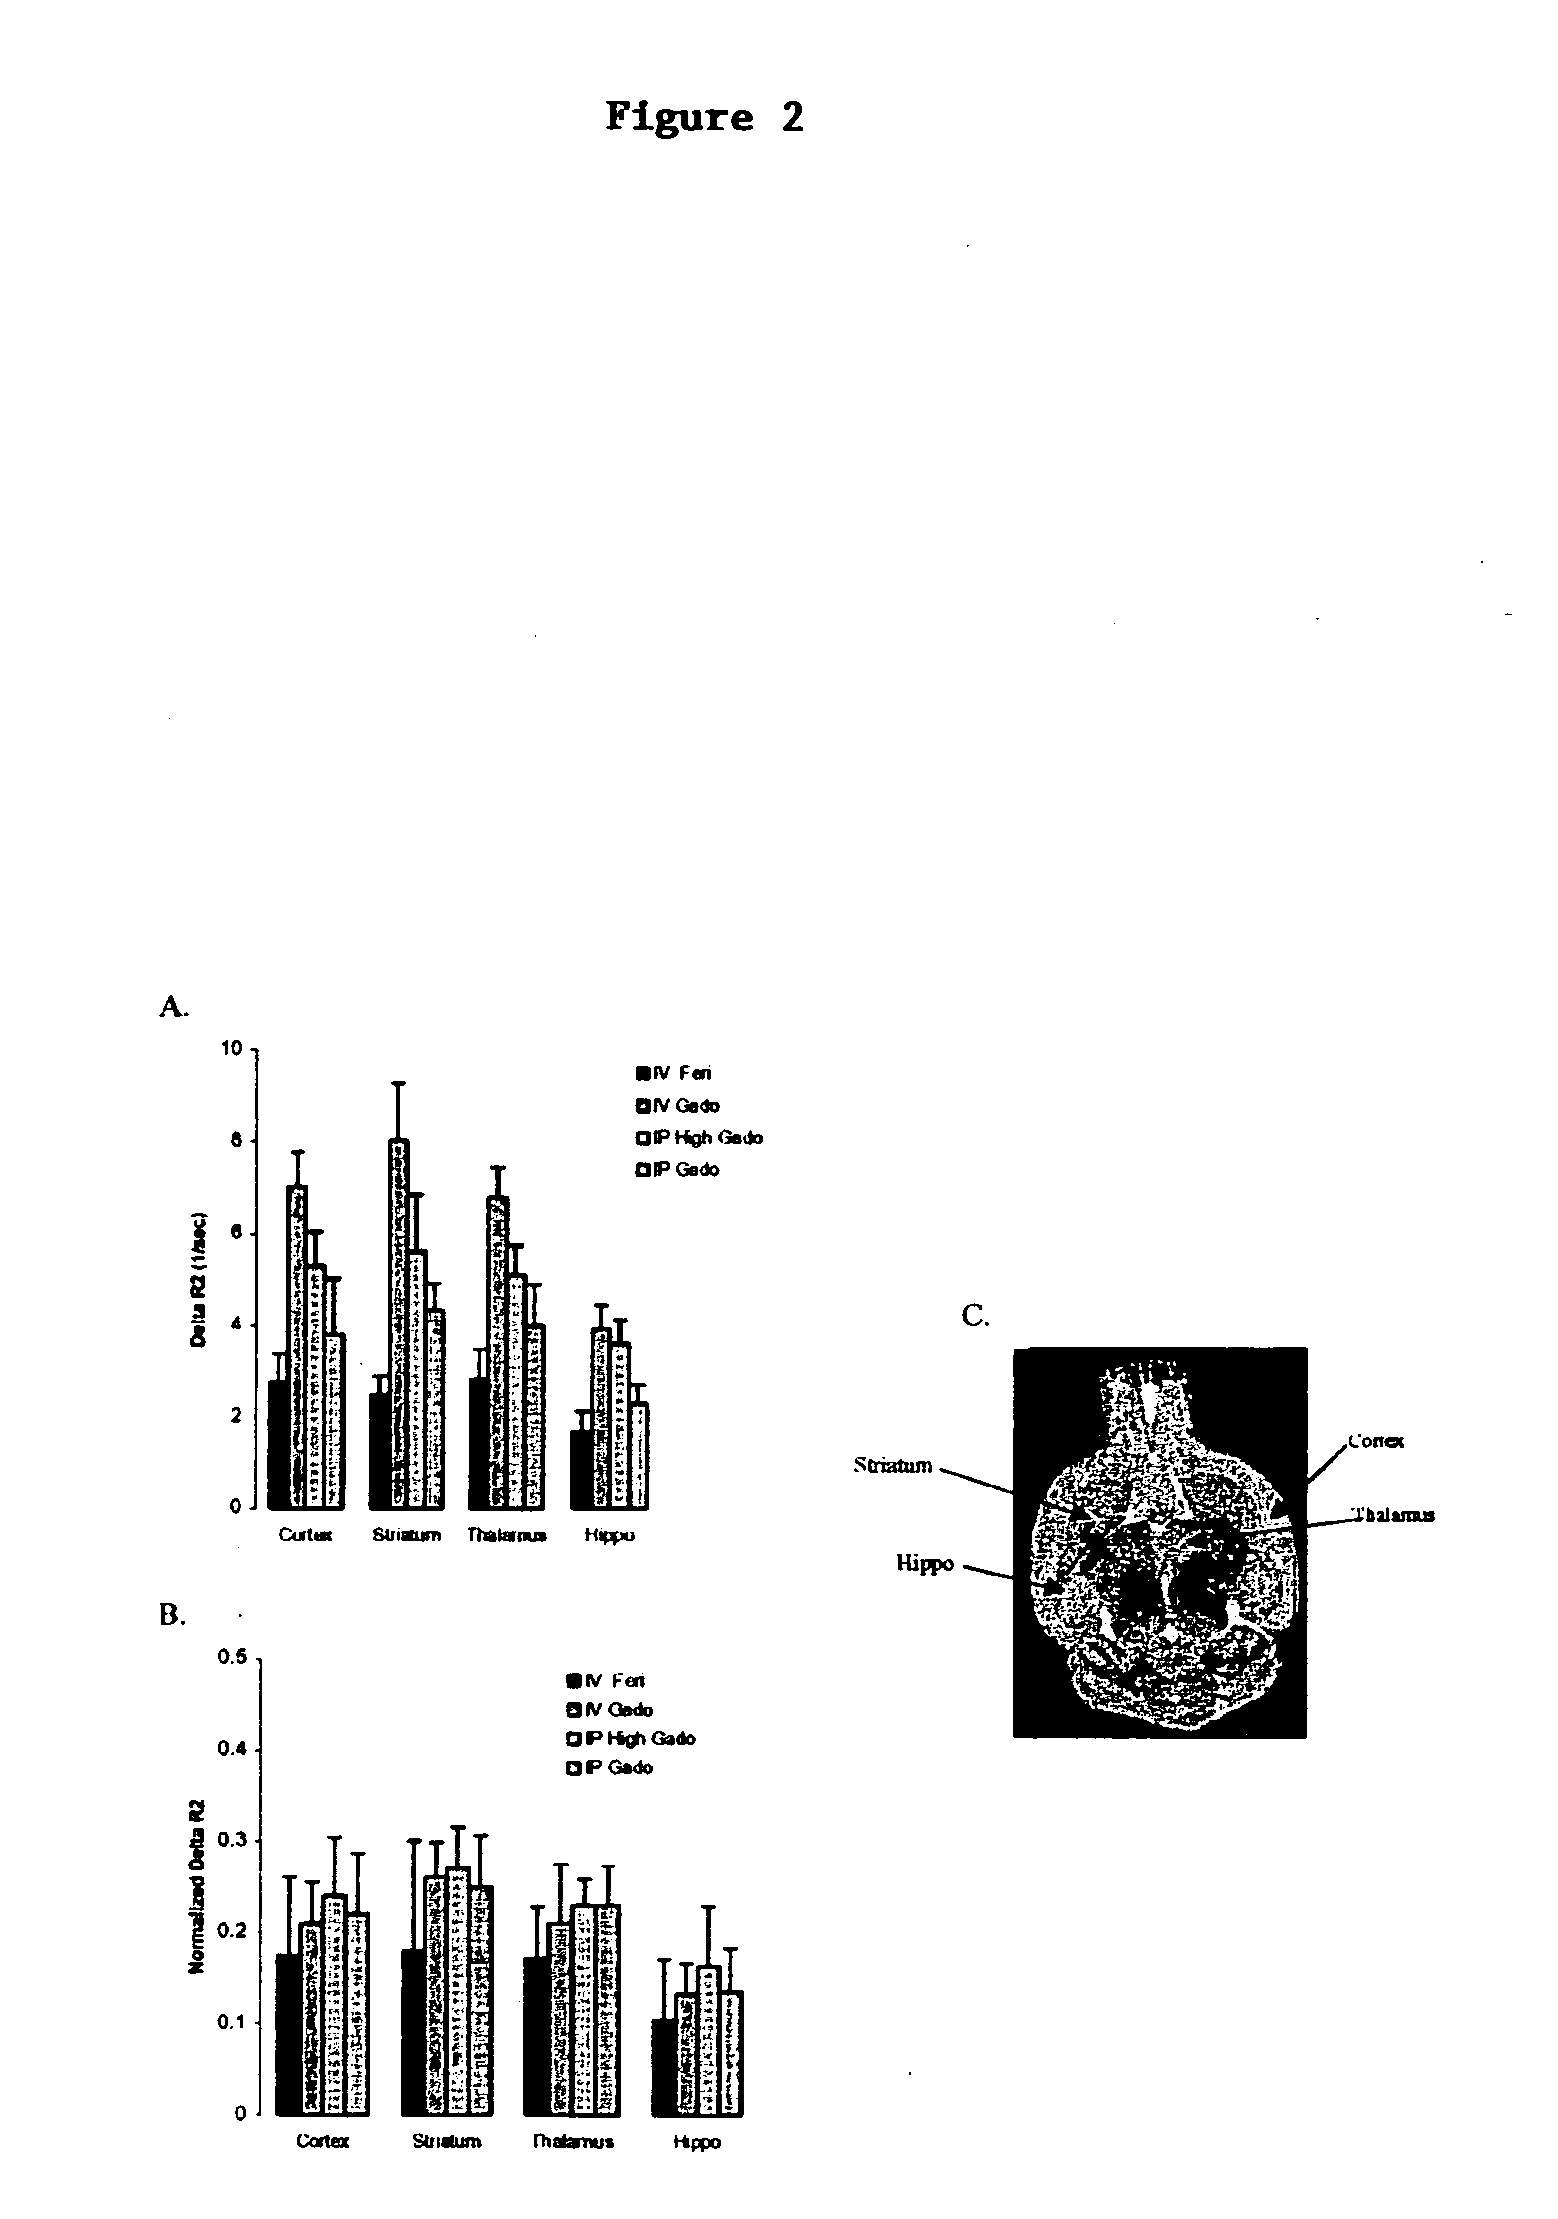
[0086] No significant differences (ANOVA: p values>0.05) were observed between the different methods when peak AR2 values were normalized as described above (FIG. 2B). IV feridex and GD peaked at first acquisition time, while IP doses peaked at an acquisition time equivalent to 37.5 minutes. AR2 values obtained with IP GD at 10 mmol / kg provides a similar value as those obtained with 18 mg Fe / kg of intravenous MION (12), while IV feridex produced half of that signal (FIG. 2A).

experiment # 3

Experiment #3

Optimizing Serial Acquisitions of CBV Maps Generated with IP Gadolinium

[0087] Low CNR (1.62+ / −0.59) was observed in the next imaging session when no flush was administered at the end of an imaging session, with a significant statistical difference when compared to the 2 ml or 4 ml flush group (F=30.0 p=0.0001). Using of 2 ml, 4 or 5 ml flush resulted in high and reliable CNR across the three imaging session, no statistical significant differences were observed between these three groups (F=−1.01 p=0.34). FIG. 4 shows three AR2 maps from the same mouse during three different imaging sessions using the same protocol each time, with a one-week interval between images. The values of the AR2 are very similar (mean AR2 whole brain=5.1, 4.9 and 5.3 respectively).

Discussion

[0088] As illustrated in this study, a number of factors need to be considered when using MRI to generate CBV maps in mice. All methods require the use of an intravascular contrast agent, and the choice o...


PUM


Abstract

This invention provides a method for determining the amount of blood in a volume of cerebral tissue (cerebral blood volume) in a mammalian subject comprising (a) acquiring a first magnetic resonance image of the volume of tissue in vivo; (b) administering intraperitoneally to the subject a gadolinium-containing contrast agent in an amount greater than about 1 mg per kg body weight and less than about 20 mg per kg body weight; (c) acquiring a second magnetic resonance image of the volume of tissue in vivo, which second image is acquired at least about 15 minutes after, but not more than about 2 hours after, administering the contrast agent; and (d) determining the amount of cerebral blood volume based on the first and second images.

Description

[0001] This application claims the benefit of U.S. Provisional Application No. 60 / 736,630, filed Nov. 14, 2005, the contents of which are incorporated herein by reference into the subject application.[0002] This invention was made with support under United States Government Grant Nos. AG07232, AG08702, and NS43469 from the National Institutes of Health. Accordingly, the United States Government has certain rights in the subject invention.[0003] Throughout this application, certain publications are referenced. Full citations for these publications, as well as additional related references, may be found immediately preceding the claims. The disclosures of these publications are hereby incorporated by reference into this application in order to more fully describe the state of the art as of the date of the invention described and claimed herein. BACKGROUND OF THE INVENTION [0004] Since the early studies performed by Kety and Schmidt (1) measurements to detect changes in regional energy...

Claims


Application Information

Patent Timeline
Patent Type & Authority Applications(United States)
IPC IPC(8): A61B5/055
CPCA61B5/055
Inventor SMALL, SCOTTMORENO, HERMAN
Owner SMALL SCOTT
Why Eureka
Try Eureka