Methods and apparatus for identifying workflow graphs using an iterative analysis of empirical data

a workflow and empirical data technology, applied in forecasting, data processing applications, multi-programming arrangements, etc., can solve the problems of a manual workflow development and a formidable task of human observation, and achieve the effect of improving the understanding of the process used and facilitating the optimization of those processes

Inactive Publication Date: 2008-03-13
JUSTSYST EVANS RES
View PDF8 Cites 33 Cited by
  • Summary
  • Abstract
  • Description
  • Claims
  • Application Information

AI Technical Summary

Benefits of technology

[0008]The present disclosure describes systems and methods that can automatically generate a workflow and an associated workflow graph from empirical data of a process using an iterative approach that is straightforward to implement and that executes efficiently. The systems and methods described herein are useful for, among other things, providing workflow graphs to improve the understanding of processes used in business, manufacturing, testing, etc. Improved understanding of such processes can facilitate optimization of those processes. For example, by discovering a workflow model for a given process as disclosed herein, the tasks of the process can be adjusted (e.g., orders and / or dependencies of tasks can be changed), and the impact of such adjustments can be evaluated, e.g., in test scenarios or using simulation data.

Problems solved by technology

However, businesses often carry out their activities without the benefit of a formal workflow to model their processes.
However, development of a workflow by hand based on human observations can be a formidable task.

Method used


Image

  • Methods and apparatus for identifying workflow graphs using an iterative analysis of empirical data
  • Methods and apparatus for identifying workflow graphs using an iterative analysis of empirical data
  • Methods and apparatus for identifying workflow graphs using an iterative analysis of empirical data

Examples


example 1

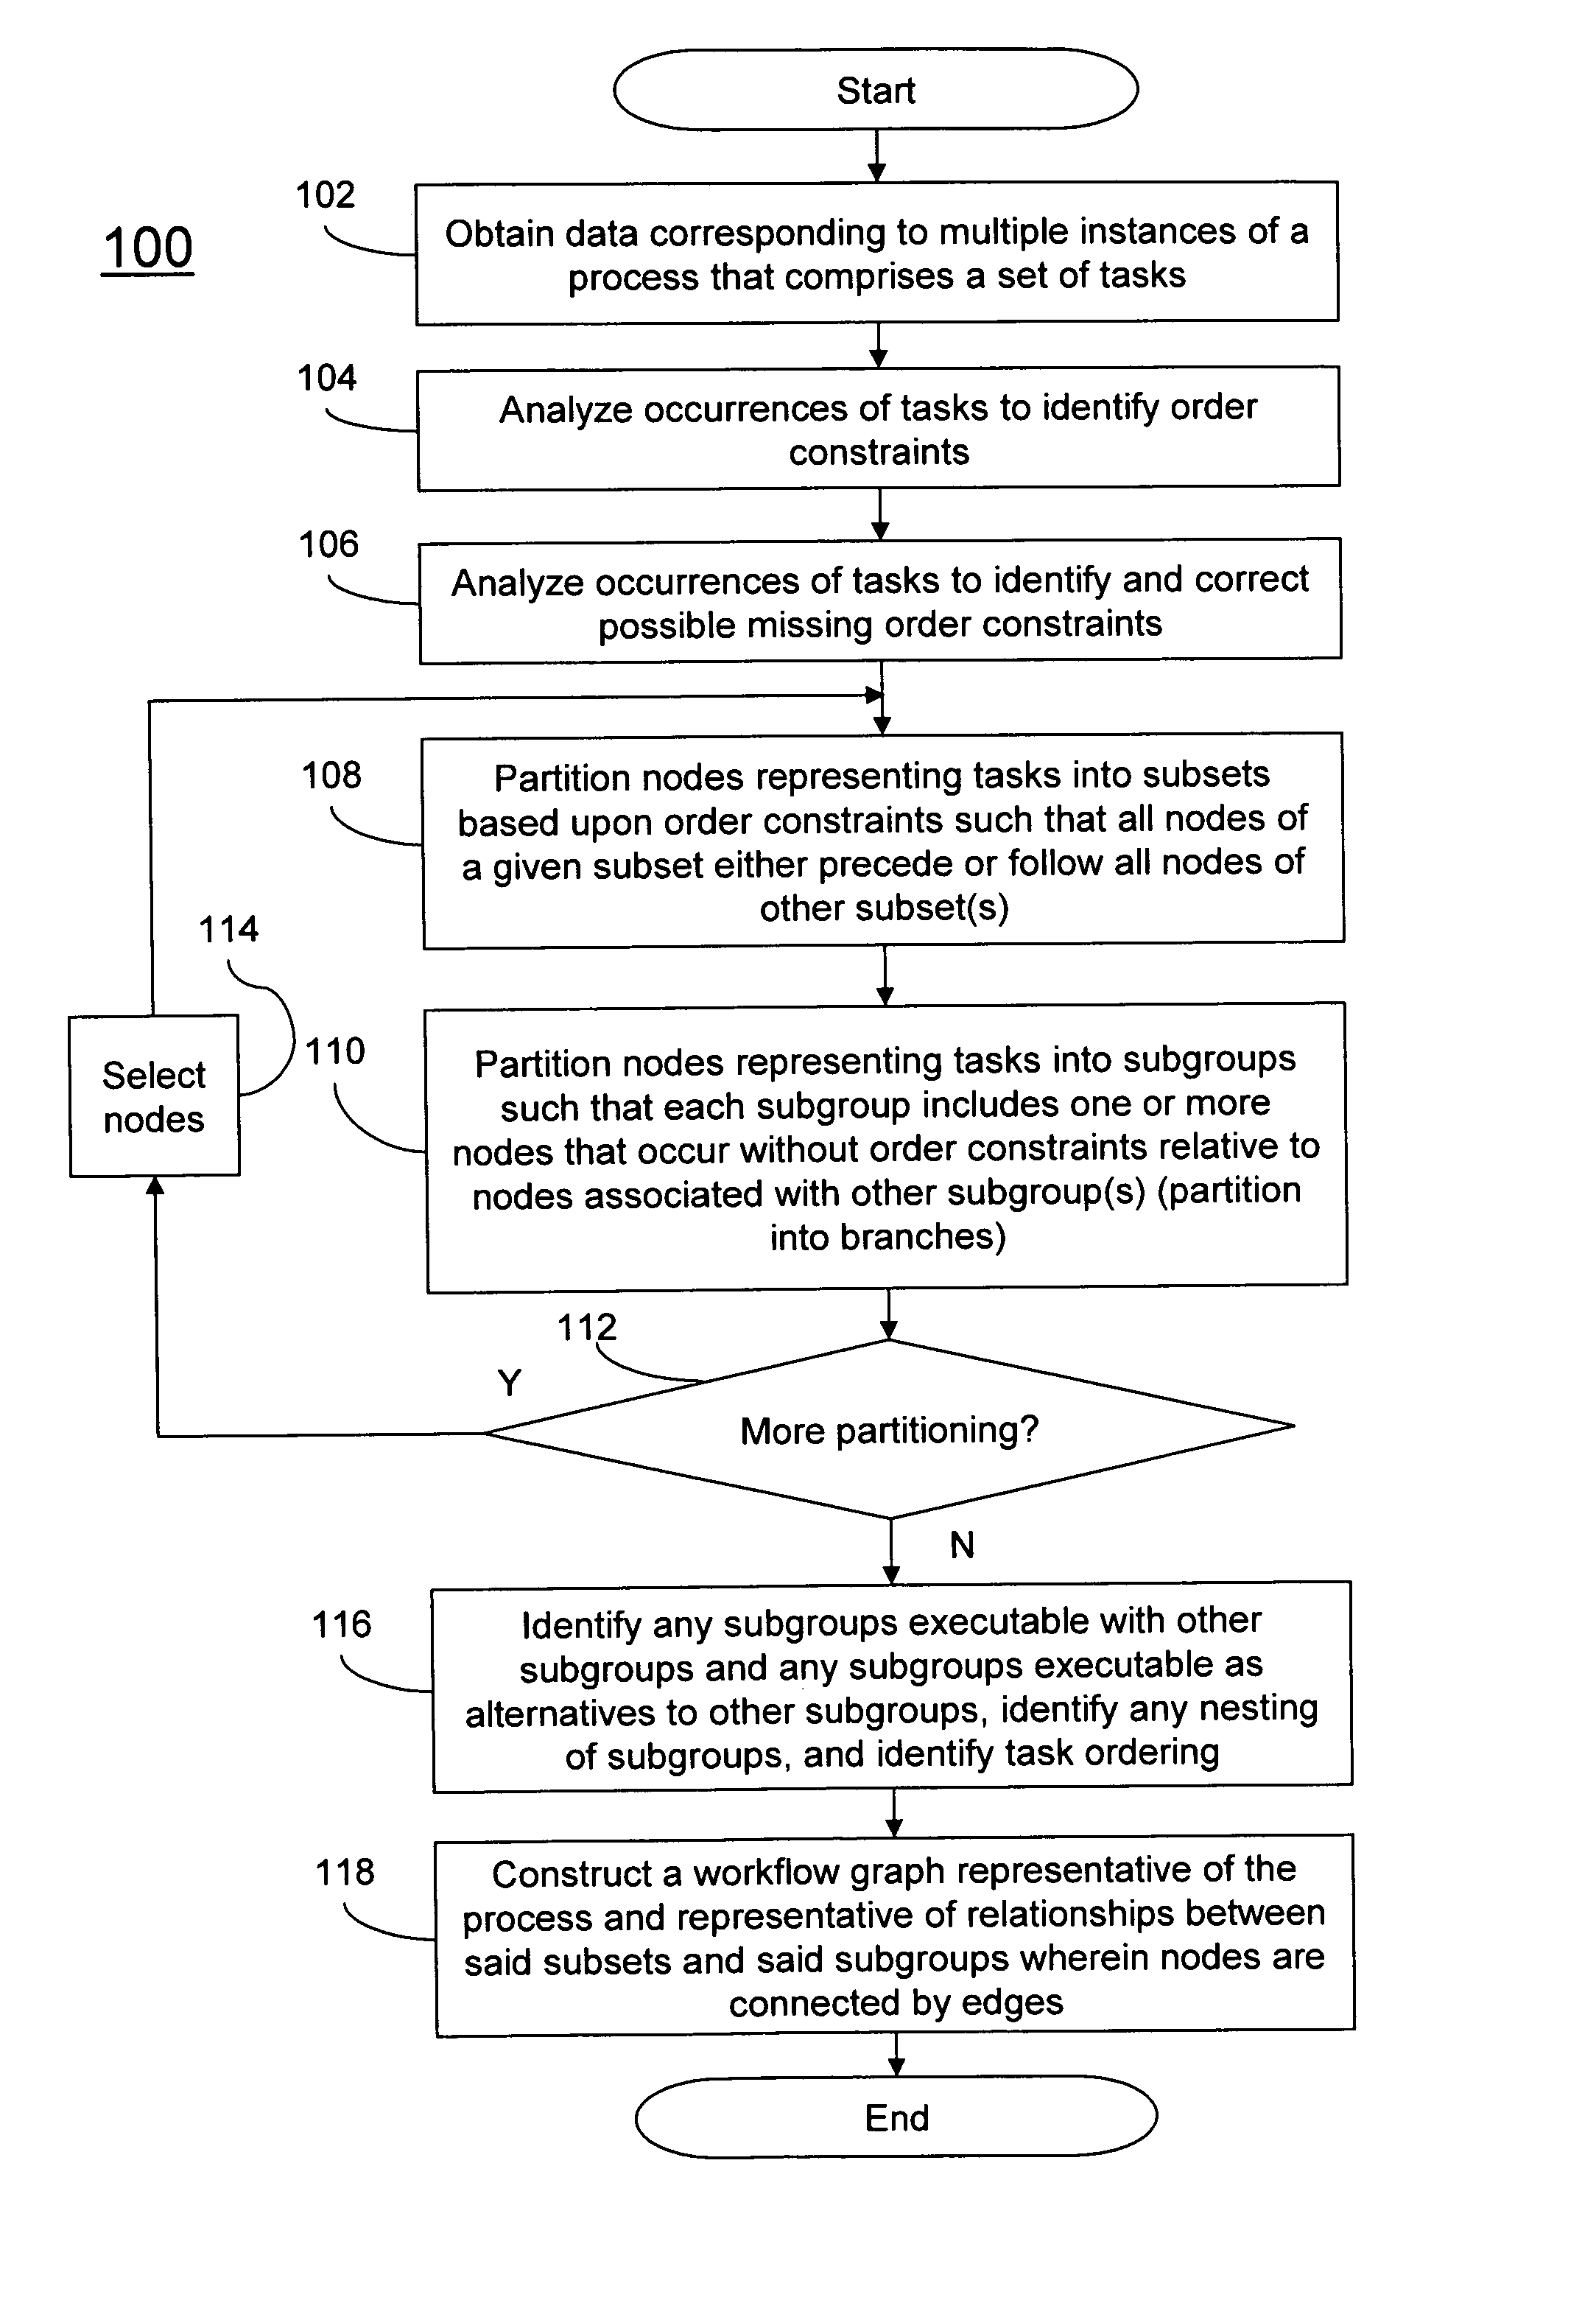
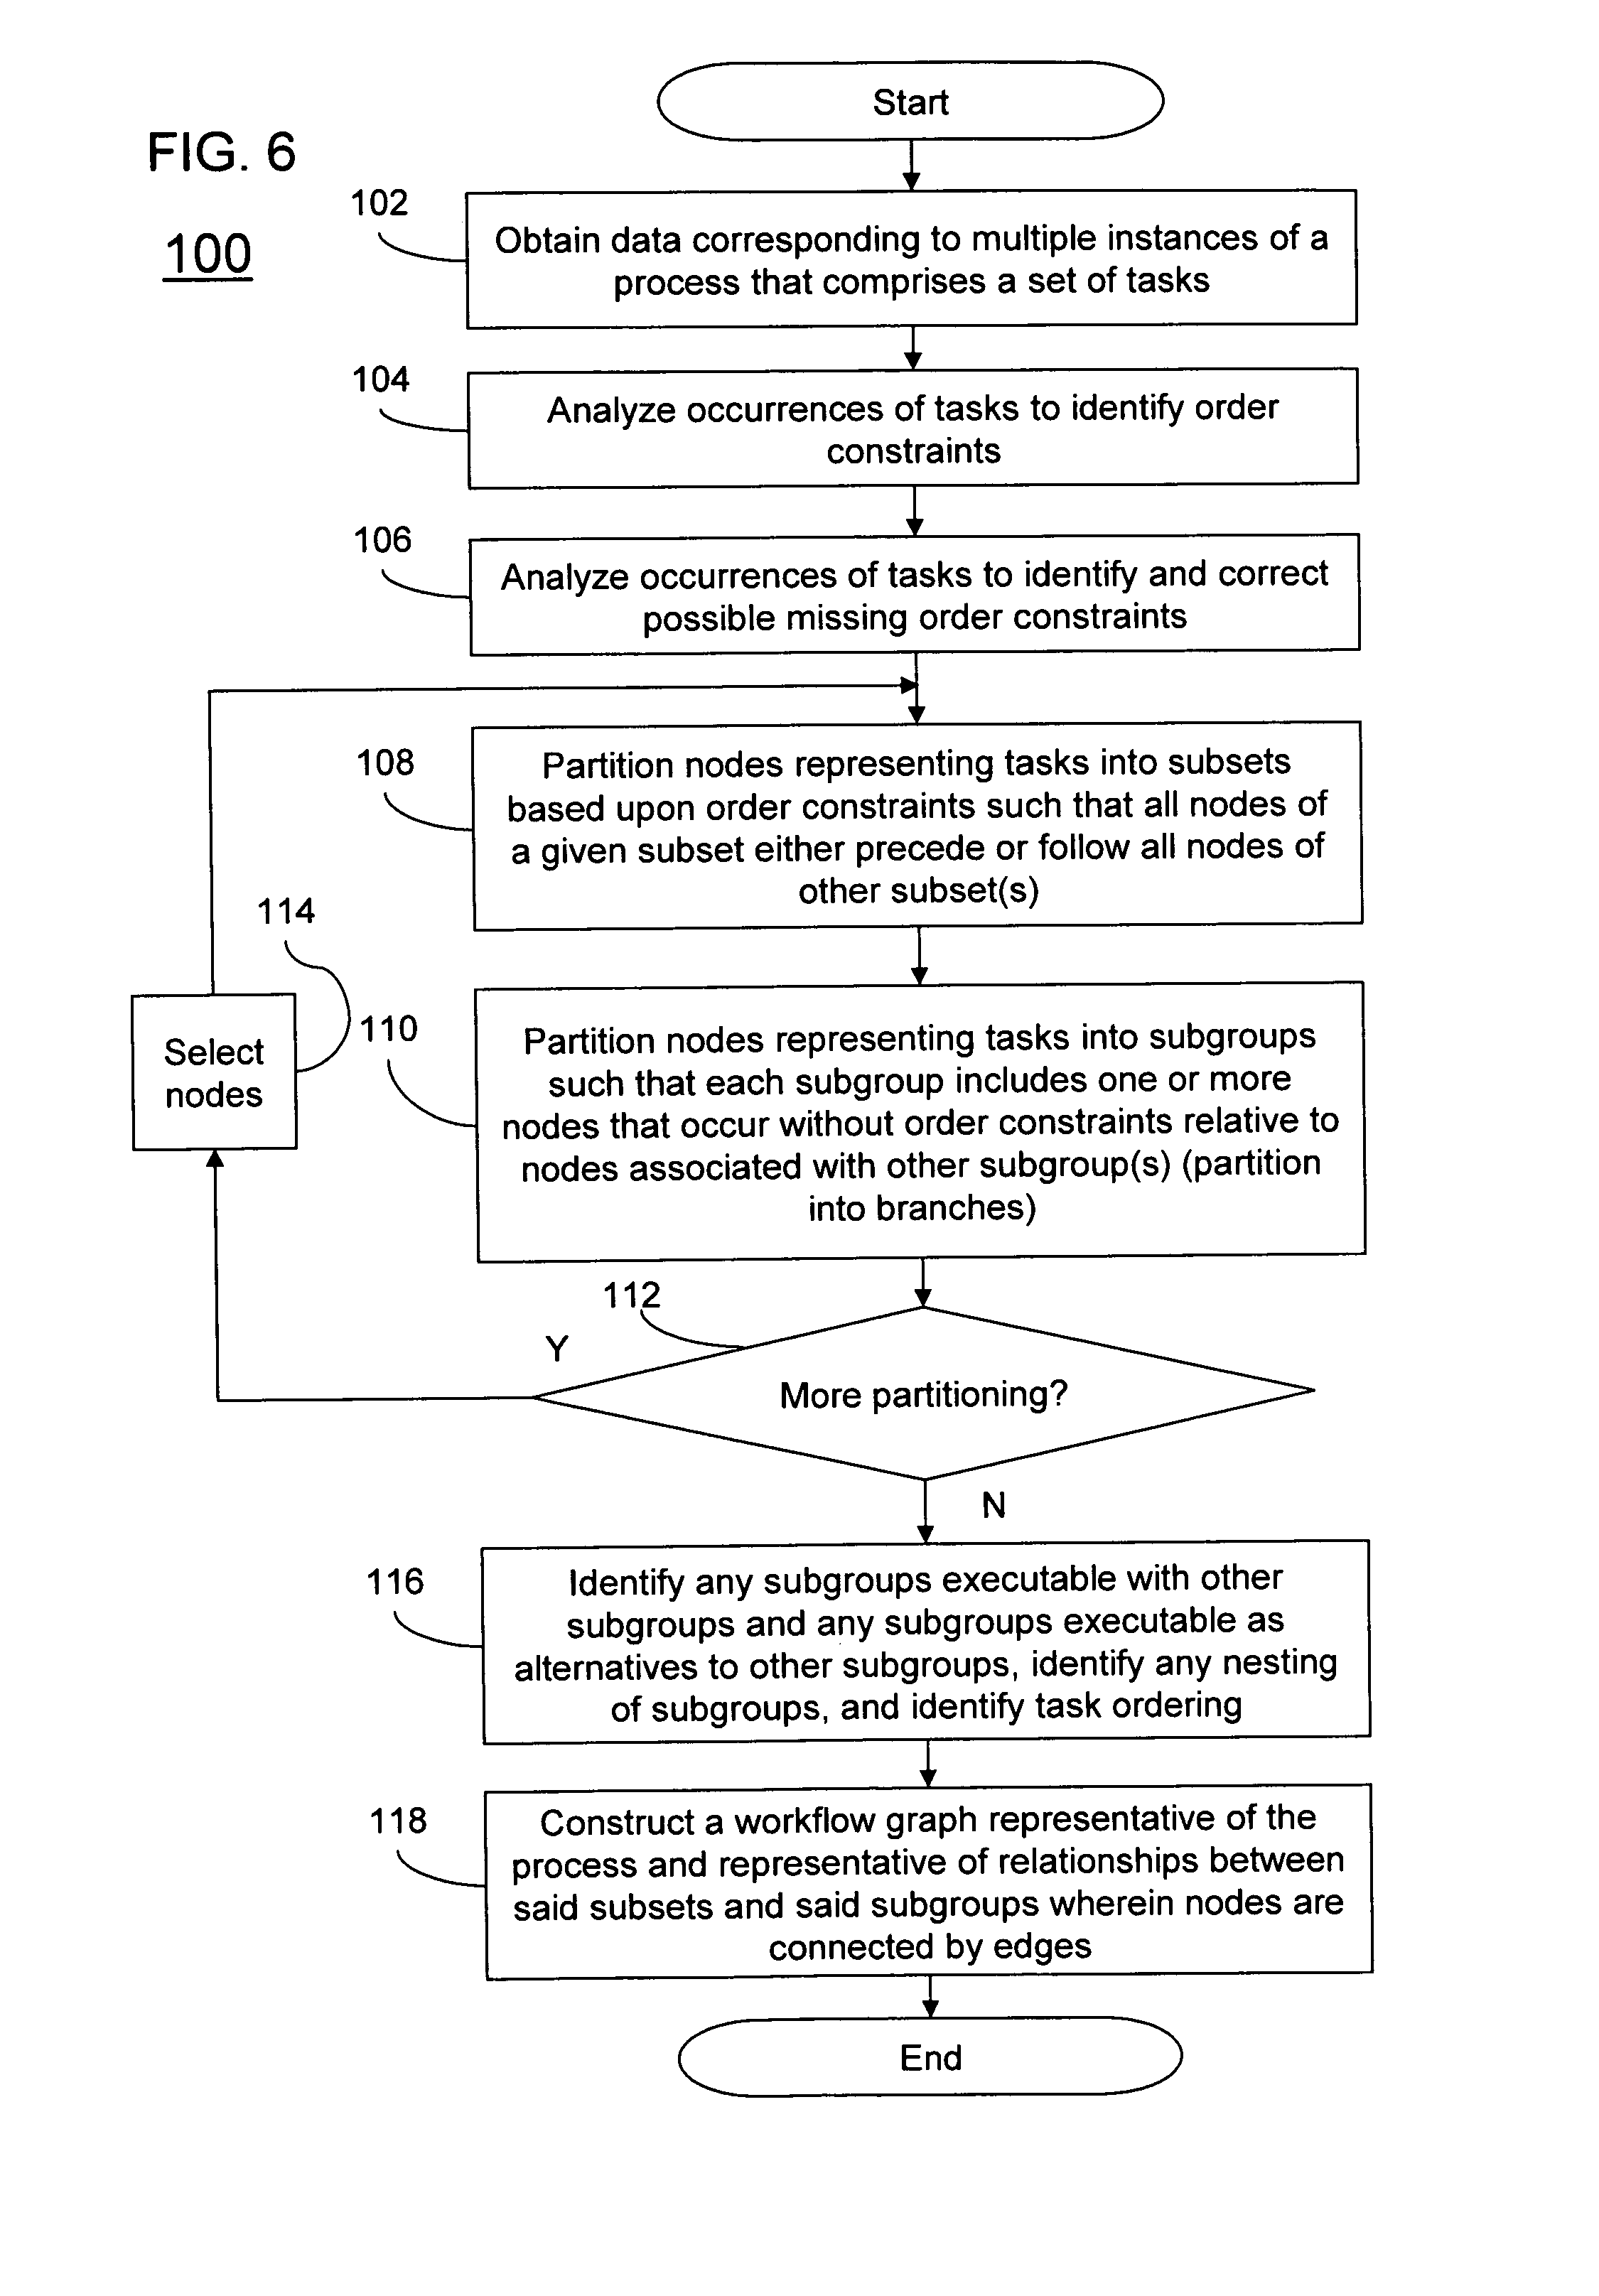
[0122]Consider the hypothetical data reflected in FIG. 7A and the corresponding ordering information reflected in FIGS. 7B-7E. There are eight nodes associated with this data, and these nodes are referred to as T1, T2, T3, . . . , T8 as reflected in FIGS. 7A-7E. In this example, these nodes make up the set N referred to in FIG. 8. This hypothetical data will now be discussed in connection with the exemplary method 600 shown in FIG. 12 to illustrate how the method 600 can generate a workflow graph for this hypothetical data.

[0123]Steps 102 and 104 have already been discussed in connection with the hypothetical data, and it will be assumed for the sake of this example that no potentially missing order constraints have been identified (step 106). An initial iteration of sequence decomposition identified at step 108 can be carried out according to the method 200 illustrated in FIG. 8. In particular, at step 202 sets S, P, F and Q are set to be empty. At step 204, we assume that node T1 ...

example 2

[0153]Examples relating to removing order constraints to facilitate sequence and branch decomposition will now be described. Consider a set of tasks having order constraints such a graph of the corresponding nodes is illustrated as shown in FIG. 19A. A process with this set of order constraints is not consistent with the model because nodes that are siblings do not necessarily share exactly the same parents. Order constraints can be removed from the corresponding data structure containing order constraint information so as to make the data consistent with the graph model according to the methods illustrated in FIGS. 13, 14 and 15. For FIG. 19A, three possible consistent final graphs are shown in FIGS. 19B-19D.

[0154]With reference to the method 700 of FIG. 13, the process 700 will first determine whether any single direct constraint (i.e., n=1 initially) can be removed to create a consistent graph. Since there are multiple branch connections between the first and second layers and th...


PUM


Abstract

A method and system for generating a workflow graph from empirical data of a process are described. A processing system obtains data corresponding to multiple instances of a process, the process including a set of tasks, the data including information about order of occurrences of the tasks. The processing system analyzes the occurrences of the tasks to identify order constraints. The processing system partitions nodes representing tasks into subsets based upon the order constraints, wherein the subsets are sequence ordered with respect to each other such that all nodes associated with a given subset either precede or follow all nodes associated with another subset. The processing system partitions nodes representing tasks into subgroups, wherein each subgroup includes one or more nodes that occur without order constraints relative to nodes associated with other subgroups. A workflow graph representative of the process is constructed wherein nodes are connected by edges.

Description

BACKGROUND[0001]1. Field of the Invention[0002]The present disclosure relates to a method and apparatus for generating a workflow graph. More particularly, the present disclosure relates to a computer-based method and apparatus for automatically identifying a workflow graph from empirical data of a process using an iterative algorithm.[0003]2. Background Information[0004]Over time, individuals and organizations implicitly or explicitly develop processes to support complex, repetitive activities. In this context, a process is a set of tasks that must be completed to reach a specified goal. Examples of goals include manufacturing a device, hiring a new employee, organizing a meeting, completing a report, and others. Companies are strongly motivated to optimize business processes along one or more of several possible dimensions, such as time, cost, or output quality.[0005]Many business processes can be modeled with workflows. As used herein, a workflow (also referred to herein as a wor...

Claims


Application Information

Patent Timeline
Patent Type & Authority Applications(United States)
IPC IPC(8): G06F9/46
CPCG06Q10/04G06Q10/0633G06Q10/06316G06Q10/06
Inventor HULL, DAVID A.ROMA, NORBERT
Owner JUSTSYST EVANS RES
Why Eureka
Try Eureka