Method of Displaying Elastic Image and Diagnostic Ultrasound System

a diagnostic ultrasound and elastic image technology, applied in ultrasonic/sonic/infrasonic diagnostics, instruments, applications, etc., can solve the problems of difficult to recognize regions with different distortions, hardness cannot be quantitatively evaluated, and distortion increases when strongly compressed, so as to achieve excellent reproducibility and evaluation ability, and increase or decrease compression

Inactive Publication Date: 2008-03-20
HITACHI LTD
View PDF4 Cites 36 Cited by
  • Summary
  • Abstract
  • Description
  • Claims
  • Application Information

AI Technical Summary

Benefits of technology

[0015] According to the present invention, since a plurality of regions of interest (ROIs) whose physical values correlating to the elasticity of the tissue, i.e., distortions or the elasticity moduli, are to be compared are set on the elastic image, for example, regions having different distortions can be easily recognized, the size and the positions of the plurality of ROIs to be compared can be appropriately set. In particular, since the distortions of the plurality of regions of interest related to the comparison are mutually converted into index values and the index values are displayed on the display device, the difference in the hardness of the regions of interest can be quantitatively evaluated and a highly accurate diagnosis is possible. For example, a ROI set in a region of normal tissue or a region in body tissue with small individual difference in hardness is set as a reference to represent the hardness of the ROI set in a region presumed to be an affected area, such as a tumor, as an index.
[0018] As the regions of interest, a first region of interest set in an affected area and second and third regions of interest being set away from each other in the lateral direction of the elastic image and sandwiching the first region of interest may be set. In such case, the index value may be a ratio of the physical value of the first region of interest and the sum of the physical values of the second and third regions of interest. In this way, even when the pressure applied to the regions of interest is biased, the average of an area where pressure is weak and an area where the pressure is strong may be obtained to balance the stress.
[0019] Furthermore, it is preferable for displaying a colored elastic image to determine average values of the physical values of the regions of interest and respectively relate the minimum value and the maximum value of the average values to a lower limit value and an upper limit value of a dynamic range of color information for color conversion. In this way, the resolution of the color display can be improved. In such a case, the level of the dynamic range corresponding to an intermediate value can be variably set when at least three regions of interest are set and the intermediate value is between the minimum value and the maximum value of the average values of the physical values. In this way, by changing the gradation between the regions of interest to increase the gradation, visual observation is facilitated.
[0020] The method of displaying an elastic image according to the present invention is not limited to comparing the hardness of tissue in a plurality of regions of interest in the same cross-section region. For, for example, tissue in corresponding regions, such as the left and right hands, feet, or breasts, the ultrasound cross-section data of each of left and right cross-section regions, which are symmetrical, of the subject are measured; elastic images of the left and right cross-section regions can be generated and displayed; two regions of interest can be set in each of the left and right displayed elastic images; the ratio of the physical values of the two set regions of interest can be determined for each of the left and right elastic images; and the ratio of the ratios of the physical values of the two regions of interest can be determined for the left and right elastic images. In this way, the difference in the hardness of the tissue in corresponding regions, such as the left and right hands, feet, or breasts, can be quantitatively evaluated, and the accuracy of the diagnosis can be improved.
[0022] In this way, quantitative comparison of regions of interest for distortions that change in accordance with the change in the compression force can be accurately carried out. In such a case, the physical value of each of the regions of interest can be converted into an index value, and the change over time of the index value can be displayed on the display device. The change in the added value obtained by adding in order the index values of the regions of interest corresponding to a plurality of frames can be displayed on the display device. Furthermore, a time average of the index values of the regions of interest corresponding to a plurality of frames can be determined and displayed on the display device.
[0024] The diagnostic ultrasound system may include pressuring controlling means for supporting the ultrasound probe and for increasing or decreasing the compression applied to the subject with the ultrasound probe and fixing means for supporting the pressuring controlling means. In this way, since compression can be applied at constant pressure and constant speed to body tissue without depending on the repulsive force of the subject, a distortion elastic image with excellent reproducibility and evaluation ability can be obtained, and the index values of the physical values correlating to the elasticity according to the present invention can be stabilized.

Problems solved by technology

Since the displacement of the body tissue changes depending on the magnitude of the compression force, even for body tissue in the same region, distortion increases when strongly compressed.
Therefore, a color elastic image representing distortion merely represents a relative display of the distortion of the regions on the color elastic image, and hardness cannot be quantitatively evaluated.
However, since a B-mode image does not represent distortion of tissue, it is difficult to recognize regions having different distortions.
Thus, according to the technique described in Patent Document 2, it is difficult to appropriately set the magnitudes and the positions of the two ROIs whose distortions are to be compared.
Moreover, according to Patent Document 2, hardness cannot be quantitatively evaluated because consideration is not taken into account for a case in which, for example, the hardness of a region that is presumed to be an affected region, such as a tumor, be represented as an index, such as a ratio, with reference to a region of normal tissue or a region of body tissue having less individual difference in hardness.

Method used


Image

  • Method of Displaying Elastic Image and Diagnostic Ultrasound System
  • Method of Displaying Elastic Image and Diagnostic Ultrasound System
  • Method of Displaying Elastic Image and Diagnostic Ultrasound System

Examples


first embodiment

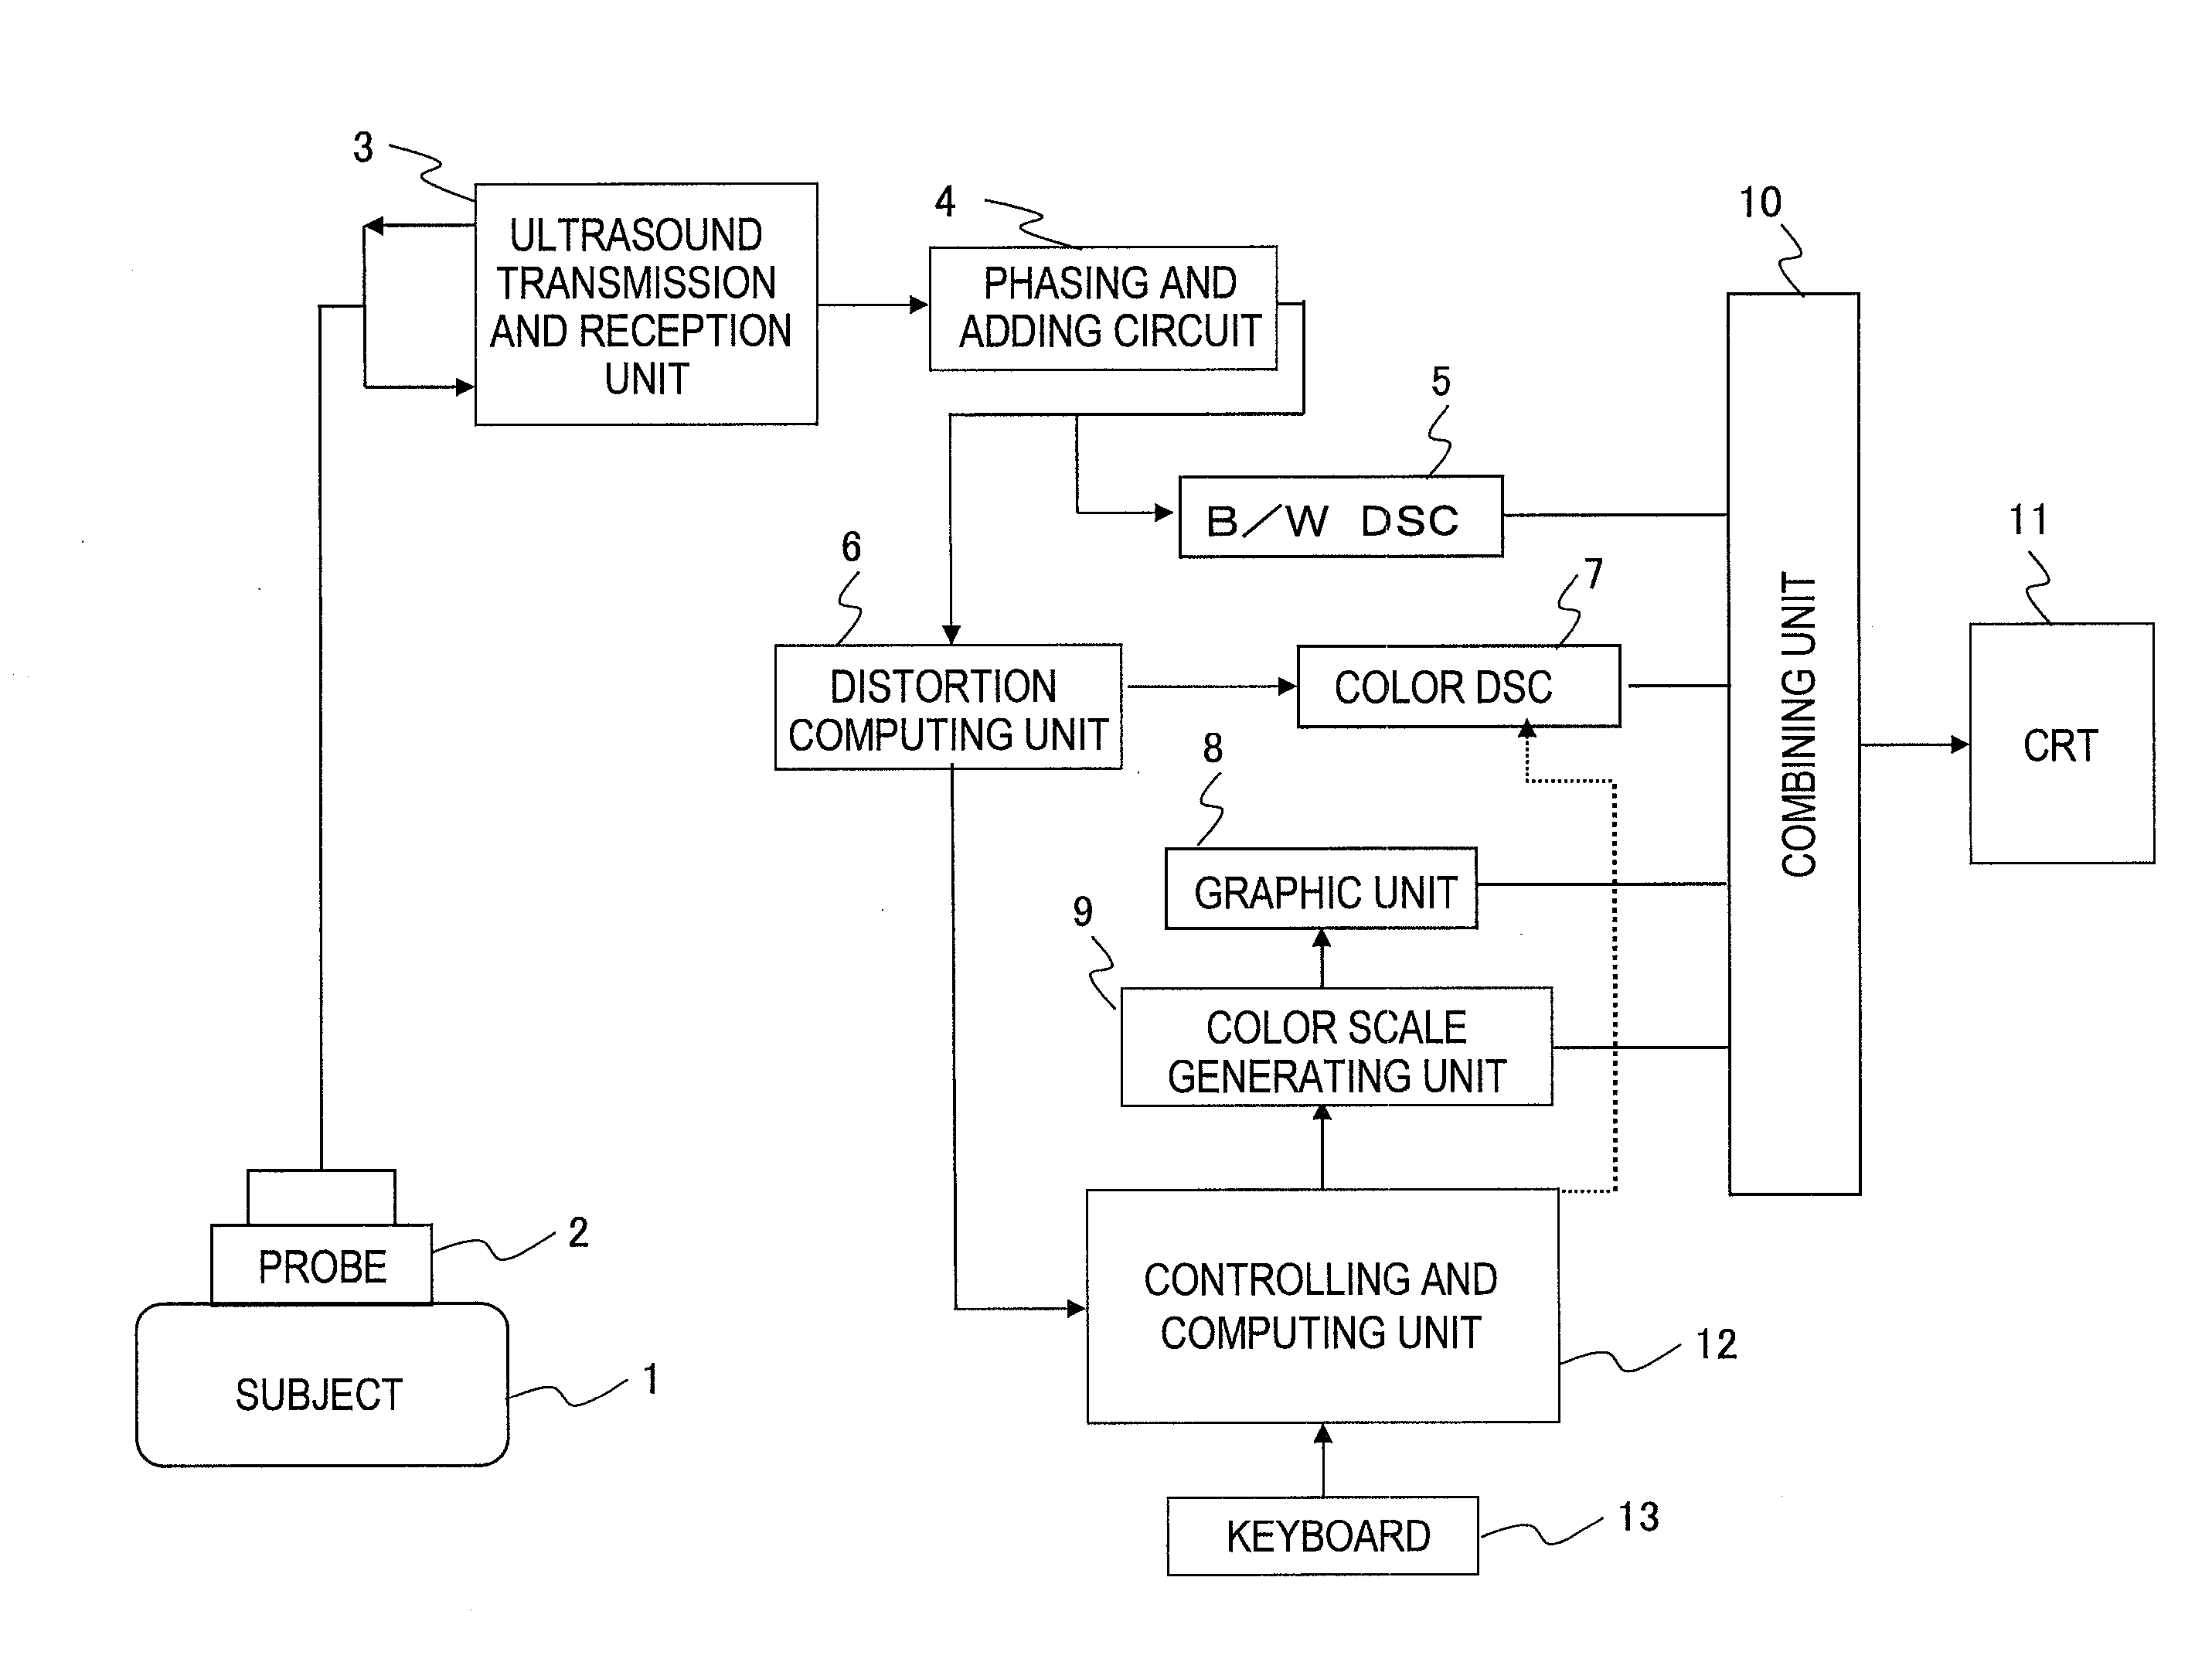
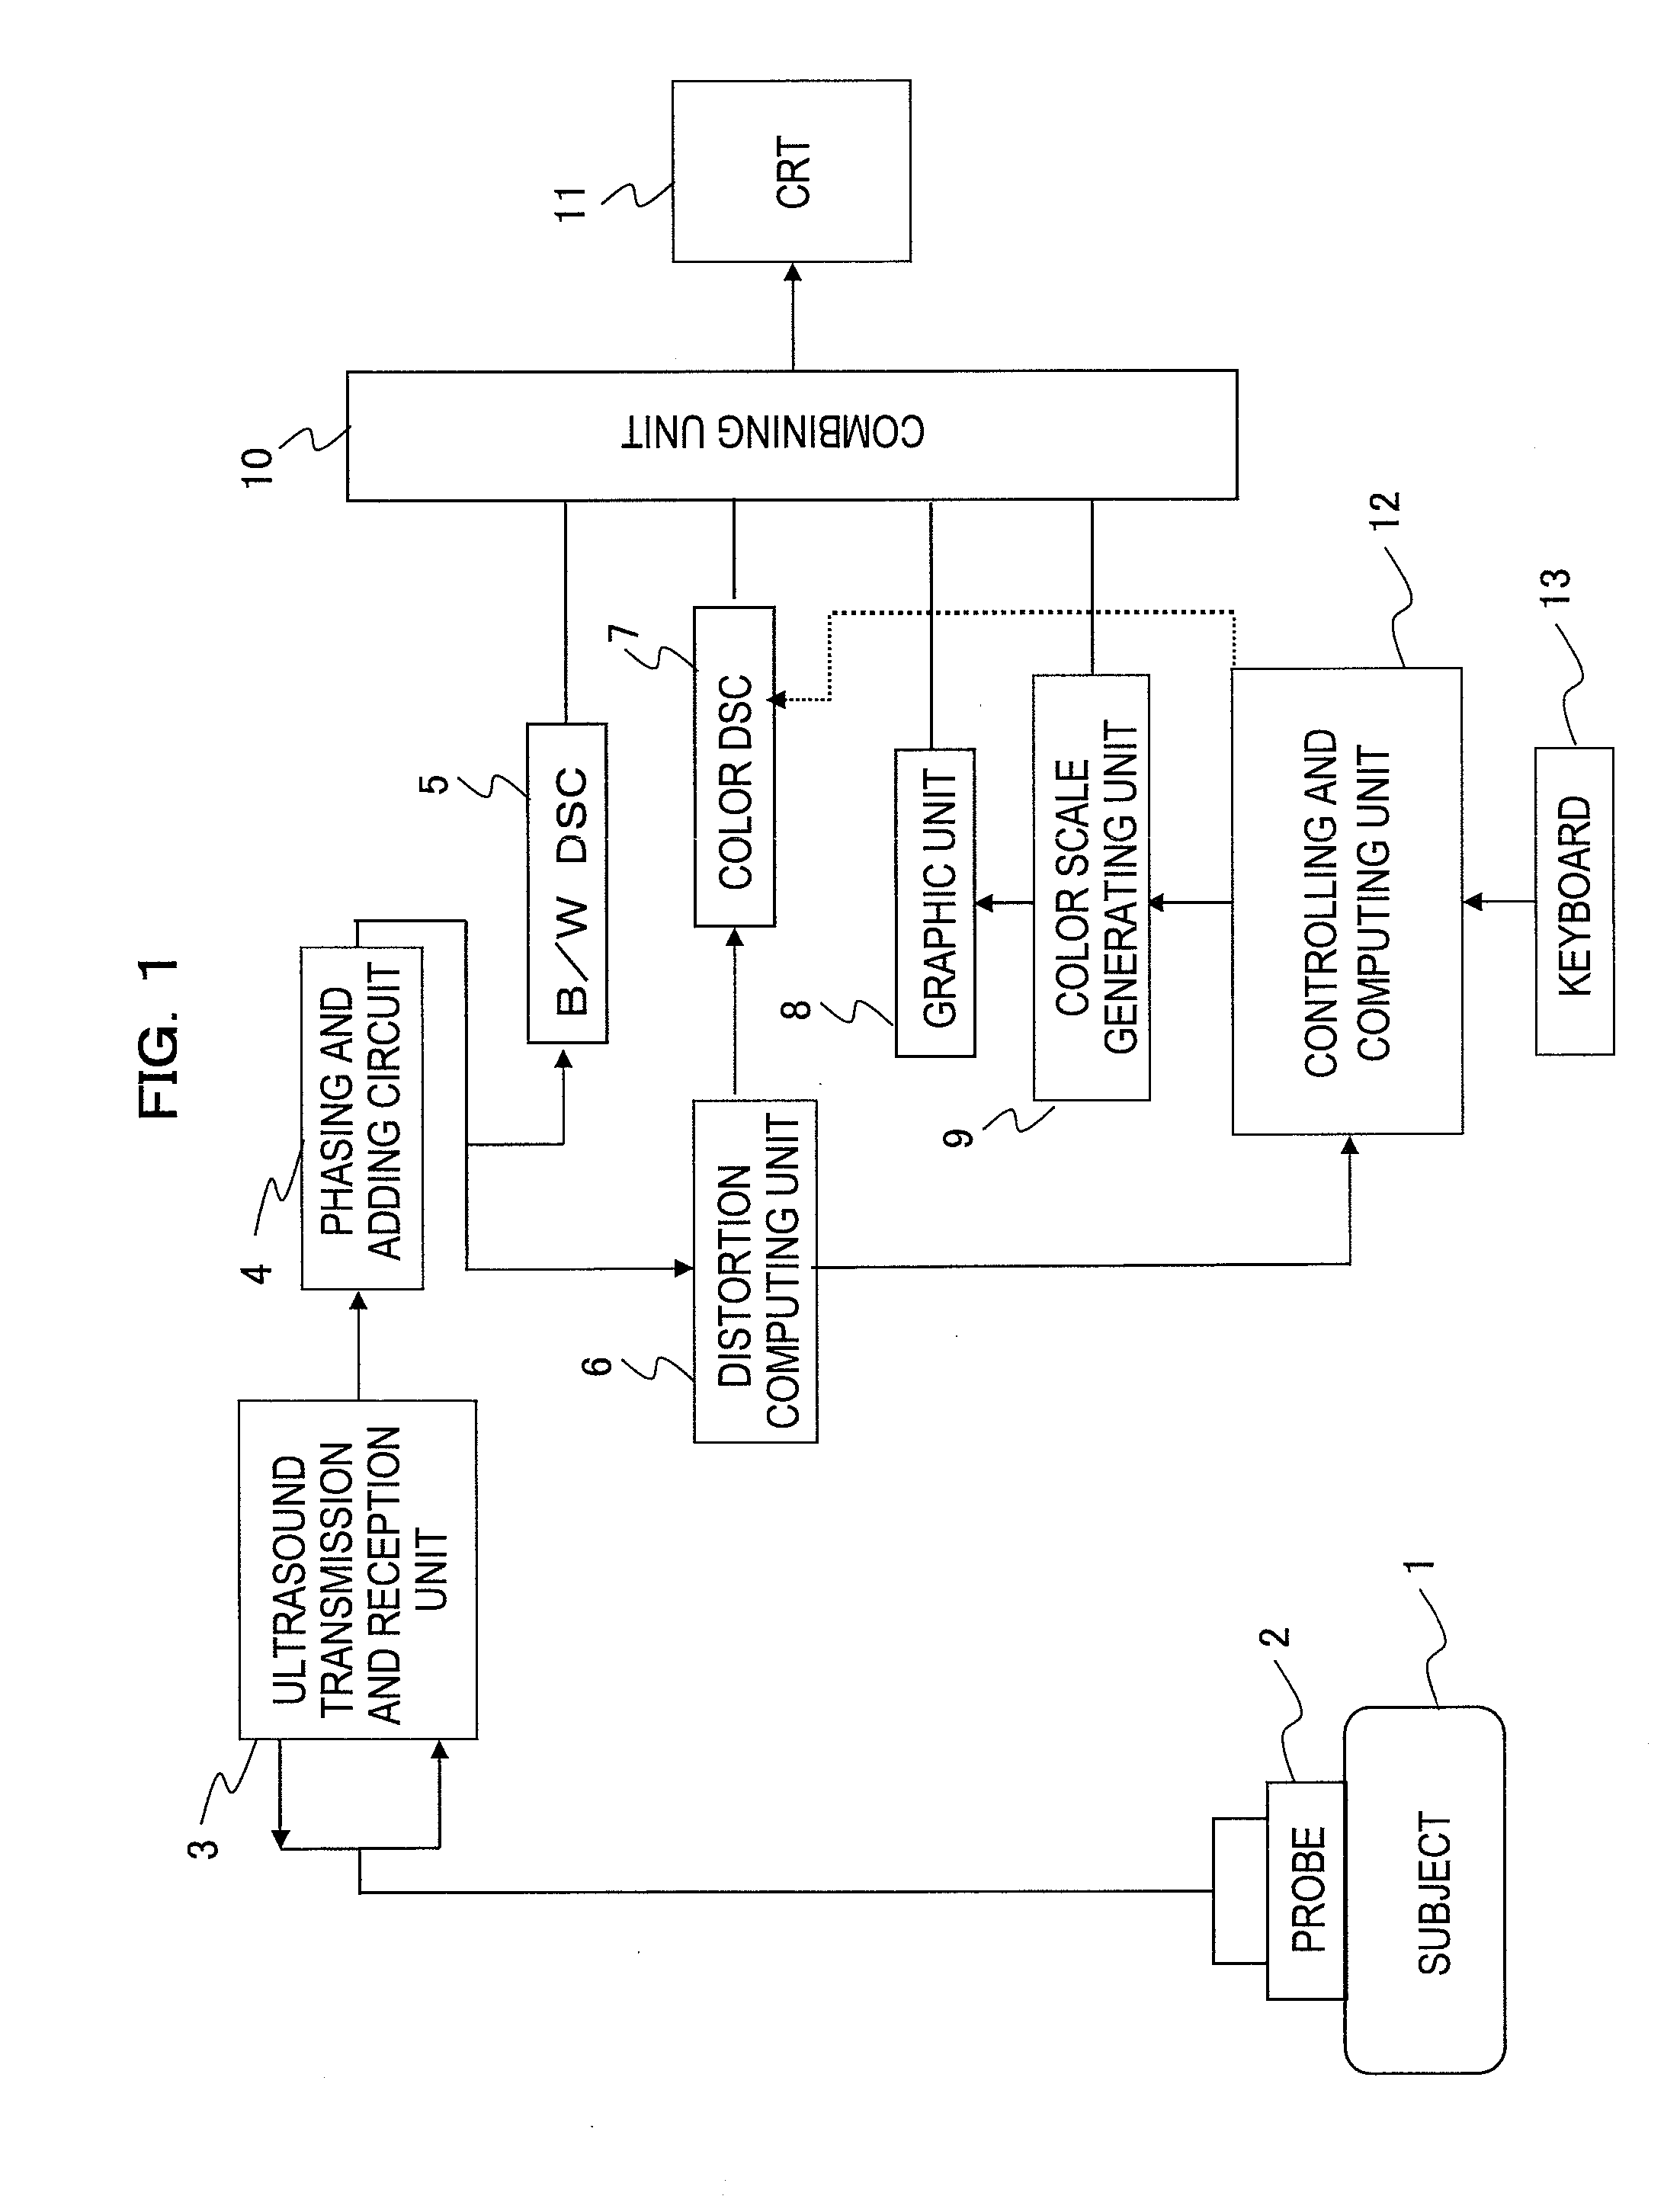
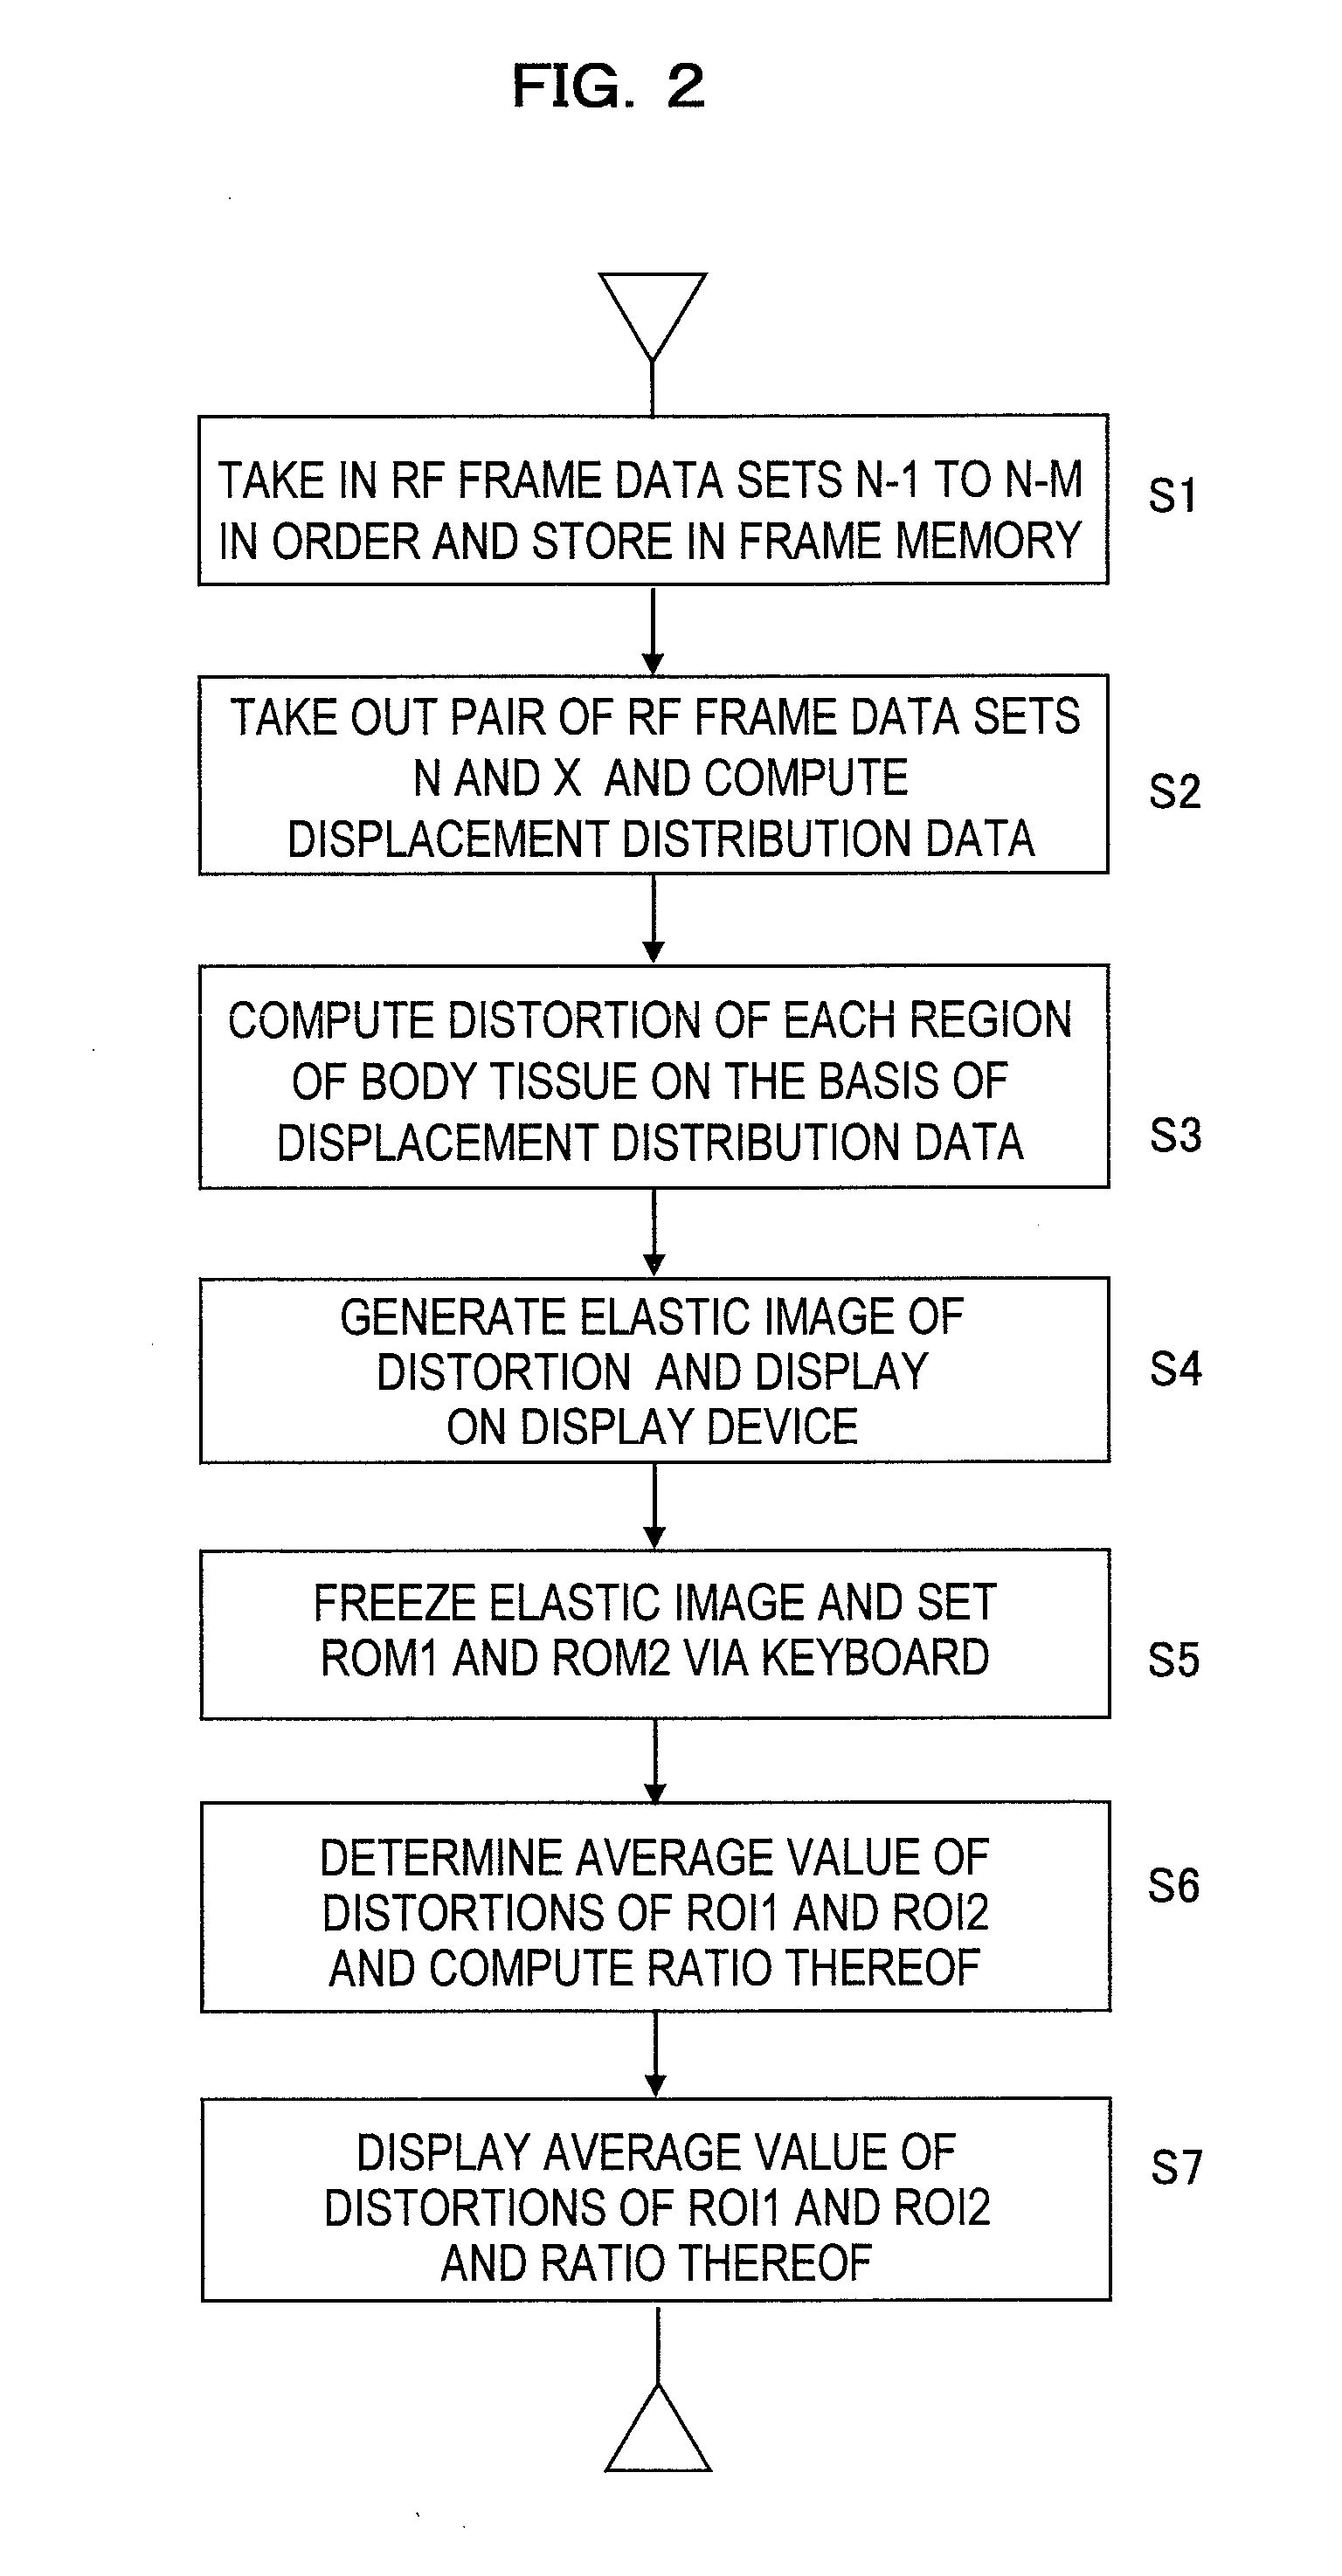
[0046]FIG. 1 illustrates the overall structure of a diagnostic ultrasound system according to an embodiment of the present invention. FIG. 2 illustrates a flow chart of a process of a method of displaying an elastic image according to an embodiment of the present invention. As shown in FIG. 1, the diagnostic ultrasound system according to this embodiment includes an ultrasound probe 2 used in contact with a subject 1, an ultrasound transmission and reception unit 3, a phasing and adding circuit 4, a cross-sectional-image configuring unit 5, a distortion computing unit 6, an elastic-image configuring unit 7, a graphic unit 8, a color-scale generating unit 9, an image combining unit 10, an image display unit 11, a controlling and computing unit 12, and a keyboard 13.

[0047] The probe 2 is constituted of a plurality of transducers and has a function of electrically carrying out electronic beam scanning on a predetermined cross-section region of the subject 1 and transmitting and receiv...

second embodiment

[0074] In the above-described embodiment, a case in which two ROIs whose values of hardness ratio are to be compared are set is described. However, the present invention is not limited, and any number of ROIs to be used for comparison can be generated by the controlling and computing unit 12 and the keyboard 13. In such a case, the distortions of a plurality of ROIs can be mutually converted into index values.

[0075] A case in which three ROIs are set will be described with reference to FIG. 6. As shown in the drawing, on an elastic image or a combined image of an elastic image and a B-mode image, a ROI1 is set, and ROI2 and ROI3, which are vertically provided at positions laterally apart from the ROI1, are set. The distortions in these ROIs or the average values are mutually converted into index values, and the index values are displayed on the image display unit 11.

[0076] Examples of the index values for such a case are listed below.

[0077] (1) Ratio of distortion average values ...

third embodiment

[0082] In the above-described first and second embodiments, examples of converting the distortions of a plurality of ROIs to be compared into index values and displaying these on the image display unit 11 are described. However, the present invention is not limited, and, as shown in FIG. 8A or BB, the change over time of the distortions or the distortion ratios of ROI1, ROI2, and ROI3 can be represented as a graph. The positions of the ROIs according to this embodiment are the same as those in FIG. 6.

[0083] More specifically, as shown in FIG. 8A or BB, by determining the distortions or the distortion ratios on the basis of ultrasound measurement data for a plurality of frames measured in time sequence and displaying the change over time as a graph, the difference in the hardness of the ROIs can be recognized without flaw.

[0084]FIG. 5B will be described in detail. Here, for the sake of description, the ROI1 and ROI3 are normal regions and the ROI2 is a tumorous region. Since ROI1 / R...


PUM


Abstract

A method of displaying an elastic image according to the present invention includes the steps of measuring ultrasound cross-section data of a cross-section region of a subject while applying compression to the subject 1 (2, 3, 4), determining distortion of tissue in the cross-section region on the basis of the ultrasound cross-section data, generating an elastic image of the cross-section region on the basis of the distortion, displaying the elastic image on a display device (7), setting a plurality of ROIs on the elastic image displayed on the display device, converting the distortion of each ROI into an index value (12), and displays the index value on the display device (8). In this way, the method enables quantitative evaluation of the hardness of body tissue of a region to be diagnosed.

Description

TECHNICAL FIELD [0001] The present invention relates to a method of displaying an elastic image and a diagnostic ultrasound system suitable for quantitatively evaluating the hardness (hereinafter referred to as “elasticity”) of body tissue of a region to be diagnosed by ultrasound examination. BACKGROUND ART [0002] A diagnostic ultrasound system transmits ultrasonic waves to the inside of a subject by an ultrasound probe, receives a reflected echo signal of the ultrasonic waves corresponding to the structure of the body tissue from the inside of the subject, reconstructs a cross-sectional image, such as a B-mode image, and displays this for diagnosis. [0003] Recently, it has been proposed to measure ultrasound image data by applying compression a subject by a manual or mechanical method, determine the displacement of various body regions caused by the compression on the basis of frame data of two ultrasound images having different measurement time periods, and generate an elastic im...

Claims


Application Information

Patent Timeline
Patent Type & Authority Applications(United States)
IPC IPC(8): A61B8/00
CPCA61B5/0048A61B8/08A61B8/463A61B8/485G01S7/52042G01S7/52071G01S7/52074G01S7/52036A61B8/469A61B8/5223G16H50/30
Inventor WAKI, KOJISHIINA, TSUYOSHIYAMAKAWA, MAKOTOMAEDA, MASARU
Owner HITACHI LTD
Why Eureka
Try Eureka