Apparatus and Method For Analysis of Size, Form and Angularity and For Compositional Analysis of Mineral and Rock Particles

a technology of mineral and rock particles and composition analysis, applied in the field of equipment and methods for mineral and rock particles analysis, can solve problems such as tedious semis

Active Publication Date: 2008-08-14
PETROMODEL EHF
View PDF9 Cites 81 Cited by
  • Summary
  • Abstract
  • Description
  • Claims
  • Application Information

AI Technical Summary

Benefits of technology

[0005]It is an objective of the present invention to provide an apparatus and method for high-throughput analysis of objects/particles in a sample selected from minerals, rocks, gravel, natural, manufactured or recycled aggr

Problems solved by technology

Such analyses have hitherto been based on tedious semi-mechanic

Method used


Image

  • Apparatus and Method For Analysis of Size, Form and Angularity and For Compositional Analysis of Mineral and Rock Particles
  • Apparatus and Method For Analysis of Size, Form and Angularity and For Compositional Analysis of Mineral and Rock Particles
  • Apparatus and Method For Analysis of Size, Form and Angularity and For Compositional Analysis of Mineral and Rock Particles

Examples


example 1

Guide to Program for Dart of Size, Form and Angularity Analysis

[0070]The program structure is shown diagrammatically in FIG. 2. The following section briefly describes the role and functionality of sections of an initial version of a software embodiment.

[0071]Calibration of camera 1. A single frame is captured. For each column in the image, the brightest pixel (theoretically corresponding to the centre of the laser line) is located. When the pixel intensity exceeds ‘min intensity’ (used to distinguish between pixels attributable to the laser line and pixels corresponding to background light levels), ‘Triangulation algorithm subVI’ is called to calculate height at that point. A 1D array of height values is thus generated for the frame. The median value is taken to be the height of the belt. This is used as a reference value in all subsequent triangulation calculations.

[0072]The median value is taken because the majority of the columns in the image frame should be covered by the laser...

example 2

Angularity Analysis of Rock Particles

[0107]A total of 200 rock particles in the 8-32 mm size range were scanned using the laser triangulation system and analysed by the ellipsoidal morphology algorithm. Prior to the analysis, the particles were visually assessed and graded manually according to the Powers scale by geologists at two independent institutions.

[0108]FIG. 6 shows a scatter plot of the pseudo-volume lost due to the morphological opening against the visually (manually) assessed angularity for each particle, represented in accordance with the Powers scale as a number between 1 (very angular) and 6 (well rounded).

[0109]The first observation is that the deviation in the results is very large and appears to increase with angularity. This can be confirmed by plotting the standard deviation of the percentage volume lost under each category against the Powers number, as shown in FIG. 7b. It can be seen that the standard deviation increases at a fairly uniform rate as angularity i...

example 3

Petrographic Analysis

[0110]A method was developed to obtain information about the texture of analysed rock samples. The texture is mostly influenced by the sizes of individual crystals and therefore gives information that can be important for classification, as the crystal-size of rocks can vary depending on their type.

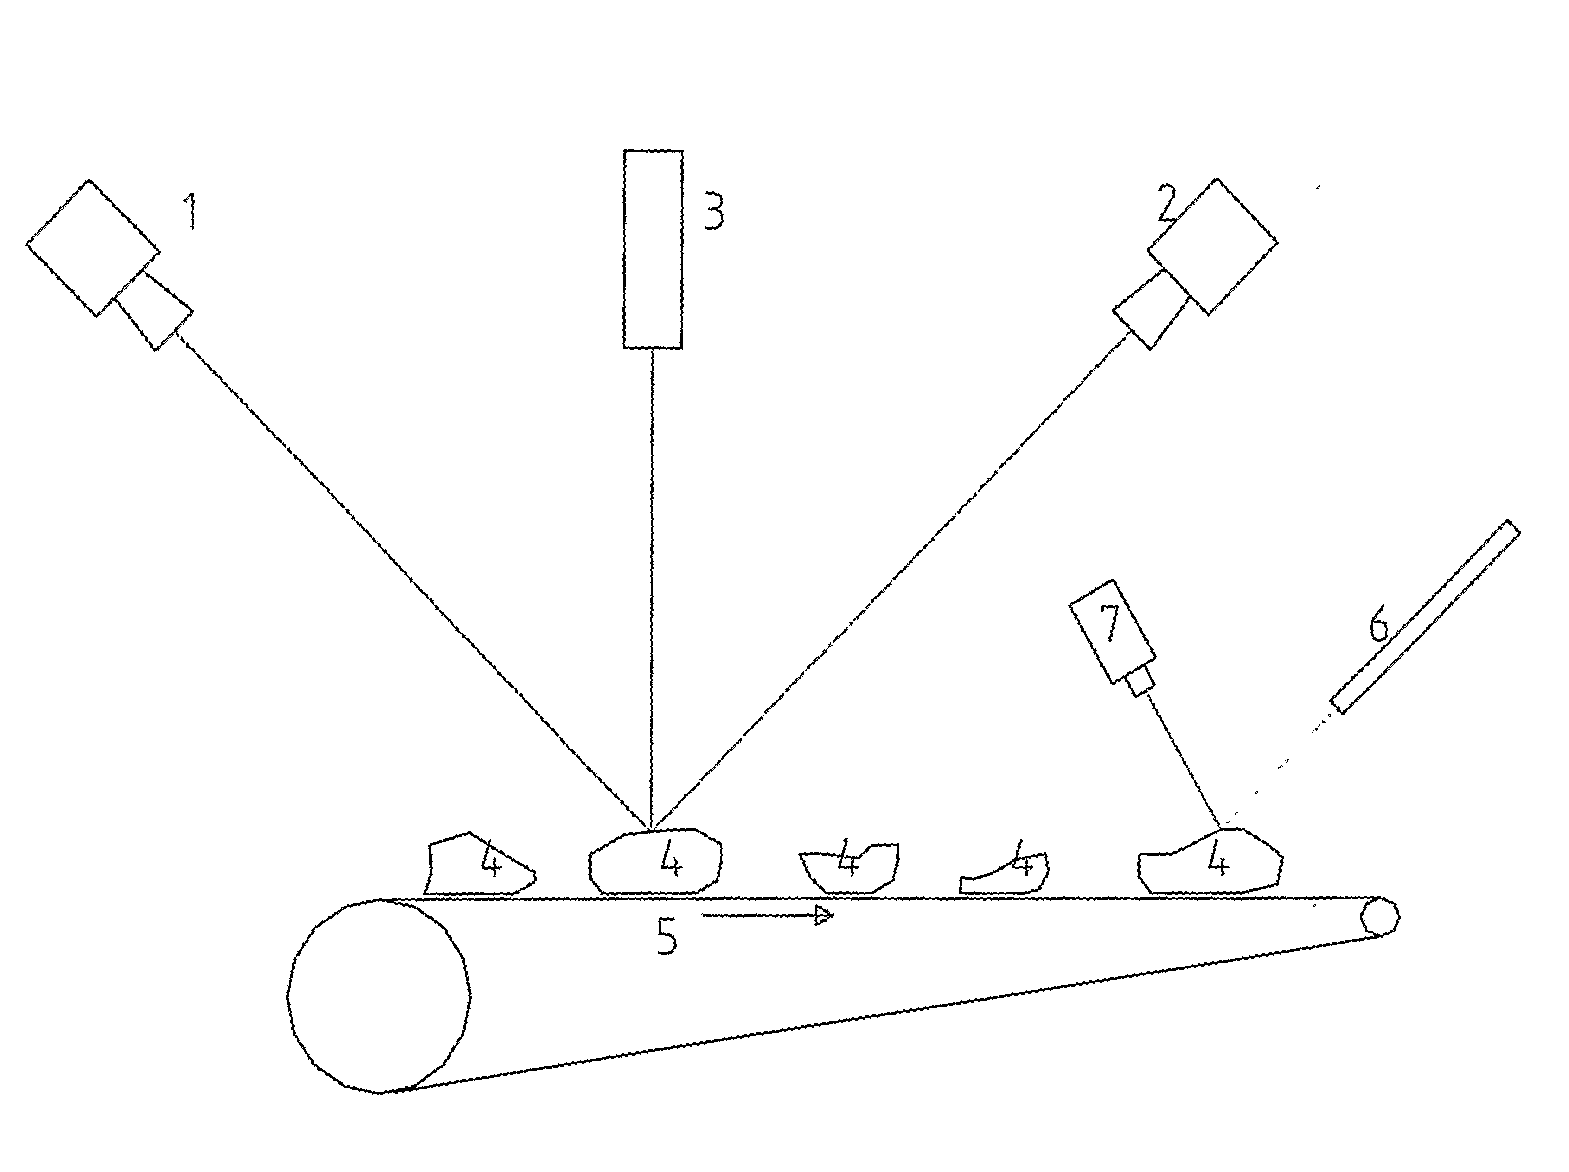
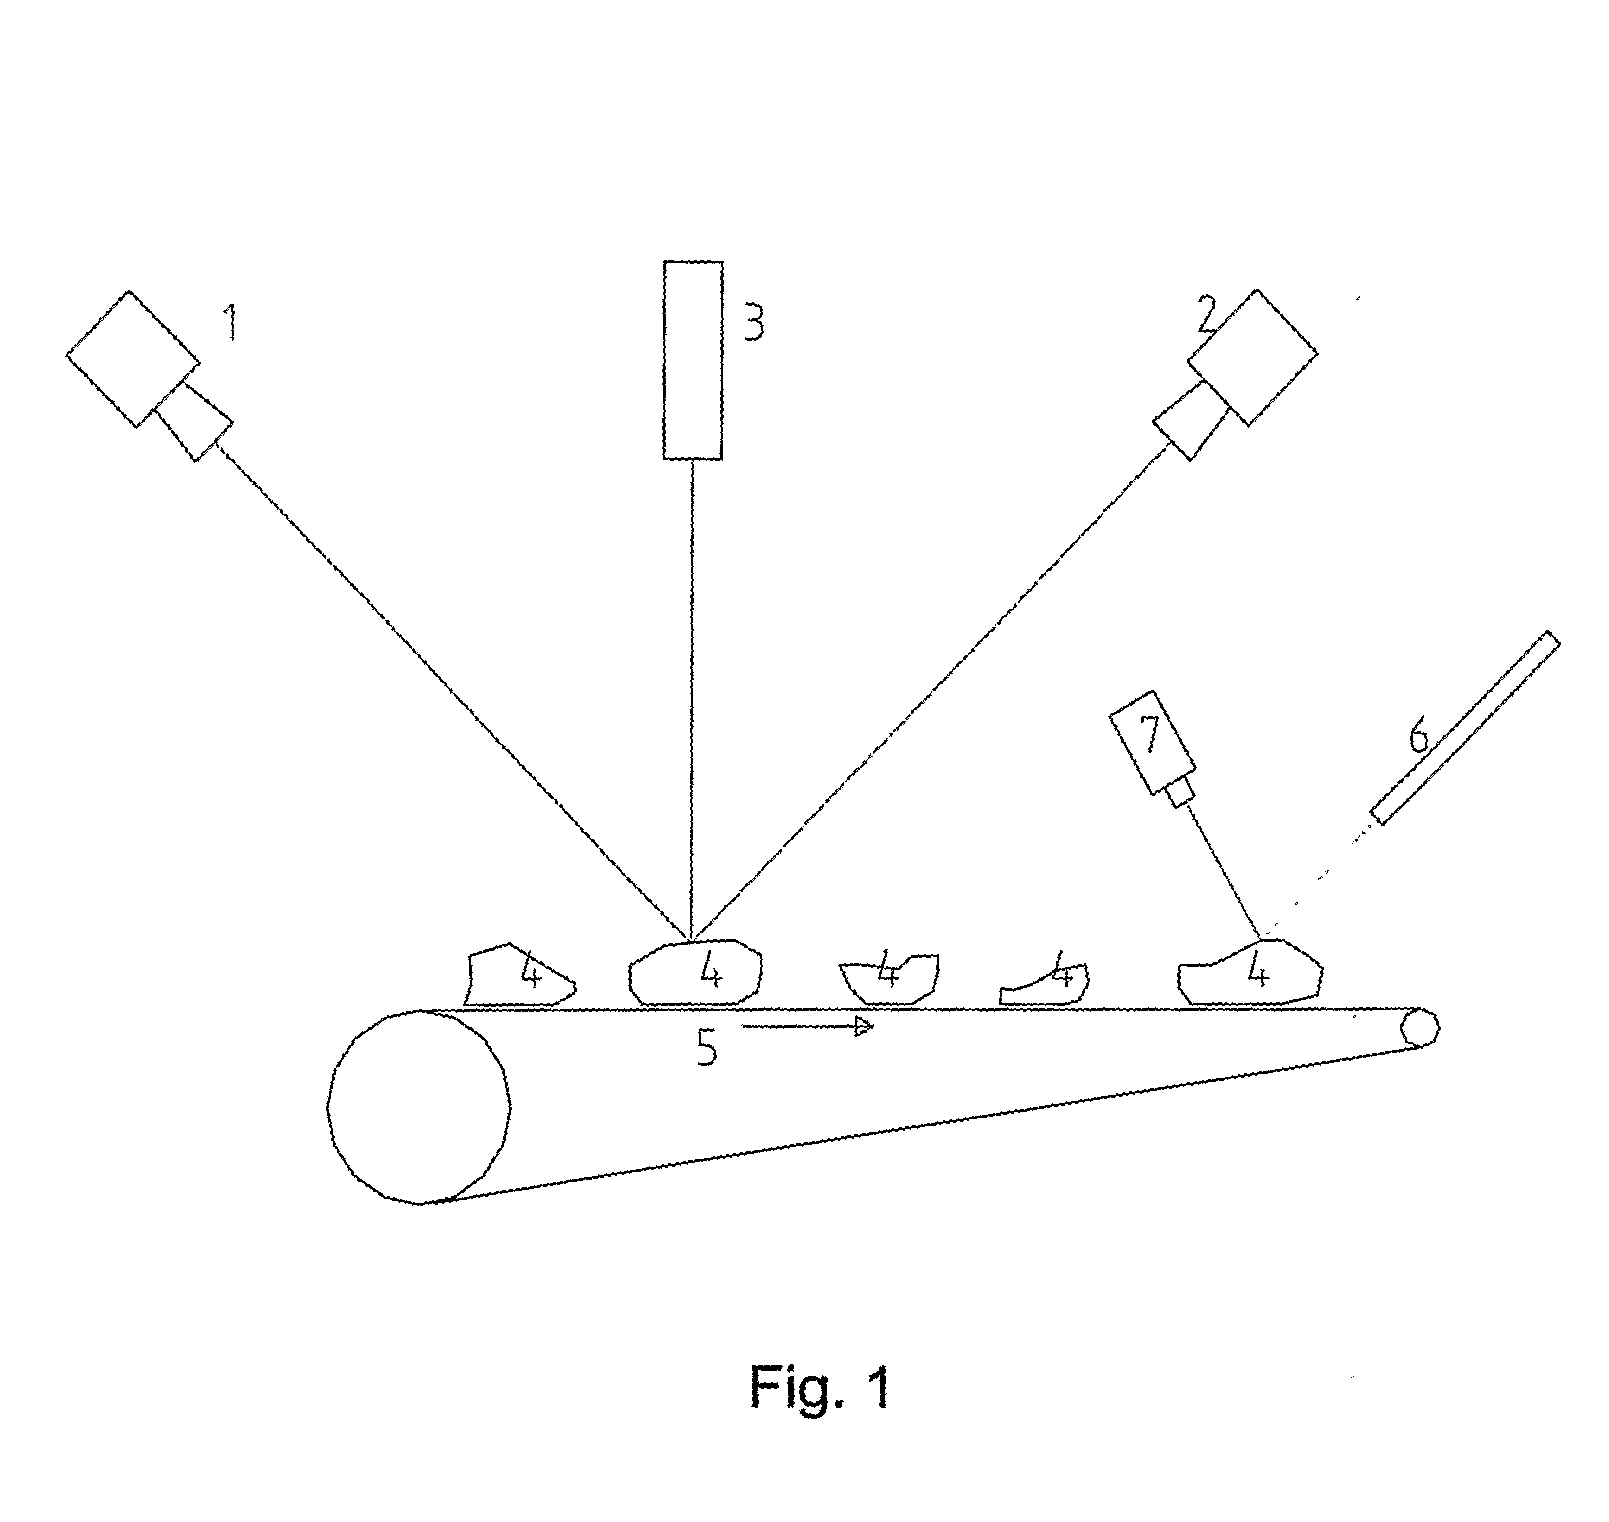
[0111]In short the method works as follows: It starts by locating the sample in a two-dimensional image taken by a digital camera (e.g. CCD or CMOS type industrial camera) located above the object (e.g. after the laser light and camera assembly used for the angularity assessment) and selecting a part from its middle, in order to evade background and shadows. The picture is then converted into a grayscale image and the number of graytones reduced to between 2 and 25. Experiments were made with different numbers of colors and this interval, 2-25, seemed to give good results, and seemingly the best results were in the interval 4-8.

[0112]After the reduction of colors, eac...


PUM


Abstract

Equipment and process for three-dimensional measurement of size and shape and for compositional analysis of mineral and rock particles and the like objects. A mixture of particles or objects of same or different sizes of minerals or rocks or the like are fed individually and automatically onto a conveyor belt for three-dimensional machine vision measurements using laser and two cameras and subsequently for spectroscopic measurements using visible and infrared light and are then collected at the end of the conveyor. Computer software is used to perform the measurement automatically and to calculate size, form, roundness, and preferably petrographic composition and other characteristics or properties of each individual object and the statistical distribution of relevant properties, either according to built-in measurement processes or user specific methods.

Description

FIELD OF INVENTION[0001]The invention relates generally to equipment and methods for analysis of mineral and rock particles and specifically a novel apparatus and methods for automatic analysis of such particles based on optical and spectrophotometric methods for determining size and shape, including form and angularity, and composition of mineral and rock particles and classifying particles according to size, shape and petrographic type.TECHNICAL BACKGROUND[0002]Classical, manual and mechanical methods of size analysis, petrological description and other analysis of rock and mineral particles are well-established and routinely used by the construction aggregates industries for quality control and for assessment of e.g. road aggregates and concrete aggregates. However, the traditional methods often require highly trained specialists and yet it is difficult to obtain reproducible results and they are tedious, time consuming and expensive.[0003]Methods and equipment have been describe...

Claims


Application Information

Patent Timeline
IPC IPC(8): G06K9/00
CPCG01N33/24
Inventor HELGASON, THORGEIRLEE, JASONSMITH, MELVYN L.MOELLER, AGNAR THOMASTHORGEIRSSON, TRYGGVIHOFER, VERAPILZ, JUERGENBENEDIKTSSON, JON ATLI
Owner PETROMODEL EHF
Why Eureka
Try Eureka