
Data visualization application

a data visualization and application technology, applied in the field of data analysis methods and systems, can solve the problems of inability to provide on-demand flexible access, inability to use any single data type, and significant bottlenecks in information systems,

Inactive Publication Date: 2008-11-20
INFORMATION RESOURCES
View PDF29 Cites 457 Cited by
  • Summary
  • Abstract
  • Description
  • Claims
  • Application Information

AI Technical Summary

Benefits of technology

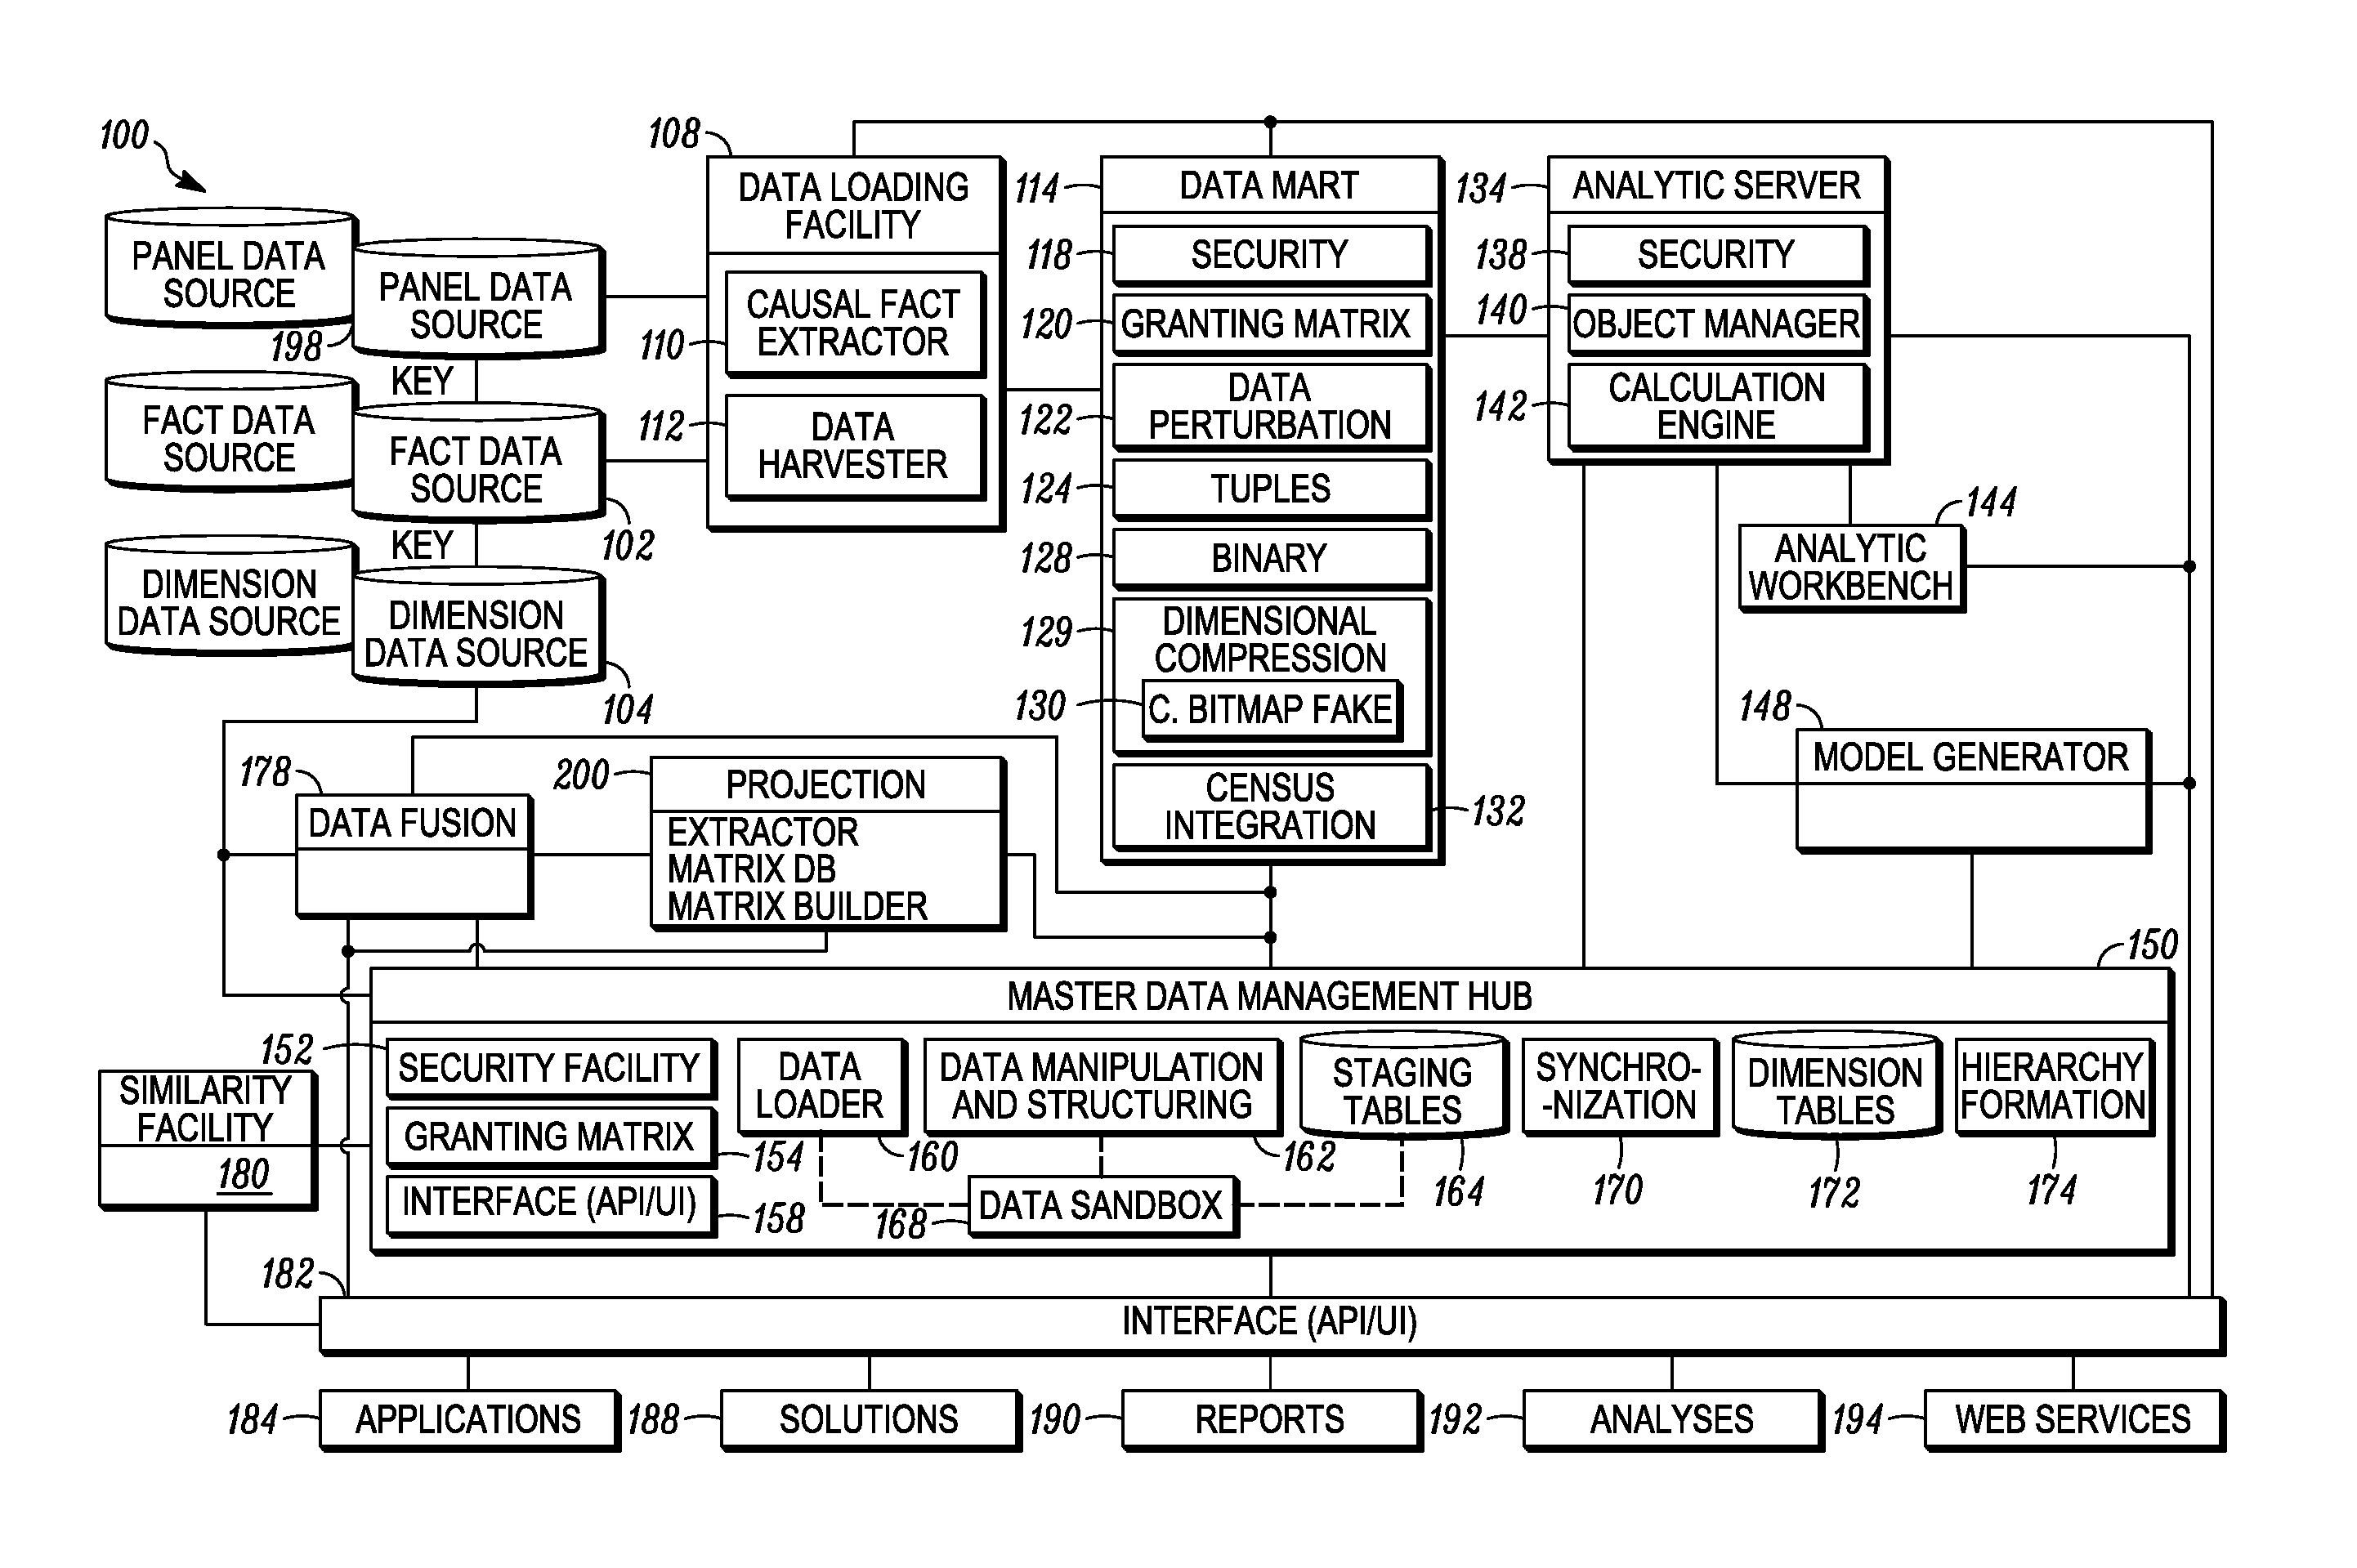
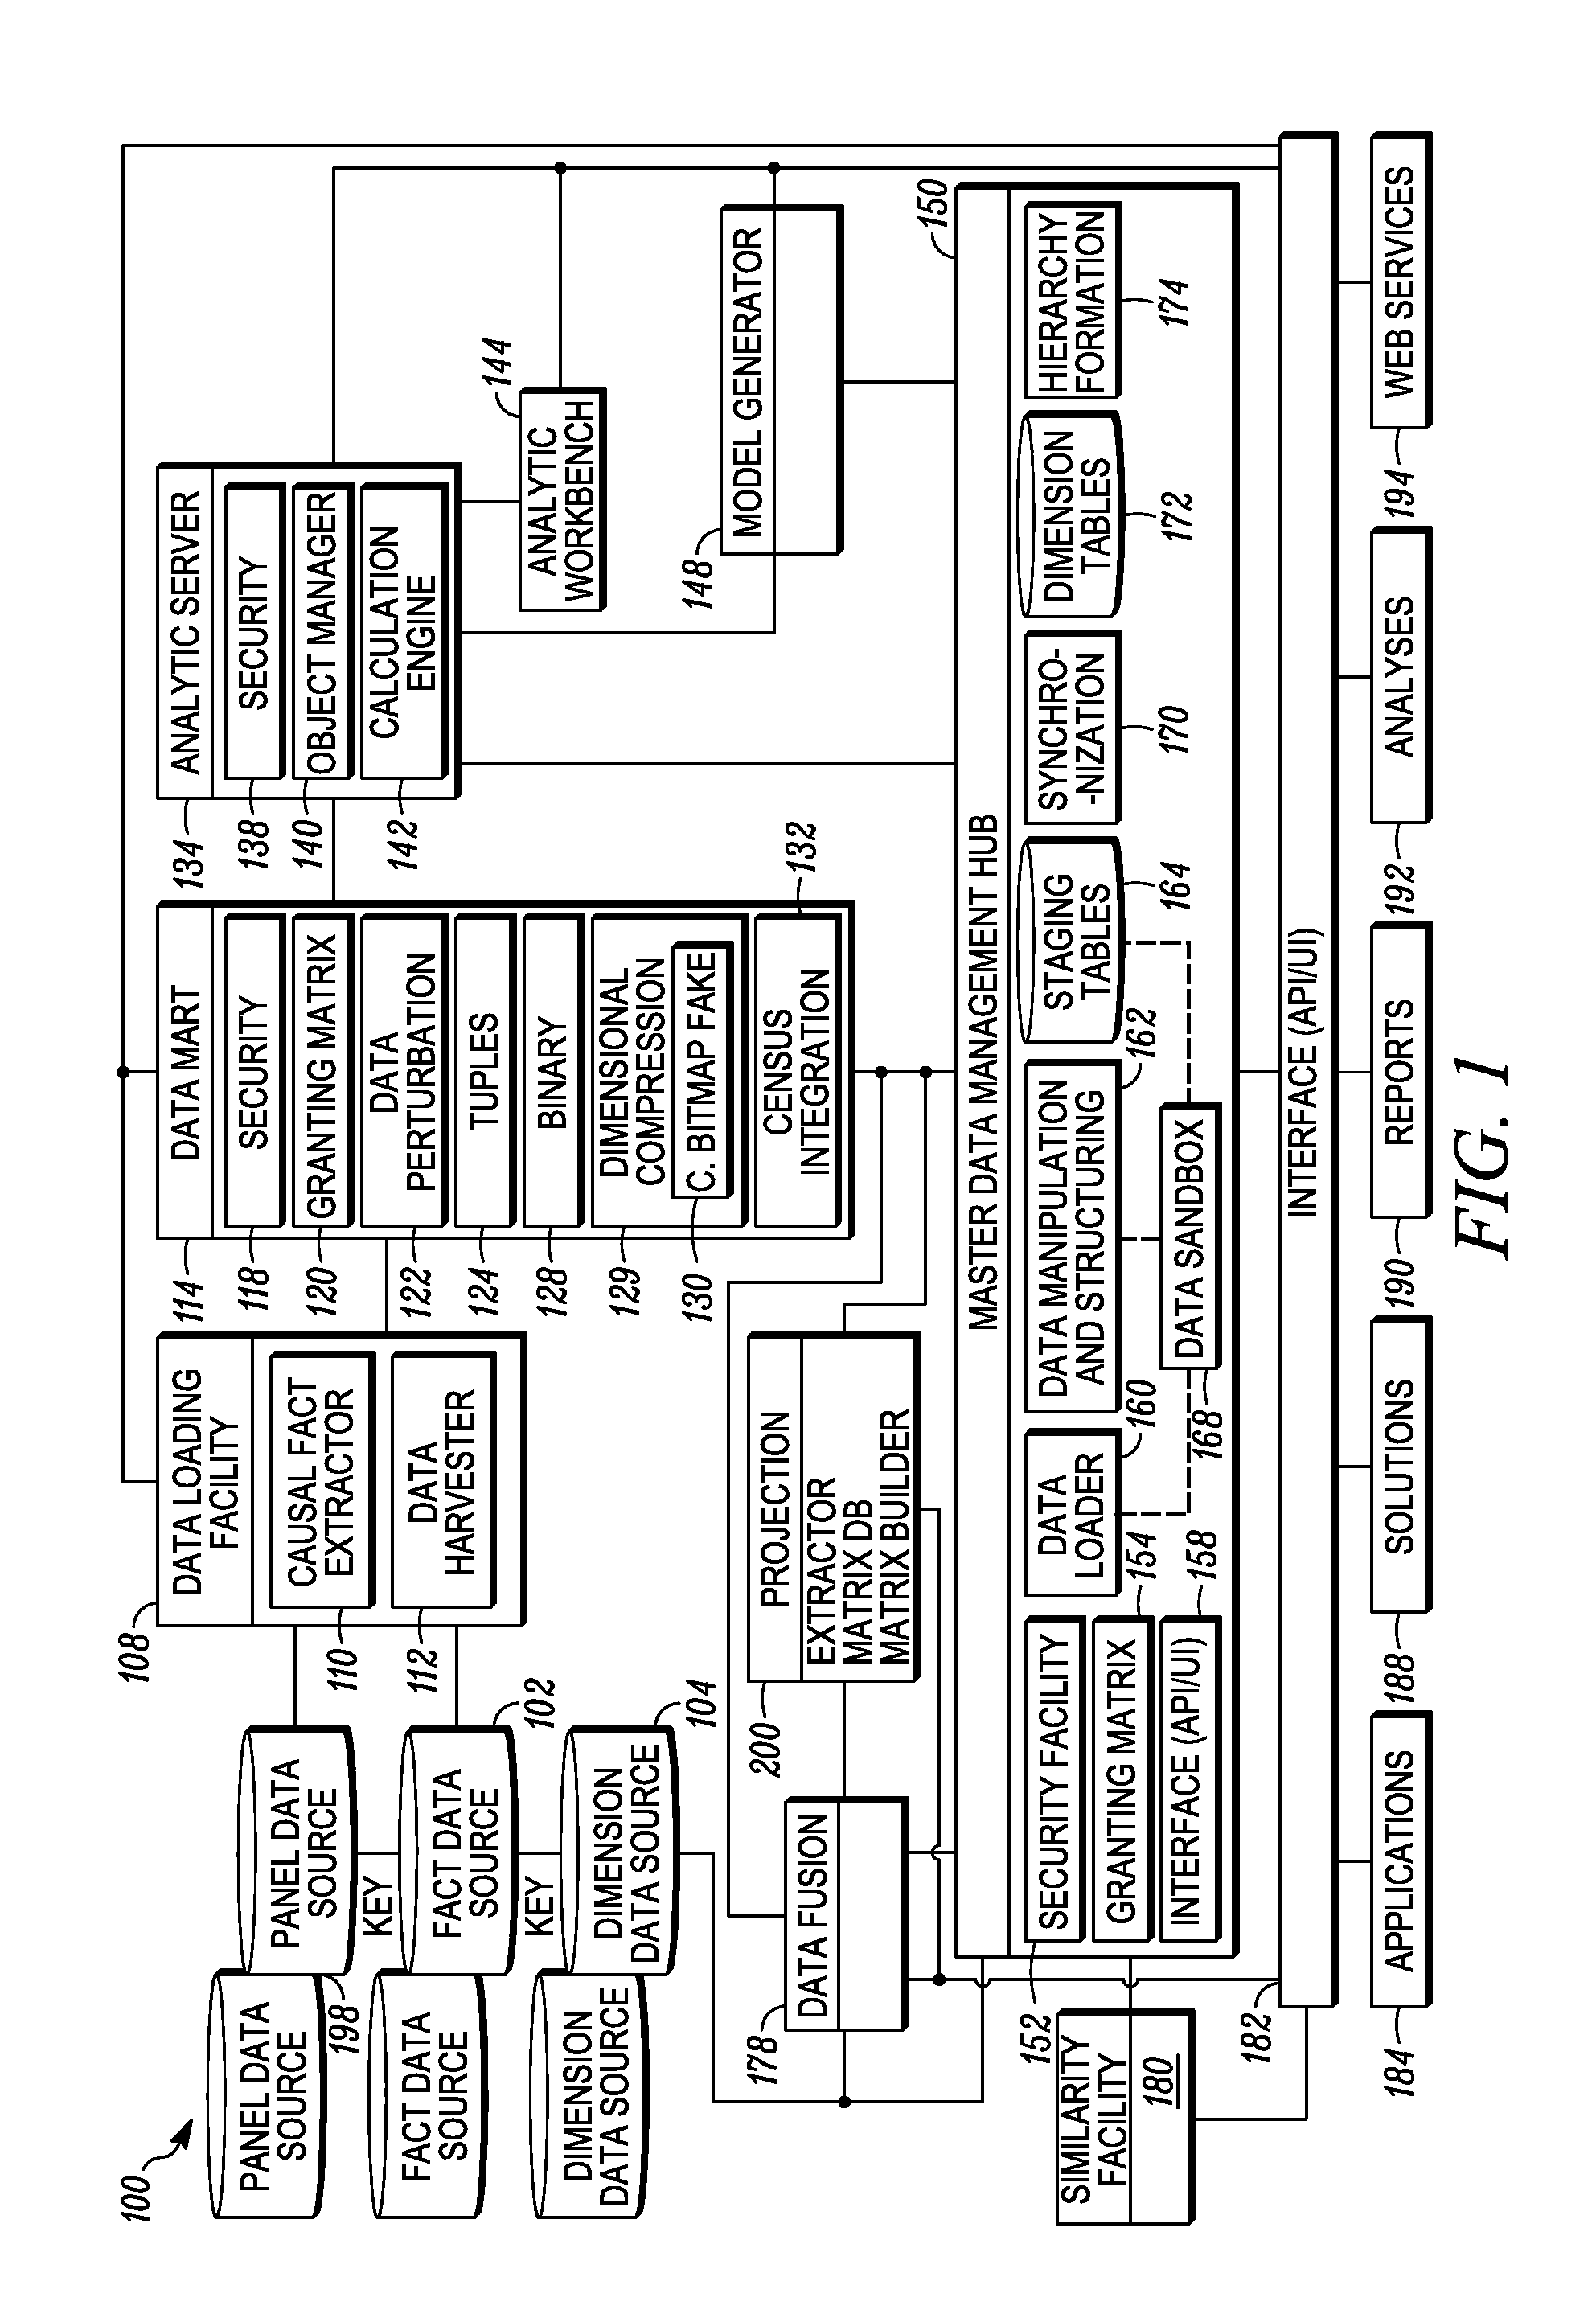
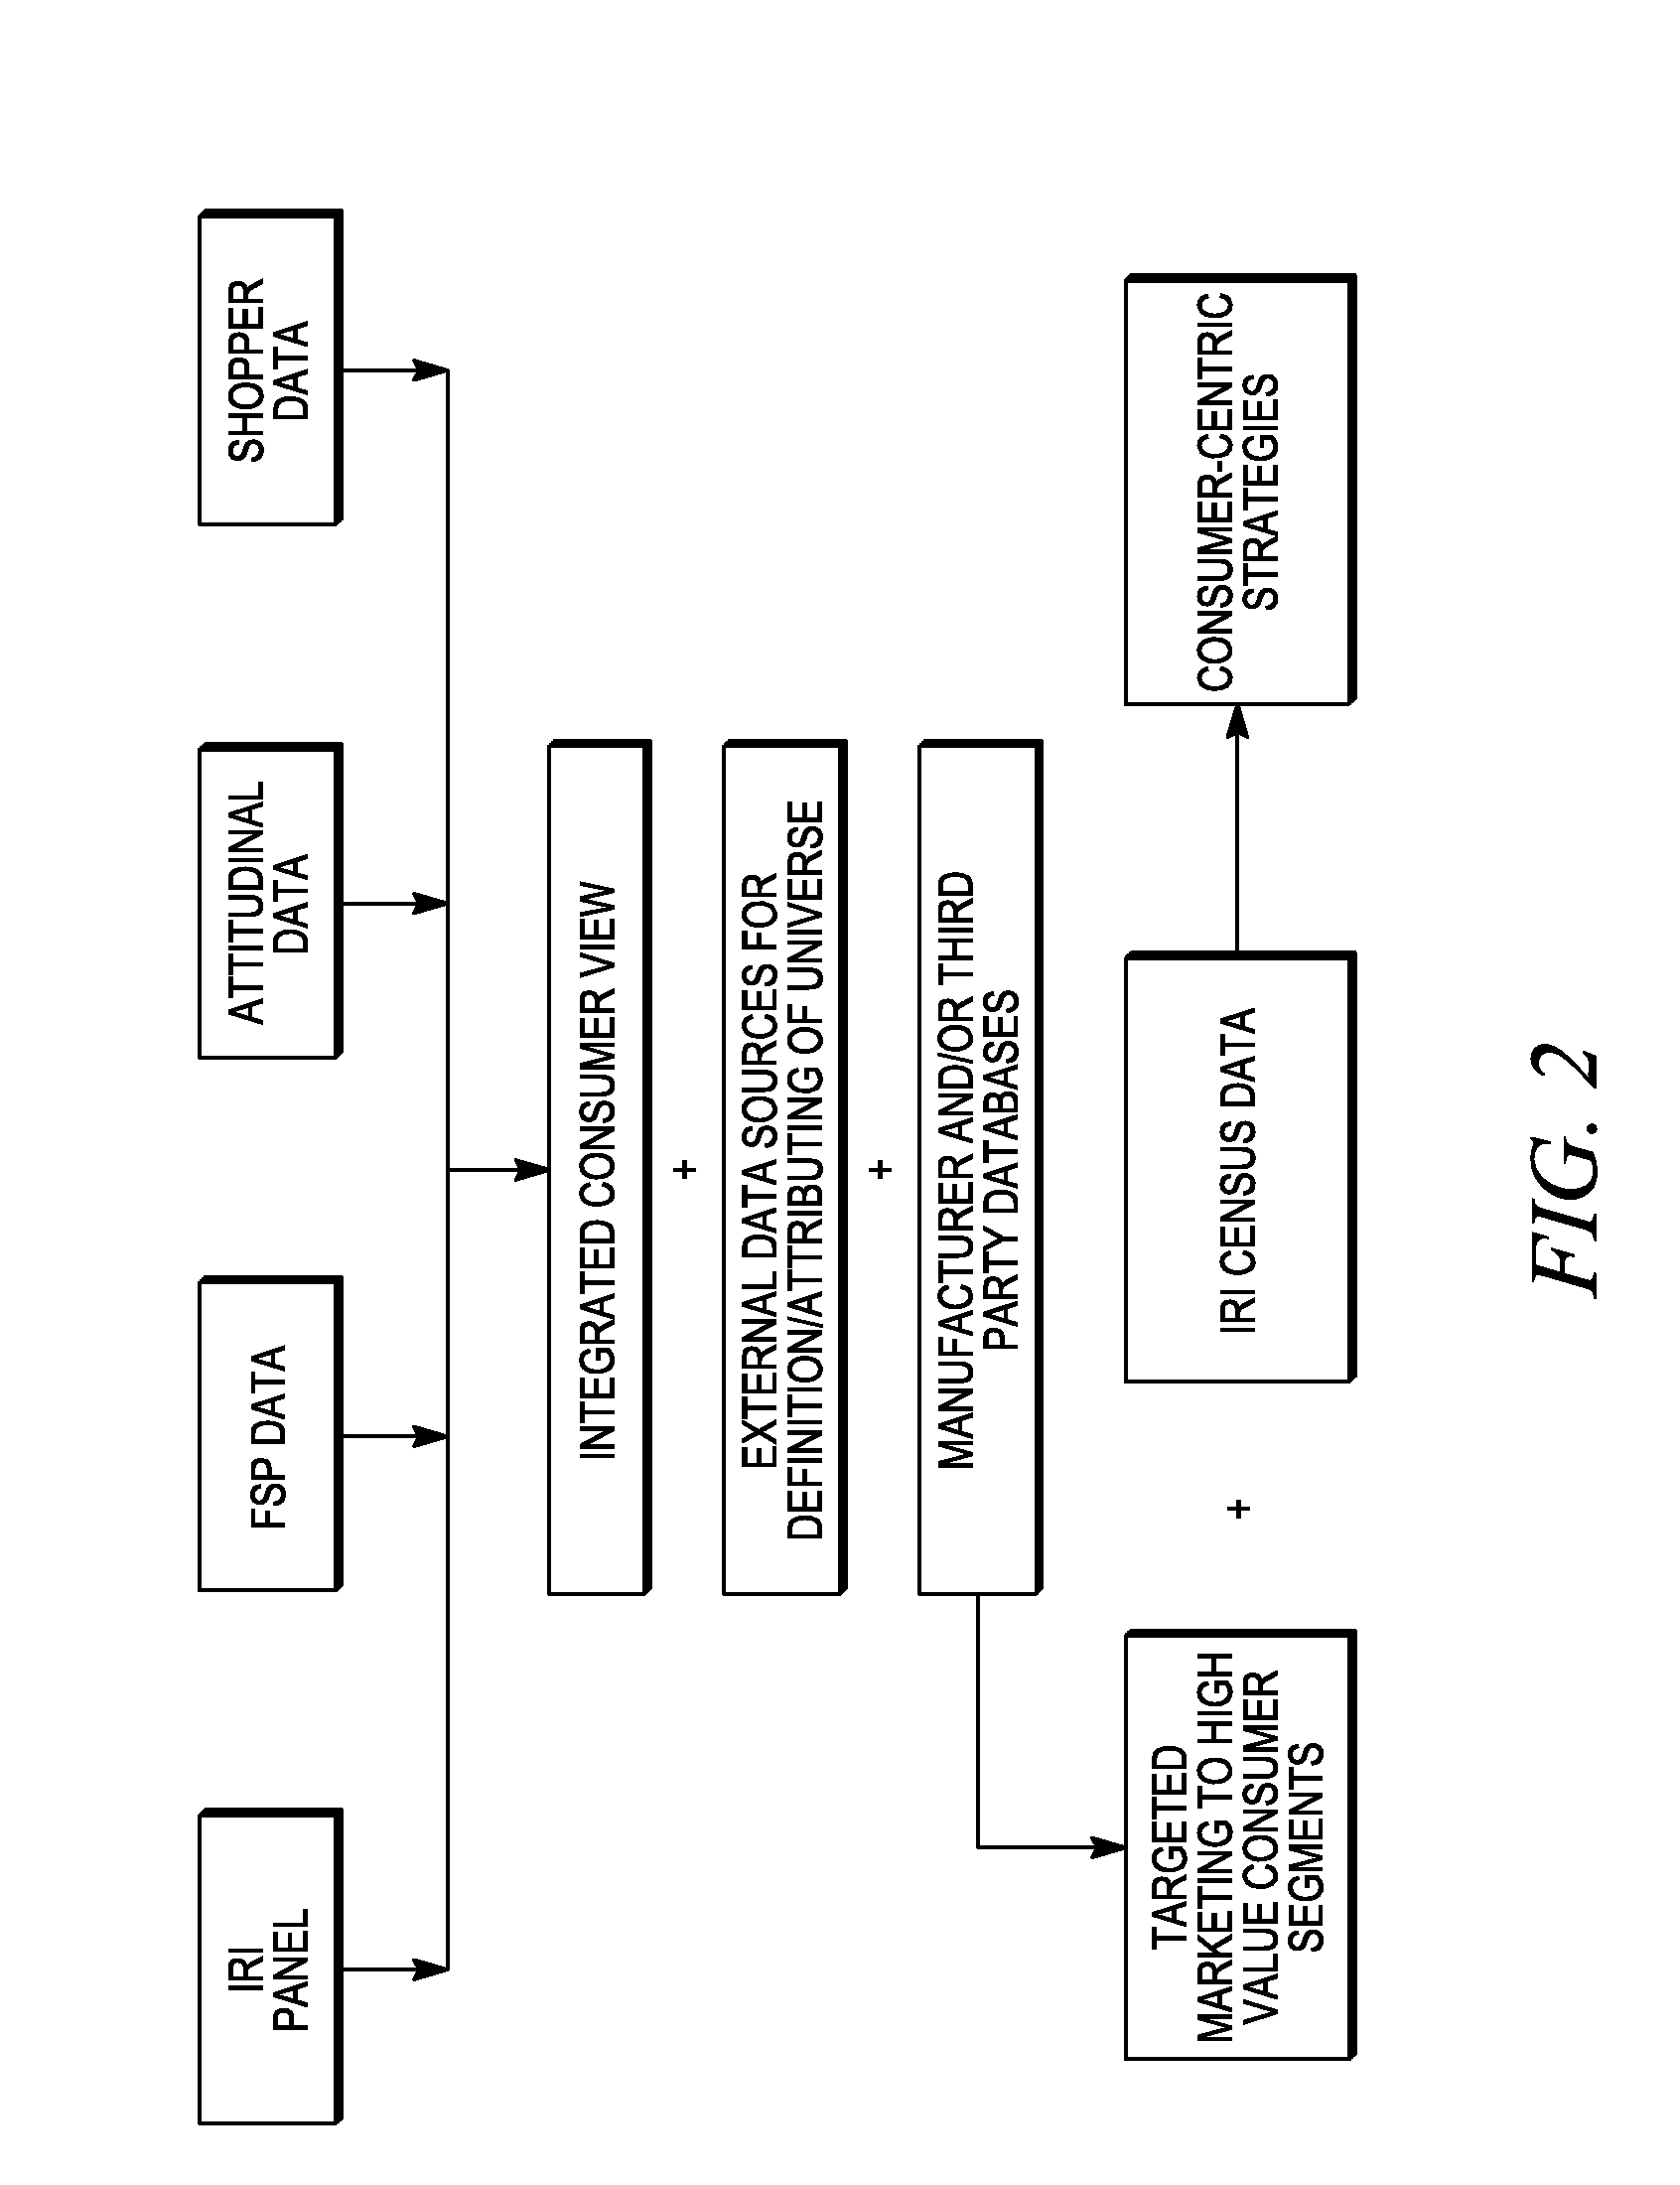
"The patent describes an analytic platform that can take data from various sources and create an integrated view of consumers, their behavior, and the sales of products. This platform can use non-unique values to create unique data measures for analysis. It can also identify and aggregate data from multiple sources and dimensions, allowing for more accurate analysis. The platform can also provide a way to compare data from different sources and update an analytic data set based on the data's availability. Overall, the platform provides a flexible and effective tool for analyzing data and visualizing it for various purposes."

Problems solved by technology

While each data type may provide an opportunity to analyze a particular aspect of consumer behavior, the utility of any single data type has inherent limitations.
Information systems are a significant bottle neck for market analysis activities.
The architecture of information systems is often not designed to provide on-demand flexible access, integration at a very granular level, or many other critical capabilities necessary to support growth.
Thus, information systems are counter-productive to growth.
Hundreds of market and consumer databases make it very difficult to manage or integrate data.
Restatements of data hierarchies waste precious time and are very expensive.
Navigation from among views of data, such as from global views to regional to neighborhood to store views is virtually impossible, because there are different hierarchies used to store data from global to region to neighborhood to store-level data.
Analyses and insights often take weeks or months, or they are never produced.
Currently, market analysis, business intelligence, and the like often use rigid data cubes that may include hundreds of databases that are impossible to integrate.
This may make it almost impossible to navigate from global uses that are used, for example, to develop overall company strategy, down to specific program implementation or customer-driven uses.
These ad hoc analytic tools and infrastructure are fragmented and disconnected.

Method used


Image

  • Data visualization application
  • Data visualization application
  • Data visualization application

Examples


example 1

[0993]If a household has just one member with condition that treats with Rx only then the attribute may be set as follows.

[0994]‘HHs suffering from ______’=‘Yes’,

[0995]‘______ suffers treating with Rx only’=‘Yes’

[0996]‘______ suffers treating with OTC only’=‘No’

[0997]‘______ suffers treating with Rx and OTC=‘No’

example 2

[0998]If a household has two members with the condition one treats with Rx only and one member treats with OTC only.

[0999]‘HHs suffering from ______’=‘Yes’,

[1000]‘______ suffers treating with Rx only’=‘Yes’

[1001]‘______ suffers treating with OTC only’=‘Yes’

[1002]‘______ suffers treating with Rx and OTC=‘No’

example 3

[1003]If a household has one member with condition that marked on the survey ‘Rx and OTC’ for the health condition.

[1004]‘HHs suffering from ______’=‘Yes’,

[1005]‘______ suffers treating with Rx only’=‘No’

[1006]‘______ suffers treating with OTC only’=‘No’

[1007]‘______ suffers treating with Rx and OTC=‘Yes’

[1008]Other Attributes:

[1009]Attribute: ‘I try to eat whole grains’: Attribute value (‘Yes’, ‘No’) If any one in household marked ‘agree’ on survey this may be set to ‘Yes’.

[1010]Attribute: ‘Concern about trans fatty acids’: Attribute value (‘Yes’, ‘No’) If any one in household marked ‘very’ or ‘somewhat’ on survey this may be set to ‘Yes’ for the household.

[1011]Attribute: ‘Concern with refined or processed foods’: Attribute value (‘Yes’, ‘No’) If any one in household marked ‘very’ or ‘somewhat’ on survey this may be set to ‘Yes’ for the household.

[1012]Wellness Segment Data attributes include:

[1013]Attribute: Proactive Managers: Attribute value (‘Yes’, ‘No’)

[1014]Attribute: Unconc...


PUM


Abstract

The methods and systems disclosed herein include an analytic platform, with a data visualization application, that may be used to perform data fusion methodologies in order to create an integrated, actionable view of consumers, consumer behavior, commodity sales, and other commercial activities, such as the relationship between consumers and stores.

Description

CROSS-REFERENCE TO RELATED APPLICATIONS[0001]This application claims the benefit of the following provisional applications, each of which is hereby incorporated by reference in its entirety: App. No. 60 / 886,798 filed on Jan. 26, 2007 and entitled “A Method of Aggregating Data,” App. No. 60 / 886,801 filed on Jan. 26, 2007 and entitled “Utilizing Aggregated Data,” App. No. 60 / 887,122 filed on Jan. 29, 2007 and entitled “Data Fusion Methods,” App. No. 60 / 891,507 filed on Feb. 24, 2007 and entitled “Data Fusion Methods,” App. No. 60 / 891,933 filed on Feb. 27, 2007 and entitled “Data Fusion Methods,” App. No. 60 / 979,305 filed on Oct. 11, 2007 entitled “Data Fusion Methods.”[0002]This application is a continuation-in-part of the following U.S. patent application, which is incorporated by reference in its entirety: application Ser. No. 10 / 783,323 filed on Feb. 20, 2004 and entitled “System and Method for Analyzing and Correcting Retail Data.”BACKGROUND[0003]1. Field[0004]This invention relat...

Claims


Application Information

Patent Timeline
Patent Type & Authority Applications(United States)
IPC IPC(8): G06F17/30G06F3/048
CPCG06Q30/02
Inventor HUNT, HERBERT DENNISWEST, JOHN RANDALLGIBBS, MARSHALL ASHBYGRIGLIONE, BRADLEY MICHAELHUDSON, GREGORY DAVID NEILBASILICO, ANDREAJOHNSON, ARVID C.BERGEON, CHERYL G.CHAPA, CRAIG JOSEPHAGOSTINELLI, ALBERTOYUSKO, JAY ALANMASON, TREVOR
Owner INFORMATION RESOURCES
Learn More