

Load independent index of diastolic function
a diastolic function and load-dependent technology, applied in the field of medical methods and devices, can solve the problems of complex analysis of pressure-volume data from the heart, clinically relevant doppler-derived df indices, and difficult analytical tasks for cardiac surgeons examining heart function
- Summary
- Abstract
- Description
- Claims
- Application Information
AI Technical Summary
Benefits of technology
Problems solved by technology
Method used
Image

Examples
example 1
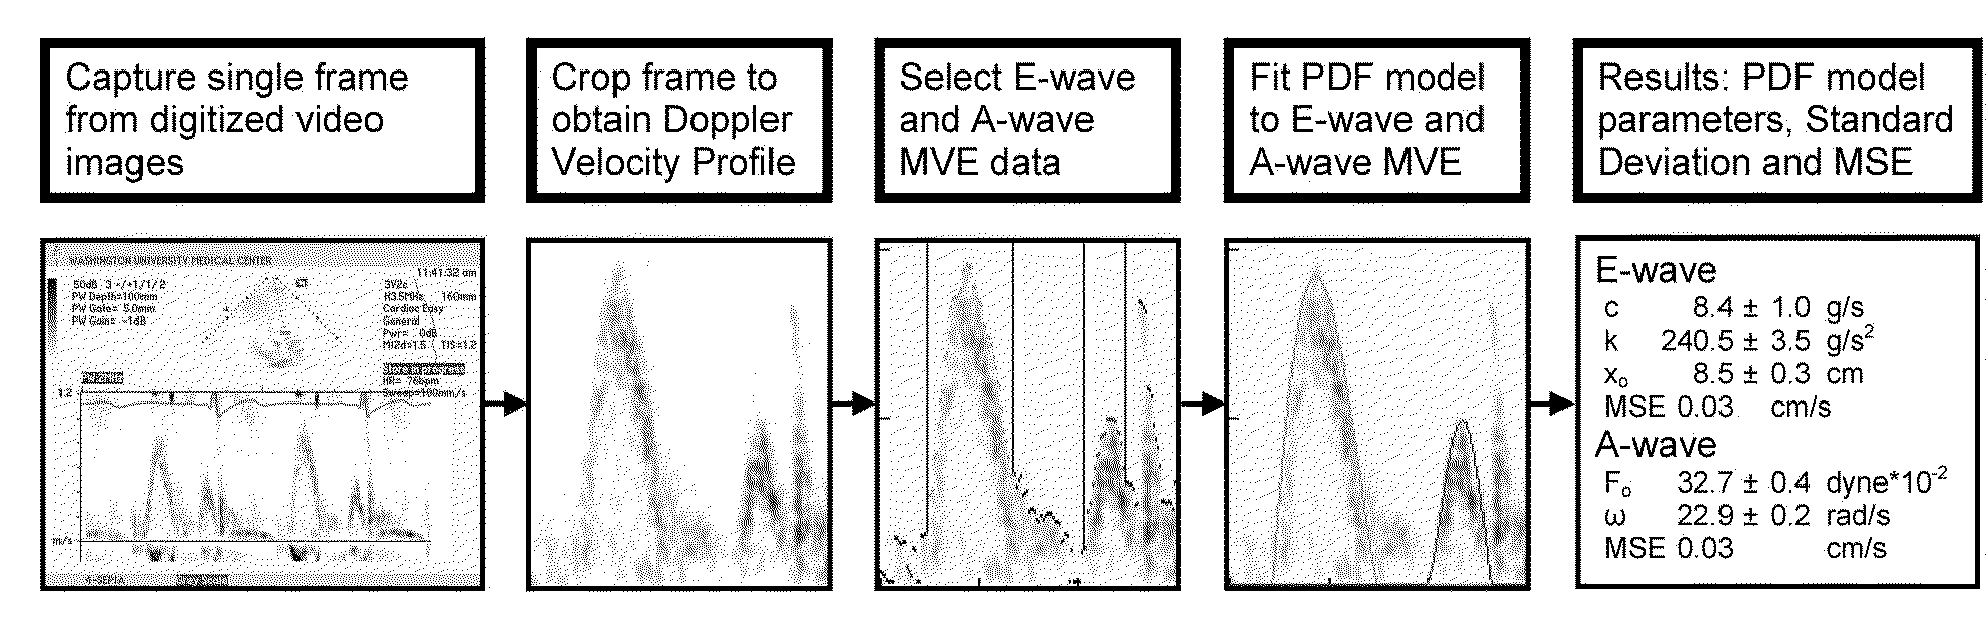
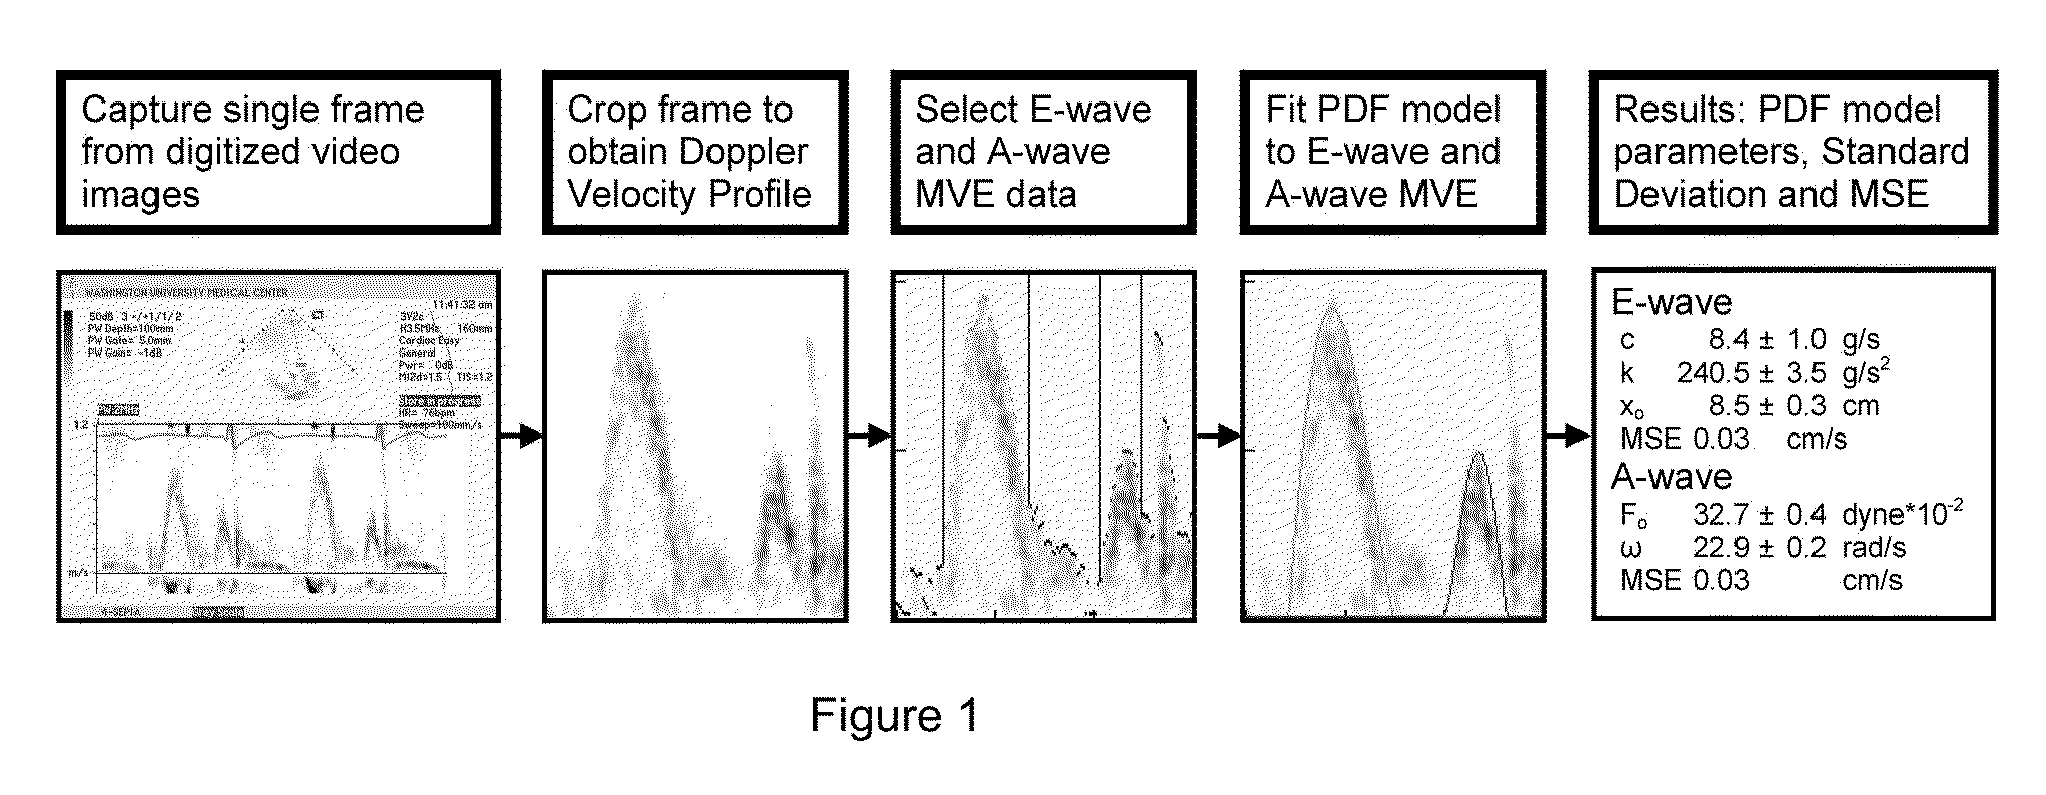
[0072]Pulsed Doppler echocardiography in accordance with ASE (American Society of Echocardiography) criteria (CP Appleton, “Doppler evaluation of left and right ventricular diastolic function: a technical guide for obtaining optimal flow velocity recordings.”J Am Soc Echocardiogr 10: 271-291, 1997) was used to acquire continuous transmitral blood flow data from 15 subjects (ages 20-30) while the subjects were positioned on a tilt-table at a variety of tilt angles. The subjects were normal healthy volunteers, on no prescribed medications, with no history of heart disease. Prior to participation in the study, all subjects gave informed consent in accordance with the Washington University Medical College Human Studies Committee guidelines.
[0073]Doppler data was obtained with a clinical echocardiographic imaging system (Acuson Sequia 256, Mountain View, Calif.) equipped with a 2 MHz transducer. Transmitral E- and A-waves were recorded using the 4-chamber view with the transducer positio...
example 2
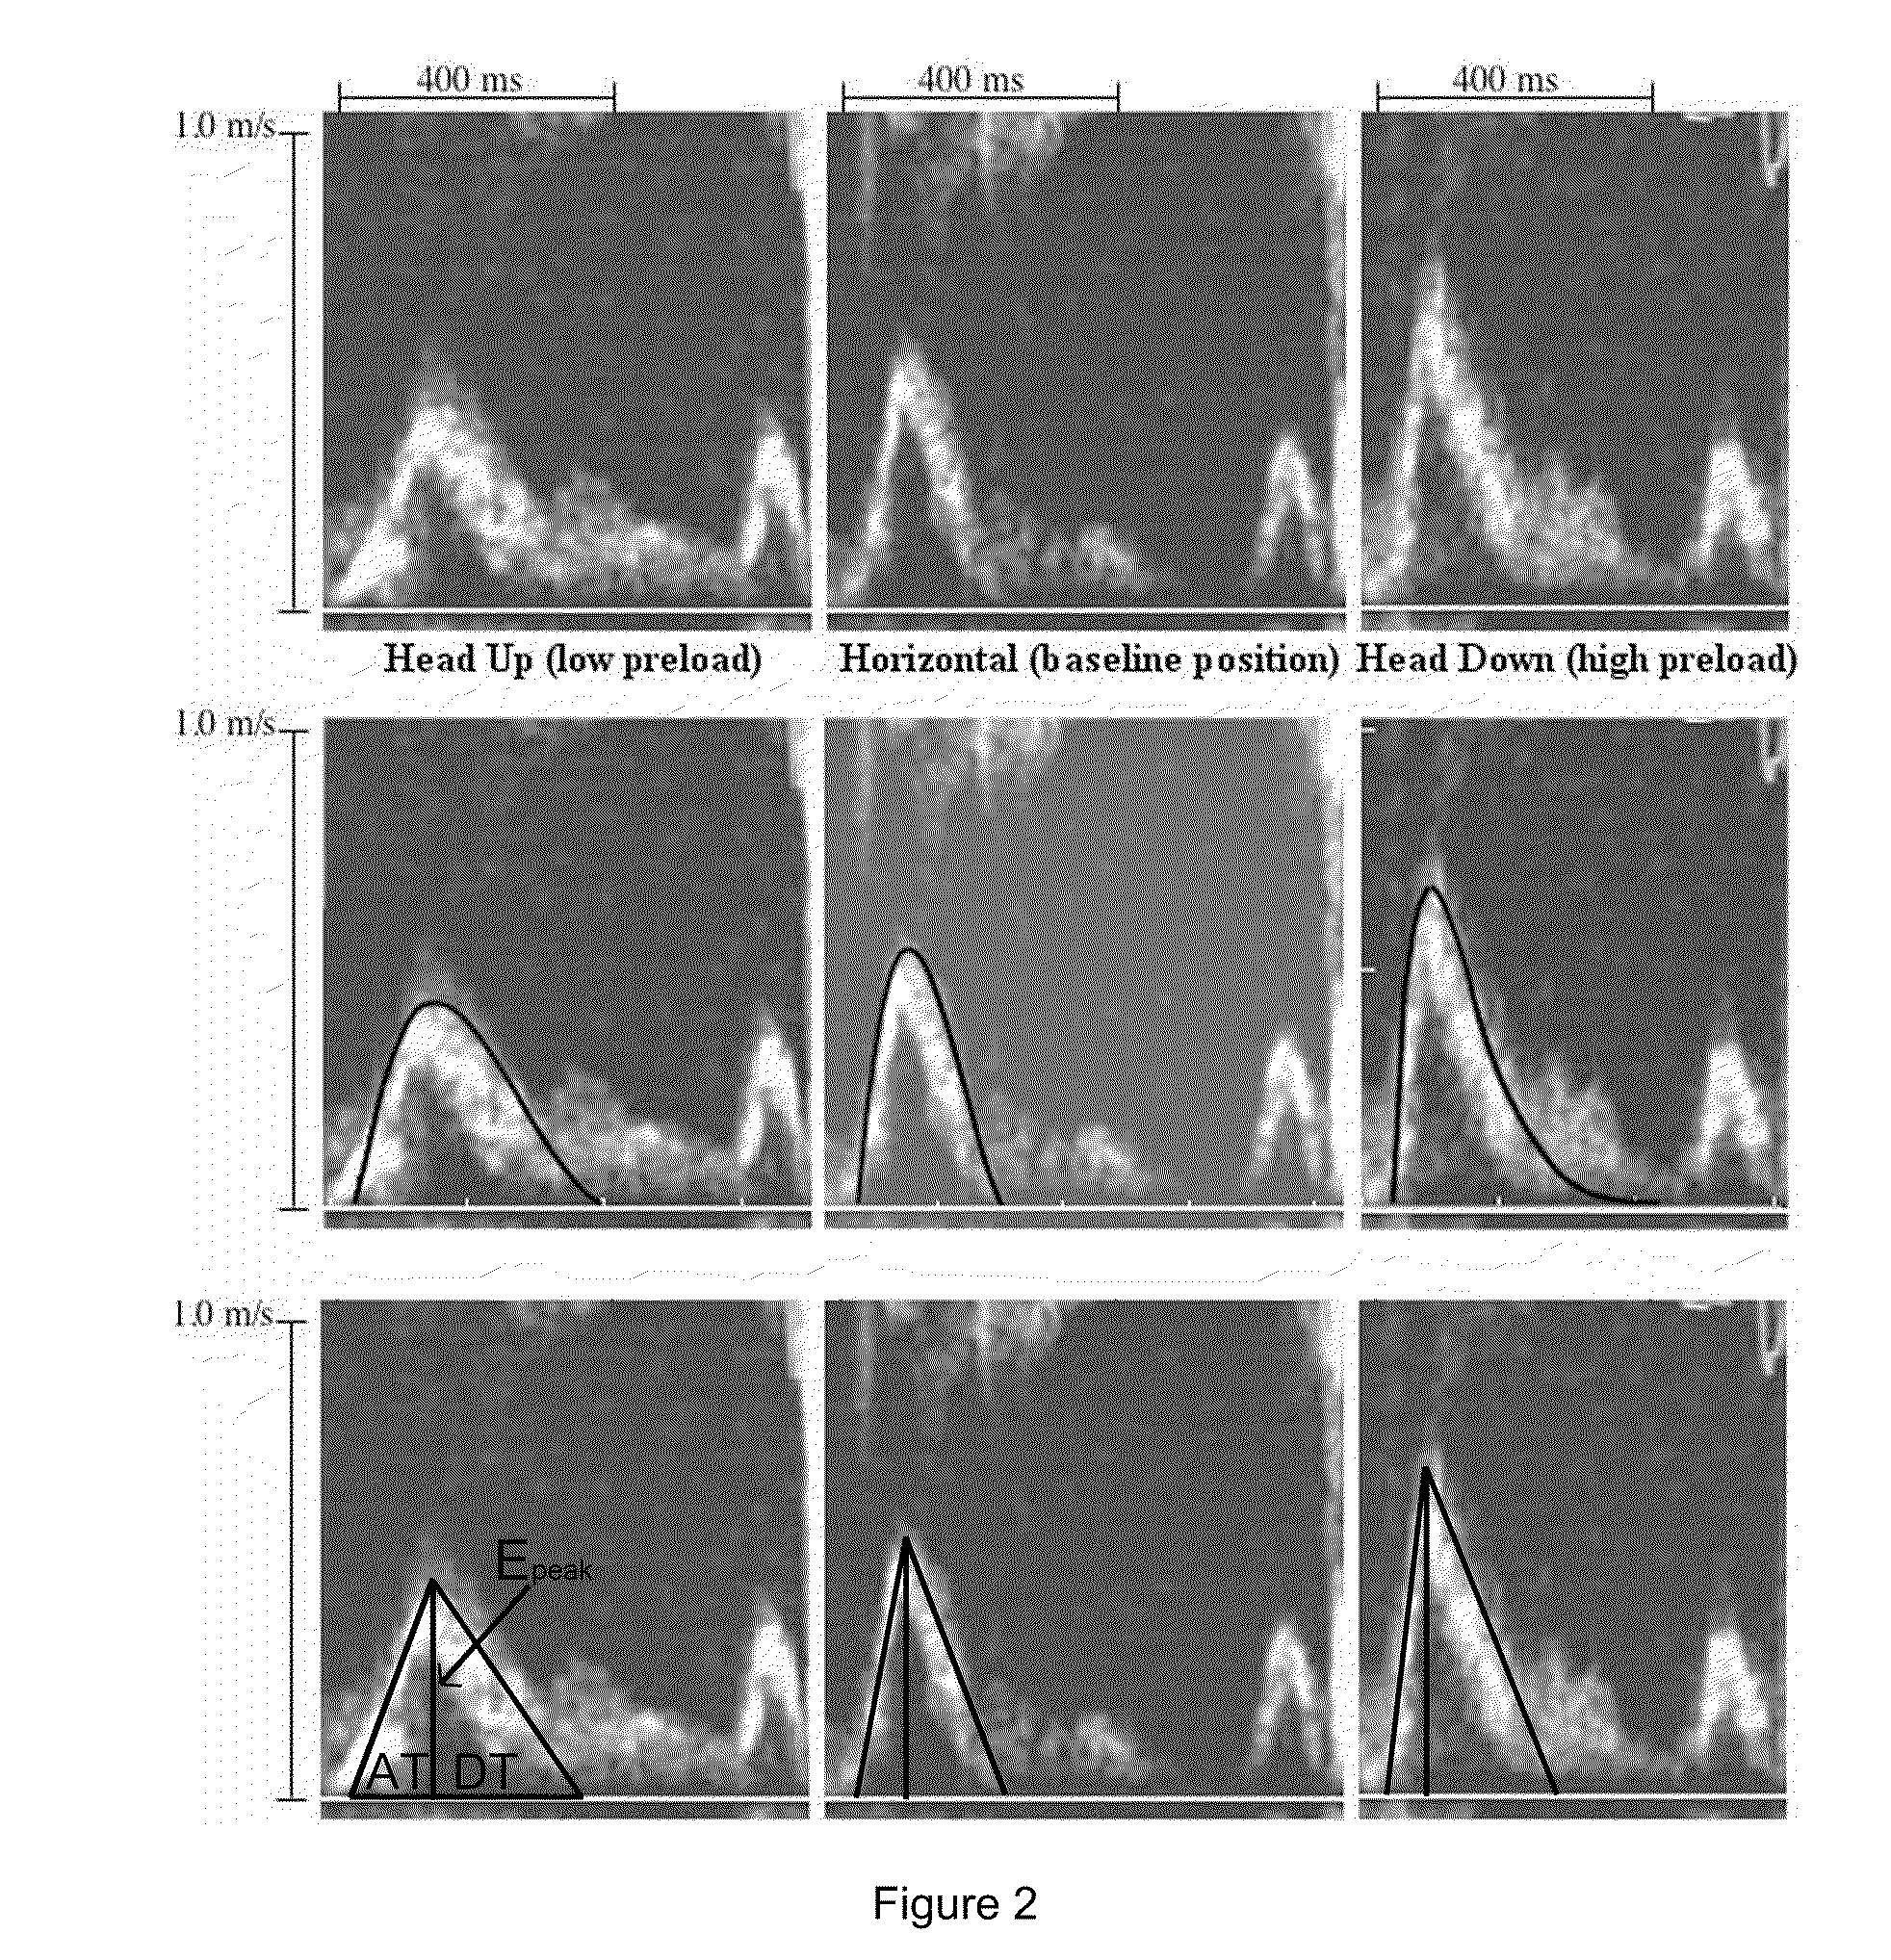
Variation of E-Wave Shape with Tilt Table Position
[0079]In agreement with other studies (see, e.g. B. P. Paelinck et al. “Effects of postural changes on cardiac function in healthy subjects.”Er J Echocardiography 4: 196-201 (2003)), both E- and A-wave shapes varied in response to changes in load generated by changes in tilt table position. Since the PDF parameters are determined from the contour of the waves, changes in load result in changes in the PDF parameters. Table 2 summarizes the average values for both traditional Doppler indexes and PDF parameters under different load states i.e. tilt-table positions.
[0080]Since subjects had a distribution of values for Doppler indexes and PDF parameter values in the horizontal tilt-table position, determining an average over all subjects required reference to a common baseline. Horizontal was chosen as the baseline tilt table position and all values were calculated as percent change from horizontal. Table 3 presents both PDF and tradition...
example 3
Determination of Predicted Load Independence
[0081]In accordance with the prediction (equation [5]) that the maximum driving force must be linearly related to peak viscous (resistive) force, a linear regression via least mean square error of cEpeak to kxo was performed. FIG. 3a shows a representative maximum driving force (kxo) vs. peak resistive force (cEpeak) plot for one subject. Head-up data from two subjects was not included, but their head-down and horizontal data fit the maximum driving force (kxo) vs. peak resistive force (cEpeak) regression with high r2. Among all subjects, the average slope of the maximum driving force (kxo) vs. peak resistive force (cEpeak) plot was 1.27±0.09 and the average intercept was 5.69±1.70. The average r2 value for each subjects' linear regression was r2=0.95. The combined data from all subjects plotted together yielded a linear regression with r2=0.98 (FIG. 3b). The slope of the line, M, is a load-independent index of diastolic function.
[0082]FIG...
PUM
 Abstract
Description
Claims
Application Information