Systems and methods for analyzing persistent homeostatic perturbations
- Summary
- Abstract
- Description
- Claims
- Application Information
AI Technical Summary
Benefits of technology
Problems solved by technology
Method used
Image
Examples
example 1
Construction of a SR Biomarker Panel
[0237]This experiment provides an exemplary method for constructing a SR biomarker panel that is useful for a broad-based analysis of persistent homeostatic perturbations (i.e., “stress”). Although as described below, expression levels of SR biomarker proteins are exemplified, the same assay principles could easily be adapted to a nucleic acid-based assay to measure, for example, mRNA encoding these proteins, which one would expect to be up-regulated when the associated SR pathways were activated.
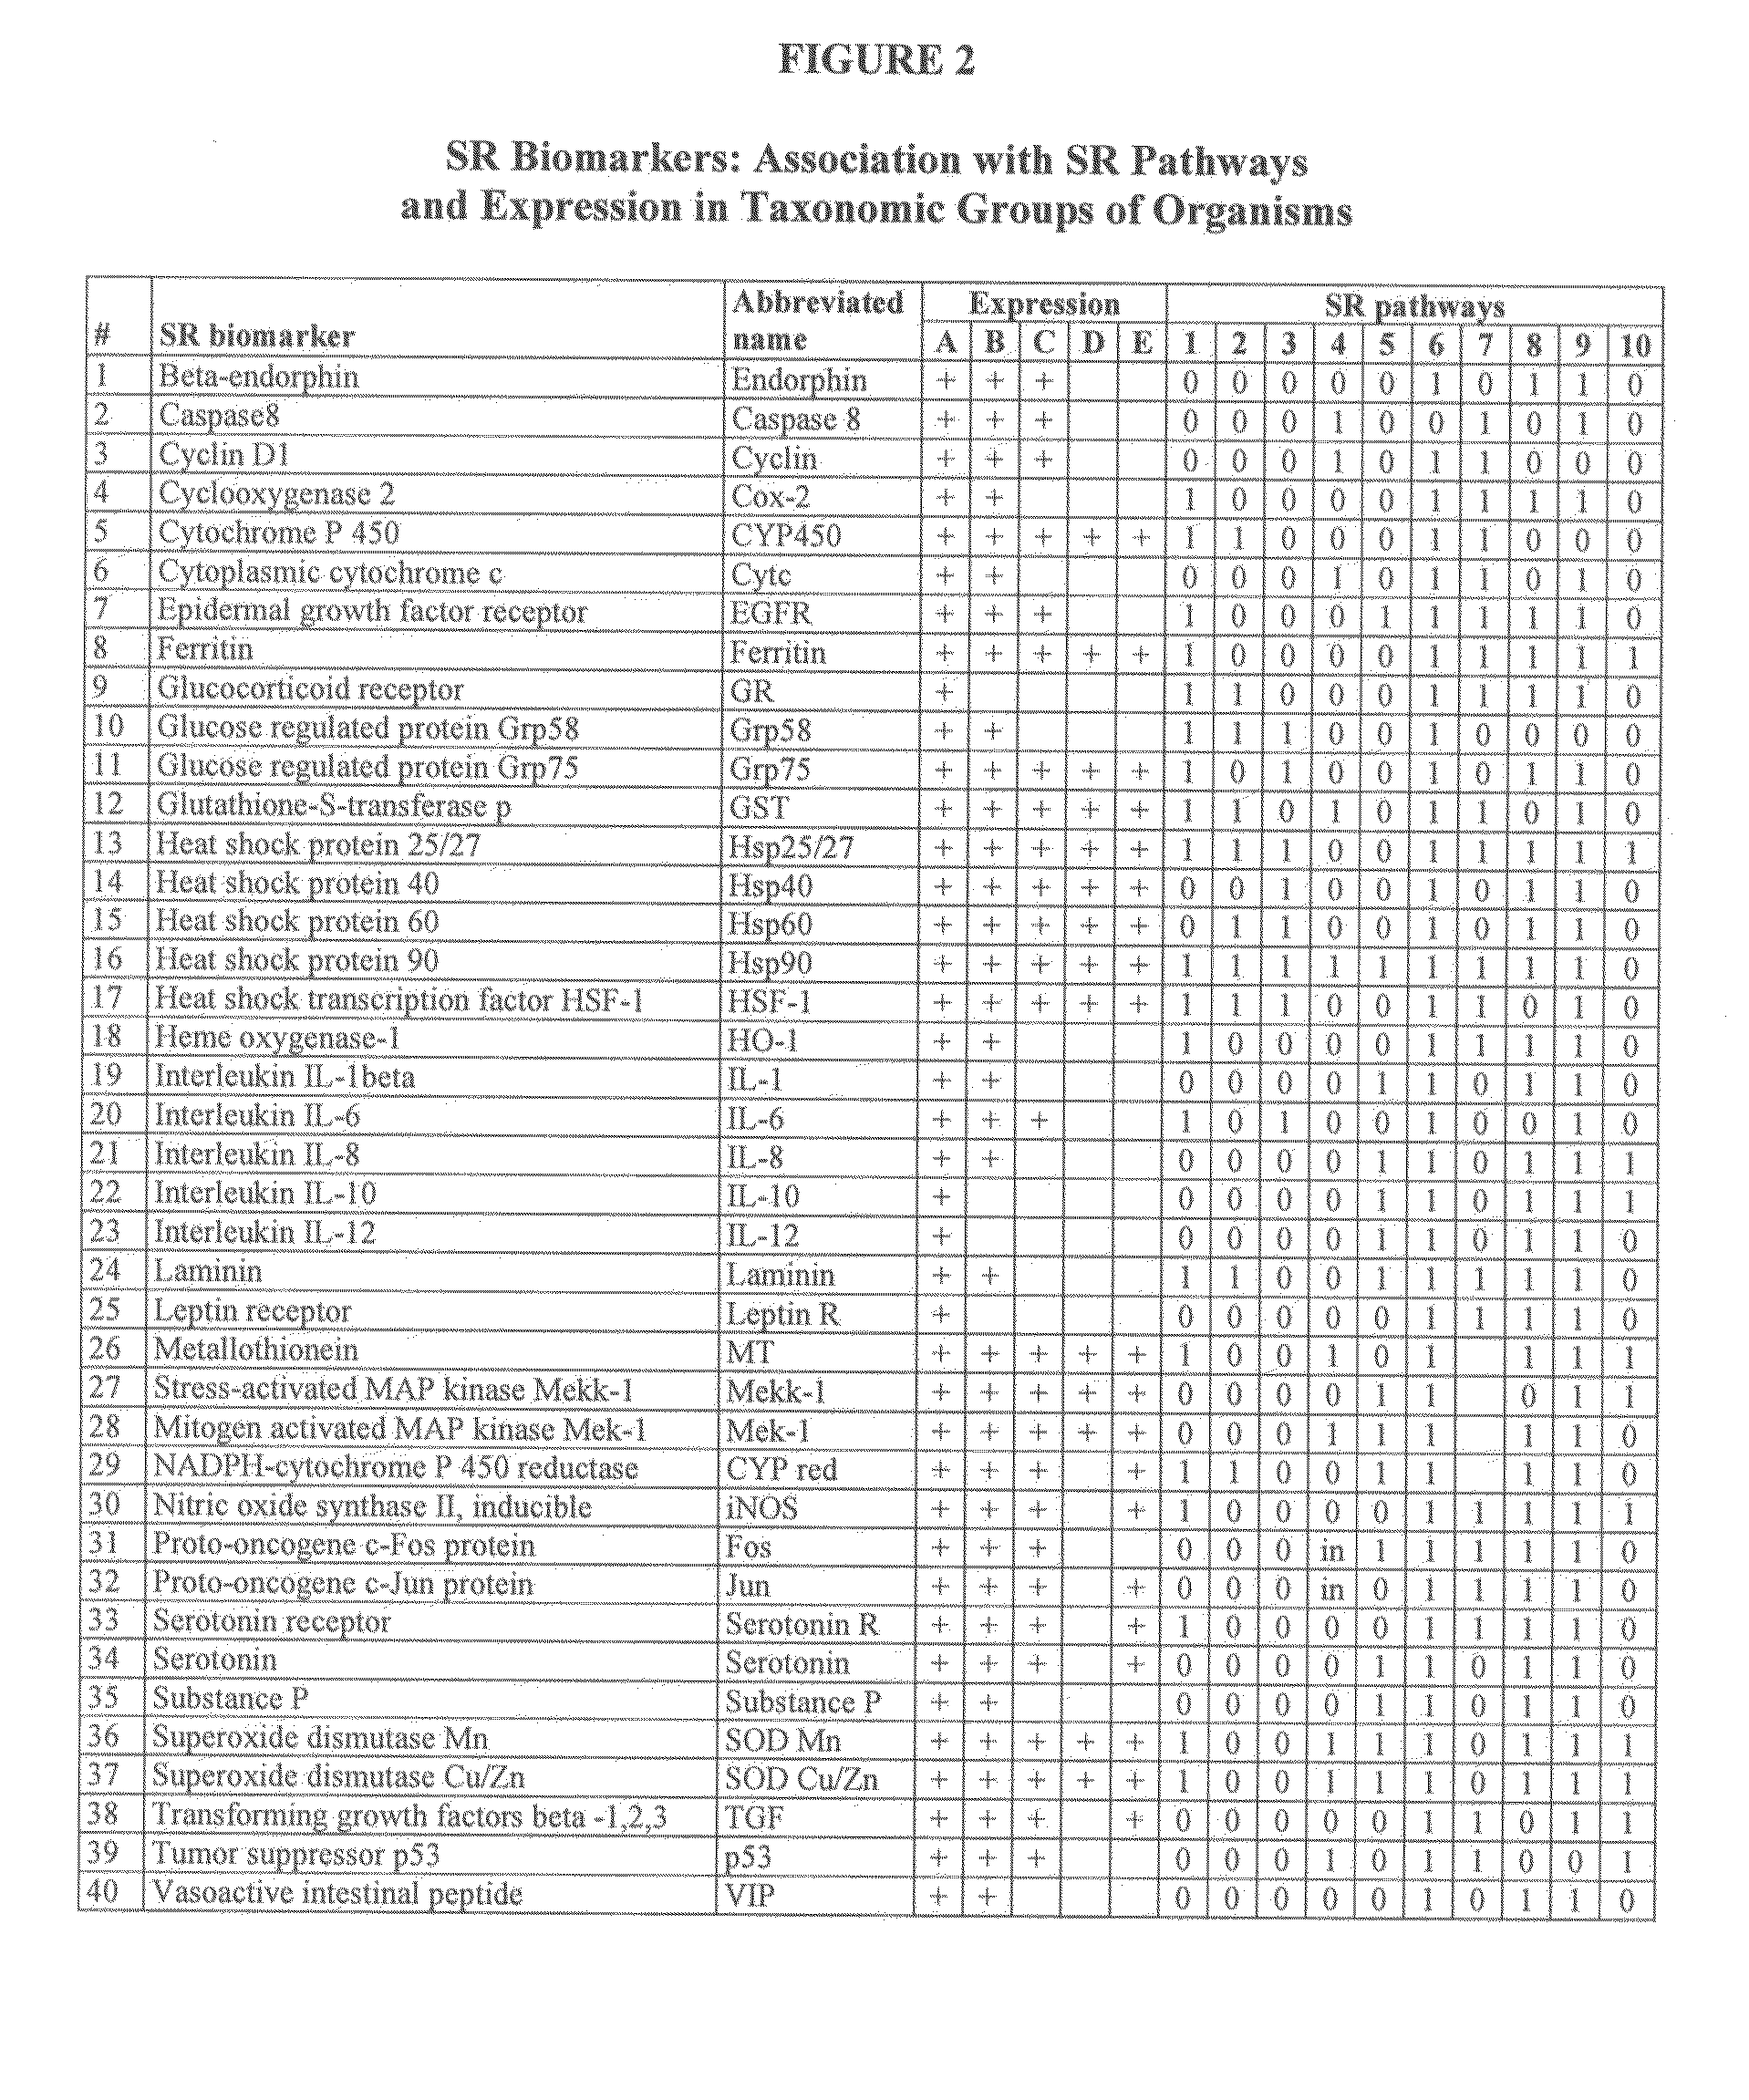
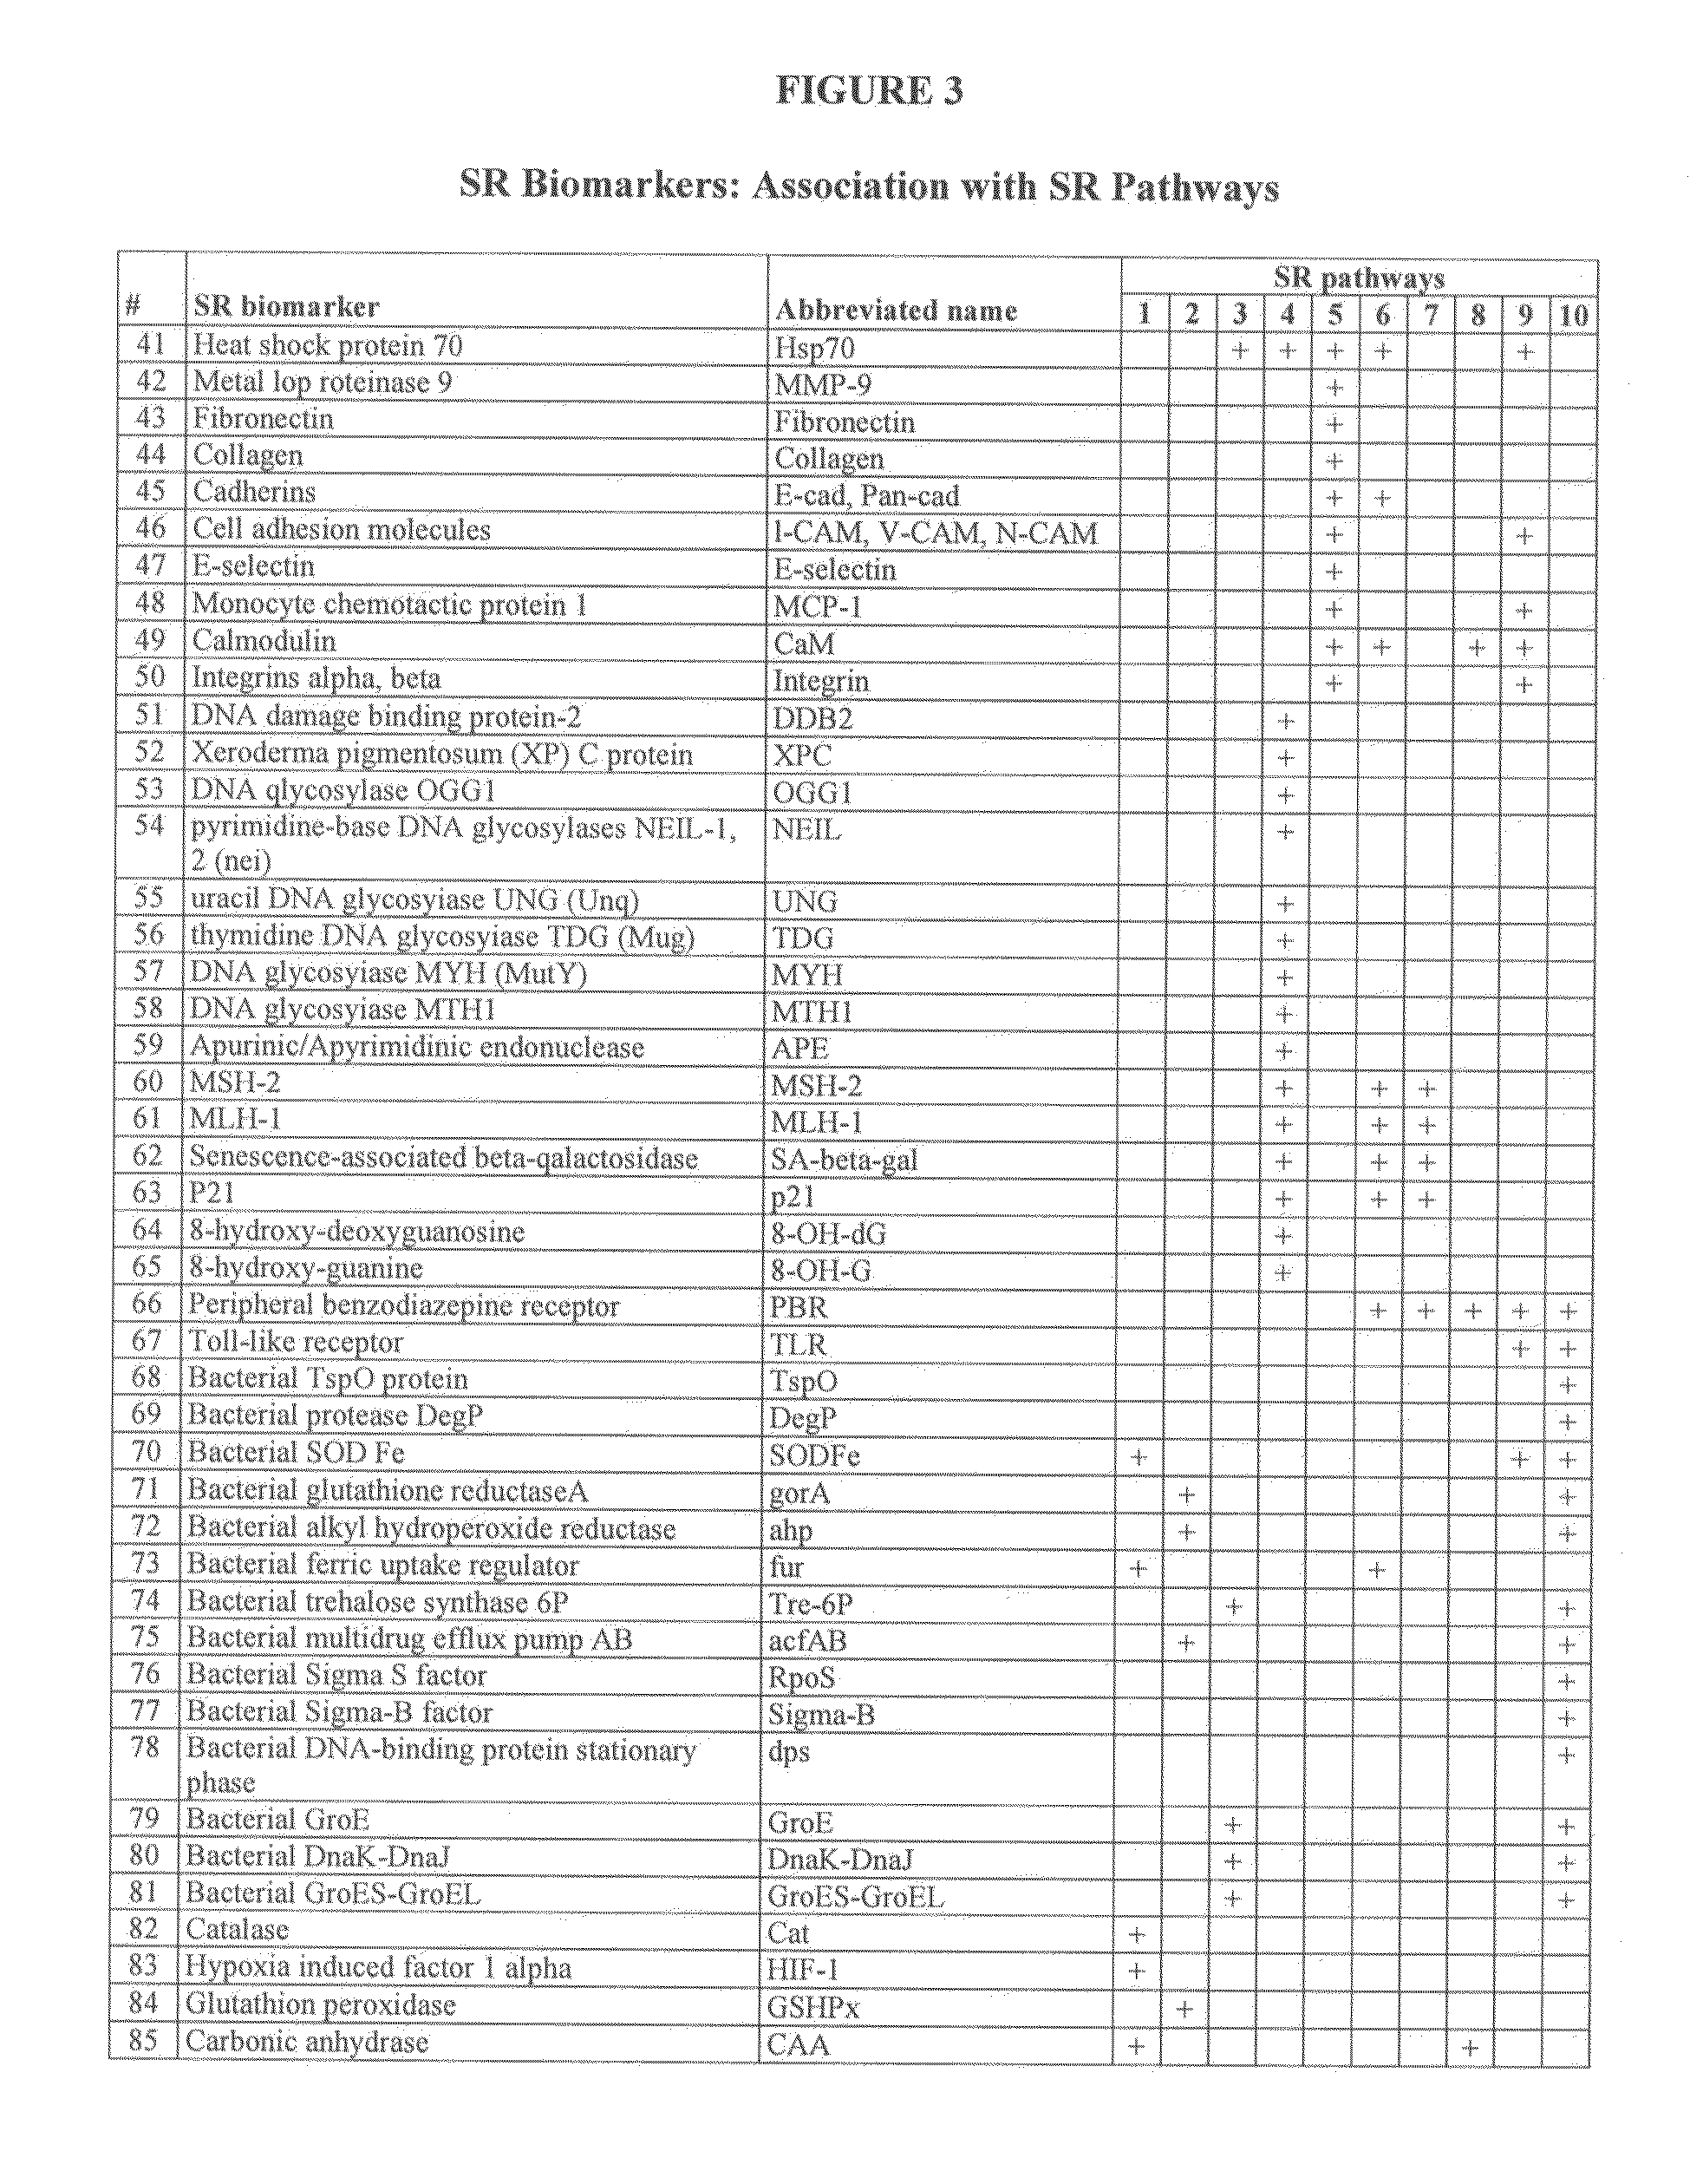
[0238]Candidate SR biomarkers. Approximately 2000 articles related to stressor effects on humans, animals, plants and microorganisms were compiled from peer-reviewed scientific literature. Meta-analysis of the articles was used to select candidate biomarkers based on two criteria:
[0239](1) Association with one or more universal SR pathways.
[0240](2) Expression in multiple species of animals. Preferred candidate biomarkers were expressed in all taxonomic g...
example 2
Construction of a Minimized SR Biomarker Panel
[0254]In this Example, the 40 SR biomarker panel described in Example 1 was used to construct and validate a minimized panel of 5 SR biomarkers that was capable of classifying the reference samples with the same reliability as the 40 SR biomarker panel.
[0255]Selection of SR Biomarkers Based on High Score Variability. The variability of SR biomarker scores in reference samples from control versus stressed subjects was determined using principal component analysis. The first two principal components, pc1 and pc2, cumulatively accounted for >97% of the variability. The variability index was calculated as:
vi=l1ix1i+l2ix2i
where;
vi is the variability index for the i-th SR biomarker (i−1, . . . , 40);
l1i and l2i are the pc1 and pc2 eigenvalues for the i-th SR biomarker; and
x1i and x2i are the absolute values of pc1 and pc2 eigenvectors for the i-th SR biomarker.
[0256]The variability index, vi for the 40 SR biomarkers is in Table 4 below.
TABLE ...
example 3
SR Pathway Profiles for Analyzing Molecular Mechanisms of Stress
[0258]In addition to the SR biomarker profiles described above in Examples 1 and 2, SR pathway profiles can also be constructed to more particularly analyze the molecular mechanisms of stress in differentially activating individual SR pathways.
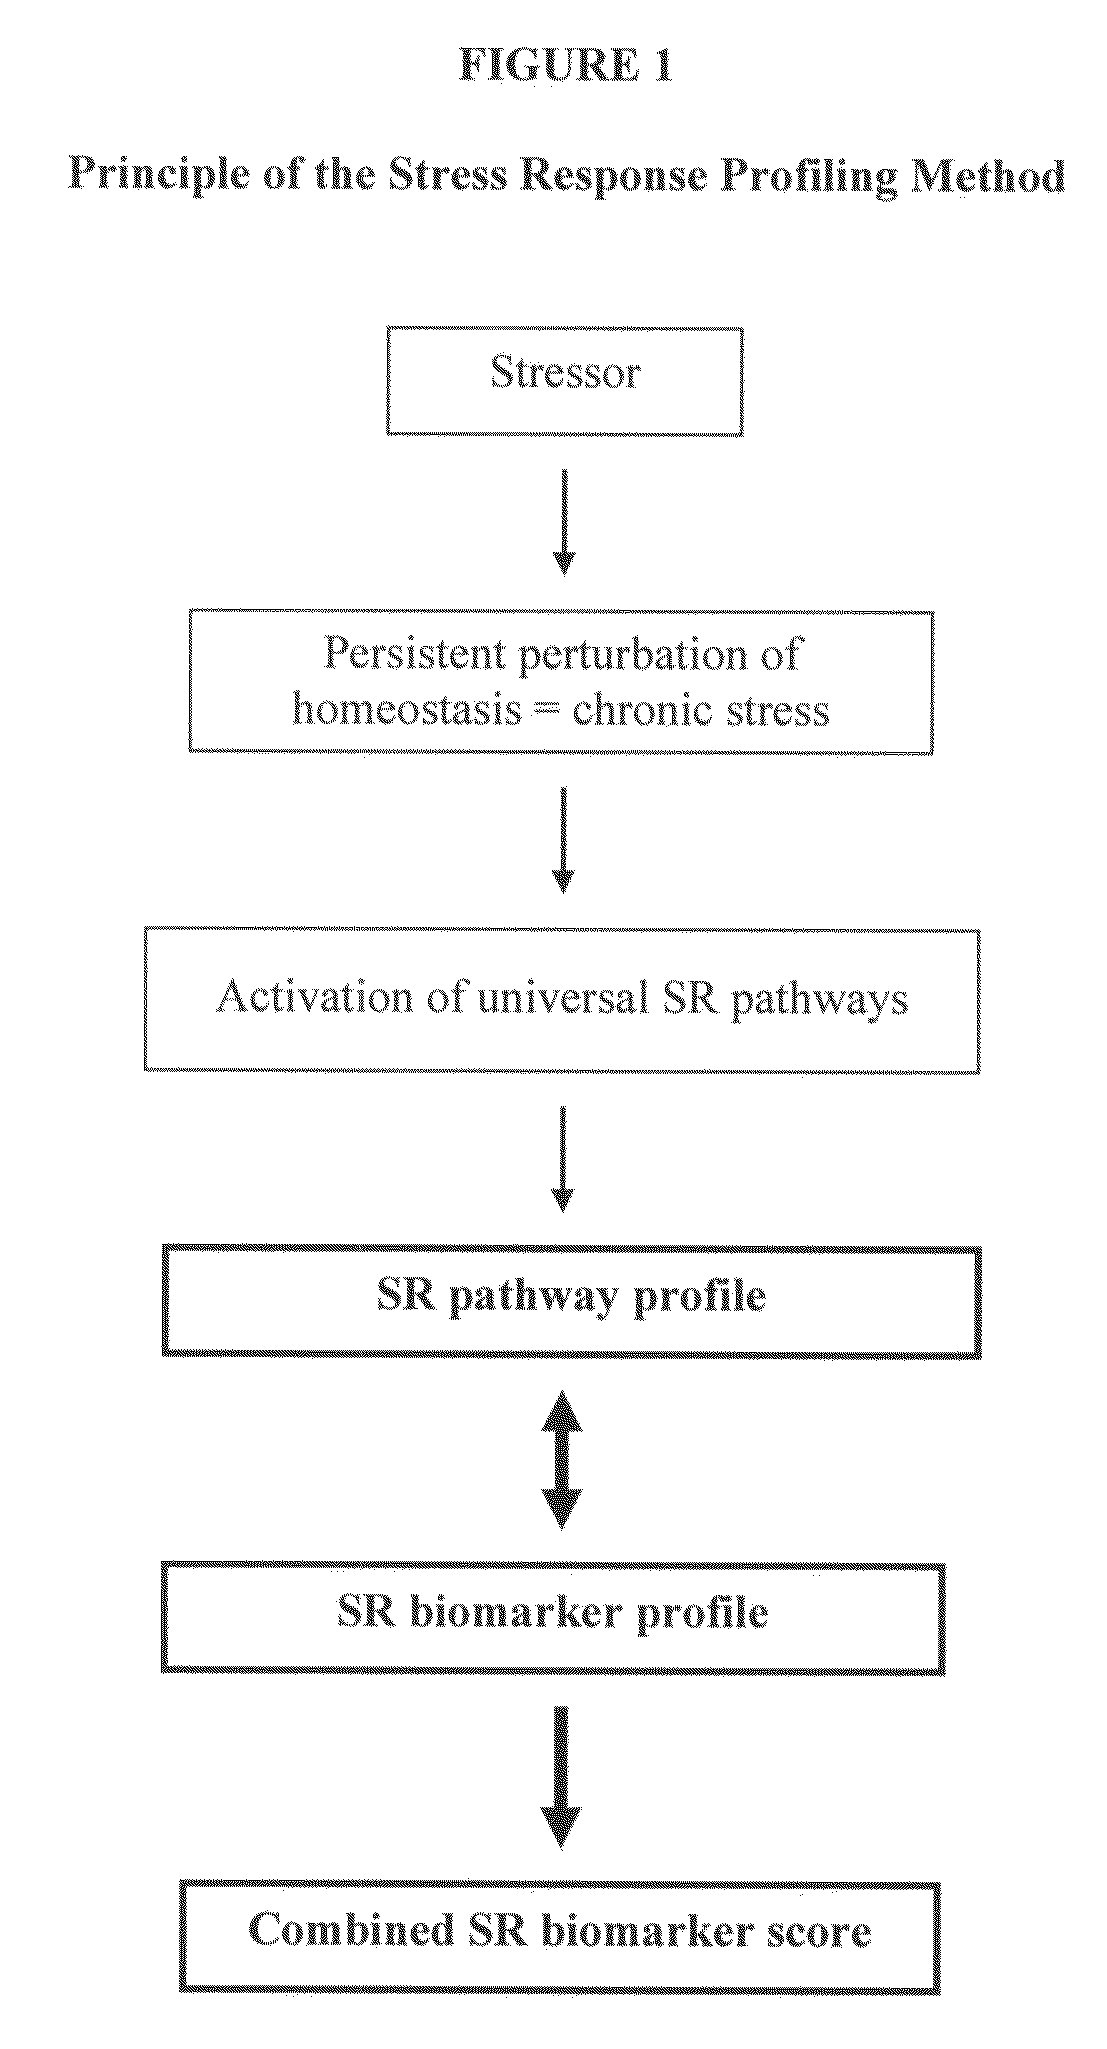
[0259]SR Pathway Profile Construction. To determine the molecular mechanism of stress, “pathway activation analysis” was performed. The principle of this analysis is the conversion of a SR biomarker profile into a “SR pathway profile” (FIG. 1.) SR pathway profiles are useful as indicators of the molecular mechanism of stress by revealing which SR pathways are most activated and which SR pathways have a coordinated regulation. SR pathway profiles can also be used for classifying samples as being from normal versus stressed subjects in the same manner as SR biomarker profiles.
[0260]SR pathway profiles were calculated using the following formula:
Z=[Z1⋮Z10]≈Z1=f1,1y1+f1,2y2+…+f1,40y40...
PUM
 Abstract
Description
Claims
Application Information
 - R&D
- Intellectual Property
- Life Sciences
- Materials
- Tech Scout
- Unparalleled Data Quality
- Higher Quality Content
- 60% Fewer Hallucinations
Browse by: Latest US Patents, China's latest patents, Technical Efficacy Thesaurus, Application Domain, Technology Topic, Popular Technical Reports.
© 2025 PatSnap. All rights reserved.Legal|Privacy policy|Modern Slavery Act Transparency Statement|Sitemap|About US| Contact US: help@patsnap.com


