Visualization of process control data

a technology of process control and visualization, applied in the direction of electric controllers, electric programme control, instruments, etc., can solve the problems of not providing for easy use and visual appealing representation of data, and achieve the effect of facilitating the provision (and presenting

Active Publication Date: 2009-08-20
IONICS INC
View PDF13 Cites 221 Cited by
  • Summary
  • Abstract
  • Description
  • Claims
  • Application Information

AI Technical Summary

Benefits of technology

[0006]In one aspect, the invention provides a system for monitoring operational process control (OPC) data and includes a human-machine interface and a configuration server. The interface facilitates the presentation of the OPC data and includes a geographic representation of an area of interest, graphical representations of monitored processes, and graphical status indicators associated with each monitored process. The graphical representations are displayed at a location within the geographic representation corresponding to a physical location of the monitored process, and the graphical status indicators associated with each monitored process are responsive (either in real-time or asynchronously) to data received from the monitored processes. The server facilitates the configuration of the graphical status indicators and their associations with the monitored processes. In certain cases, the received data may be formatted and / or transmitted according to various standards, such as object linking and embedding for process control standards, web services, and the like.

Problems solved by technology

This standard goes only so far, however, in that it does not provide for easy to use and visually appealing representations of the data.

Method used


Image

  • Visualization of process control data
  • Visualization of process control data
  • Visualization of process control data

Examples


Embodiment Construction

[0037]The invention relates generally to monitoring and controlling processes, which can include controlling equipment (such as valves and gauges) in an automated factory or process line, the operation of power plants, water treatment facilities, heating, air conditioning and ventilation (“HVAC”) systems. Embodiments of the invention can be used in activities that involve the interactions of humans with control processes and systems, for example, in nursing homes, in amusement park rides, and even in prisons. Embodiments of the invention can also be used to monitor and manage operations in a discrete manufacturing environment, where data or events result in the generation and use of digital signals.

Architecture and Basic Components

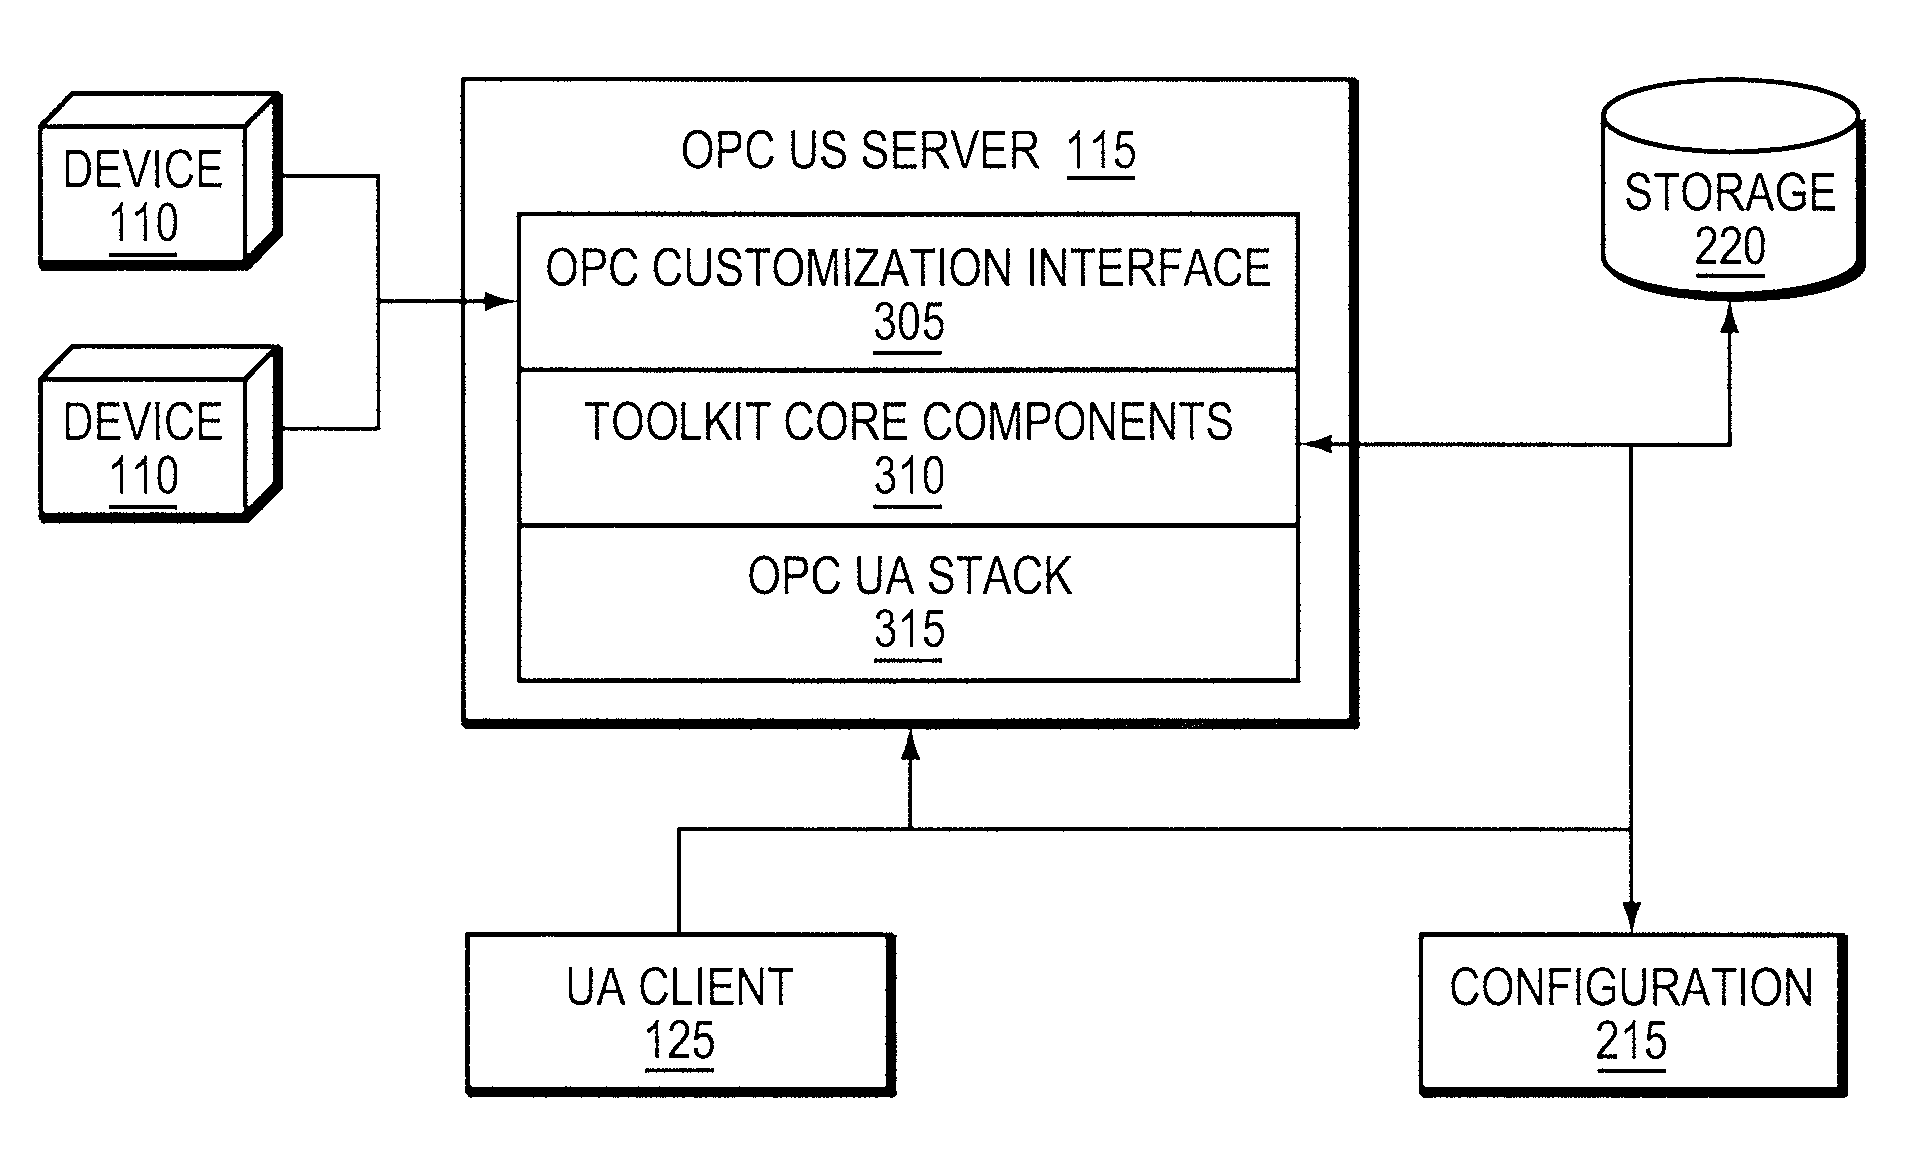
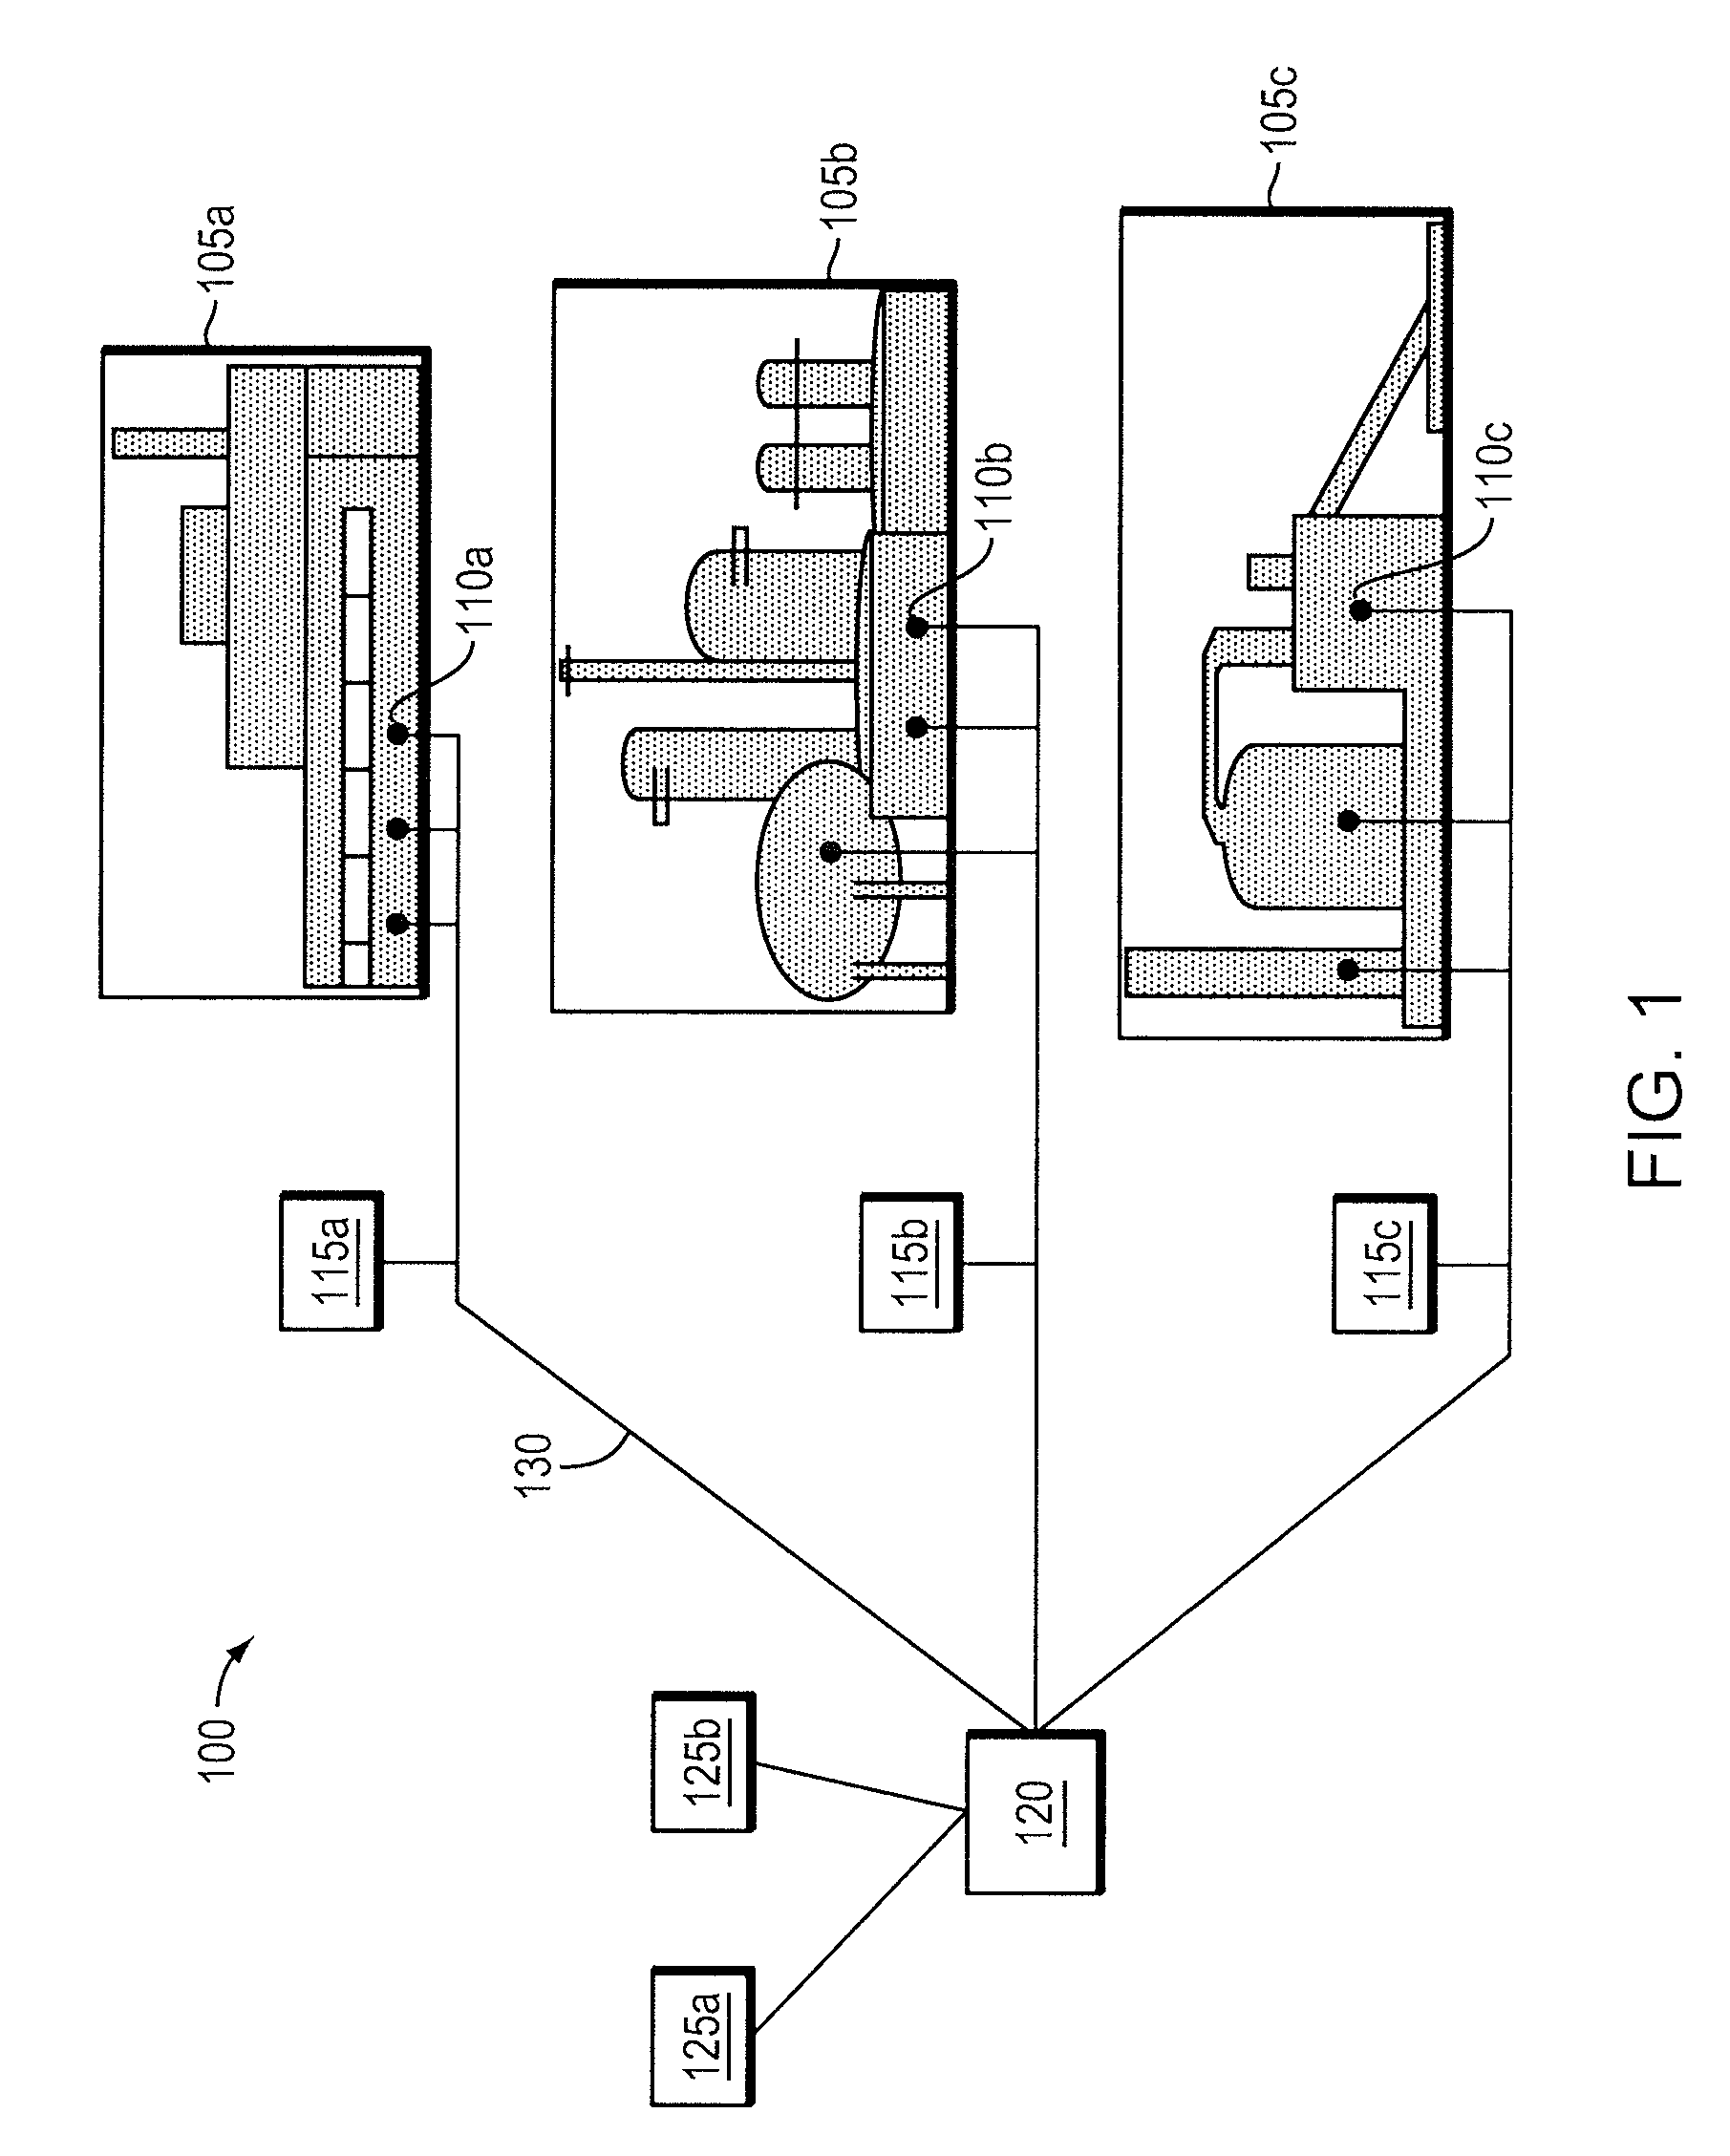
[0038]FIG. 1 depicts, generally, an exemplary environment 100 in which various embodiments of the present invention operates in order to collect, analyze, present, and act on operational process control (OPC) data as it is generated and collected. The OPC ...


PUM


Abstract

Graphical representations of operational process control data associated with monitored processes is displayed within the context of the geographical locations at which the processes operate, and in a manner as to model individual components of the processes.

Description

CROSS-REFERENCE TO RELATED APPLICATIONS[0001]This application is a continuation of and claims priority to Patent Cooperation Treaty Application Serial No. US2008 / 78434, filed on Oct. 1, 2008, which claims the benefit of provisional U.S. patent application Ser. No. 60 / 976,580, filed Oct. 1, 2007.TECHNICAL FIELD[0002]This invention relates to computer-based methods and systems for accessing and presenting data, and more specifically to systems and methods for gathering, analyzing, formatting and presenting information related to controlled and / or monitored processes and environments.BACKGROUND[0003]Process monitoring and control relates to the viewing and control of parameters of one or more processes, environments in which the processes are performed, and / or the operation of equipment executing the processes. In the manufacturing context, for example, process parameters can include duration, temperature, pressure, speed, quantity, and / or direction of motion of a particular piece of m...

Claims


Application Information

Patent Timeline
Patent Type & Authority Applications(United States)
IPC IPC(8): G06F3/048G05B19/02
CPCG05B23/0267G06T11/206G06F11/324
Inventor AGRUSA, RUSSELL L.MASSARO, SIMONEALTAMORE, LEONARDOKRESL, VOJTAVERCELLI, ROBERTOKLIMOV, ALEXANDERRAIMONDO, ROBERTOELSBREE, CHRISTOPHER N.
Owner IONICS INC
Why Eureka
Try Eureka