Method for improving fluorescence image contrast
a fluorescence image and contrast technology, applied in the field of fluorescence image contrast improvement, can solve the problems of loss of information related to fluorophore concentration, inability to detect fluorescence images, etc., and achieve the effect of reducing background fluorescence signal
- Summary
- Abstract
- Description
- Claims
- Application Information
AI Technical Summary
Benefits of technology
Problems solved by technology
Method used
Image
Examples
example 1
[0059]Equal volumes of 50 nM Cy5.5 and 150 nM Atto680 were mixed together. Fluorescence signal was obtained using eXplore Optix™ with a pulsed diode laser wavelength at 666 nm as the excitation light source. When the quantum yield, extinction coefficient, and fluorescence spectrum and filter window information are taken into account, the fluorescence signal ratio of Cy5.5 and Atto680 from the mixture is about 0.55:0.45.
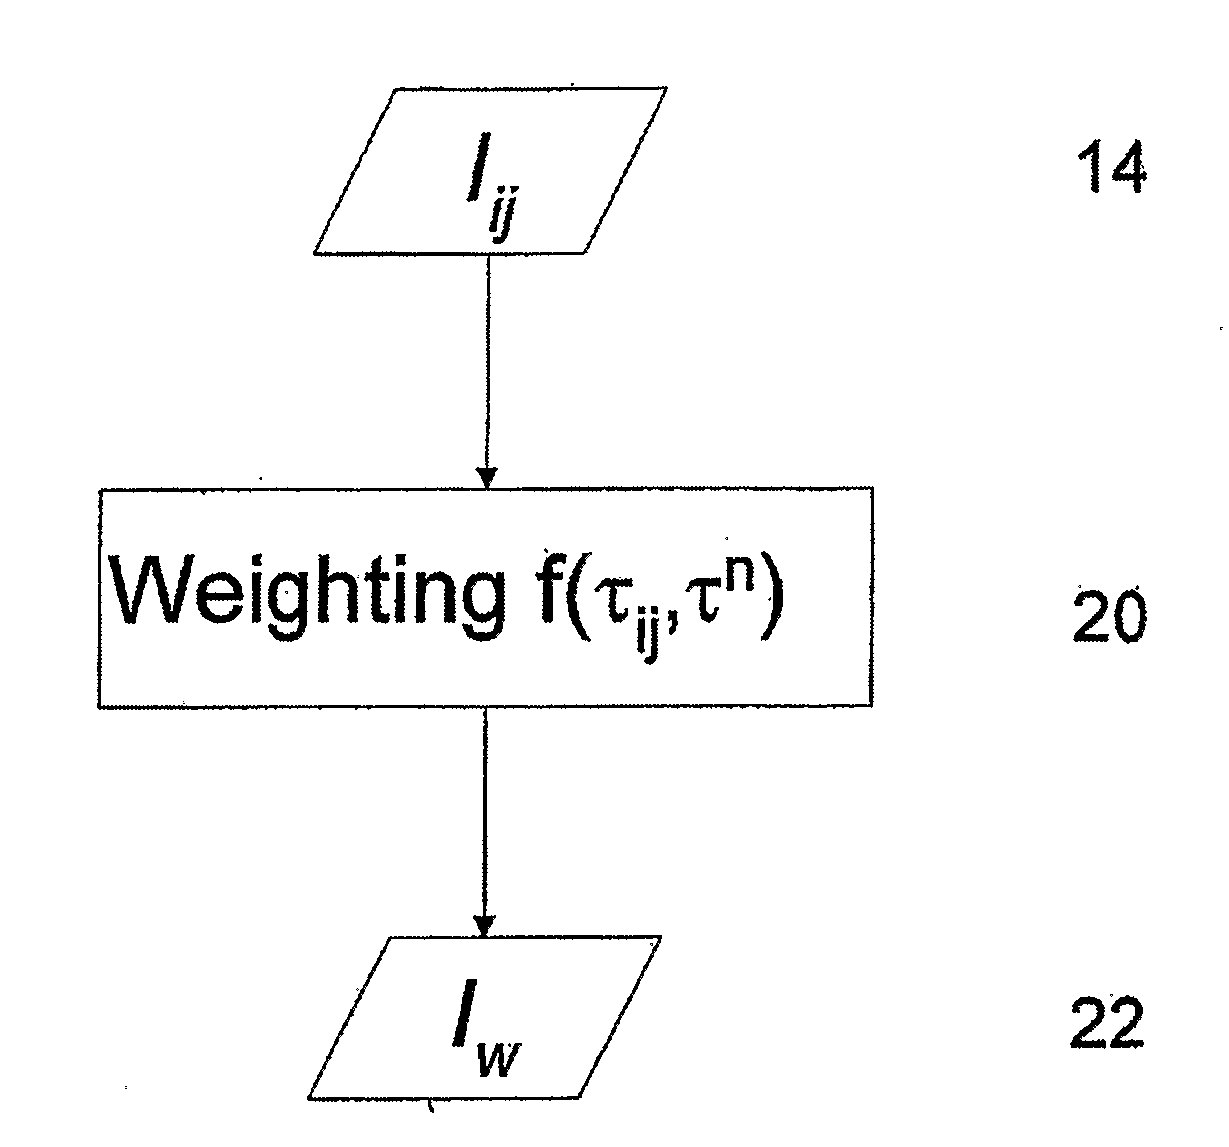
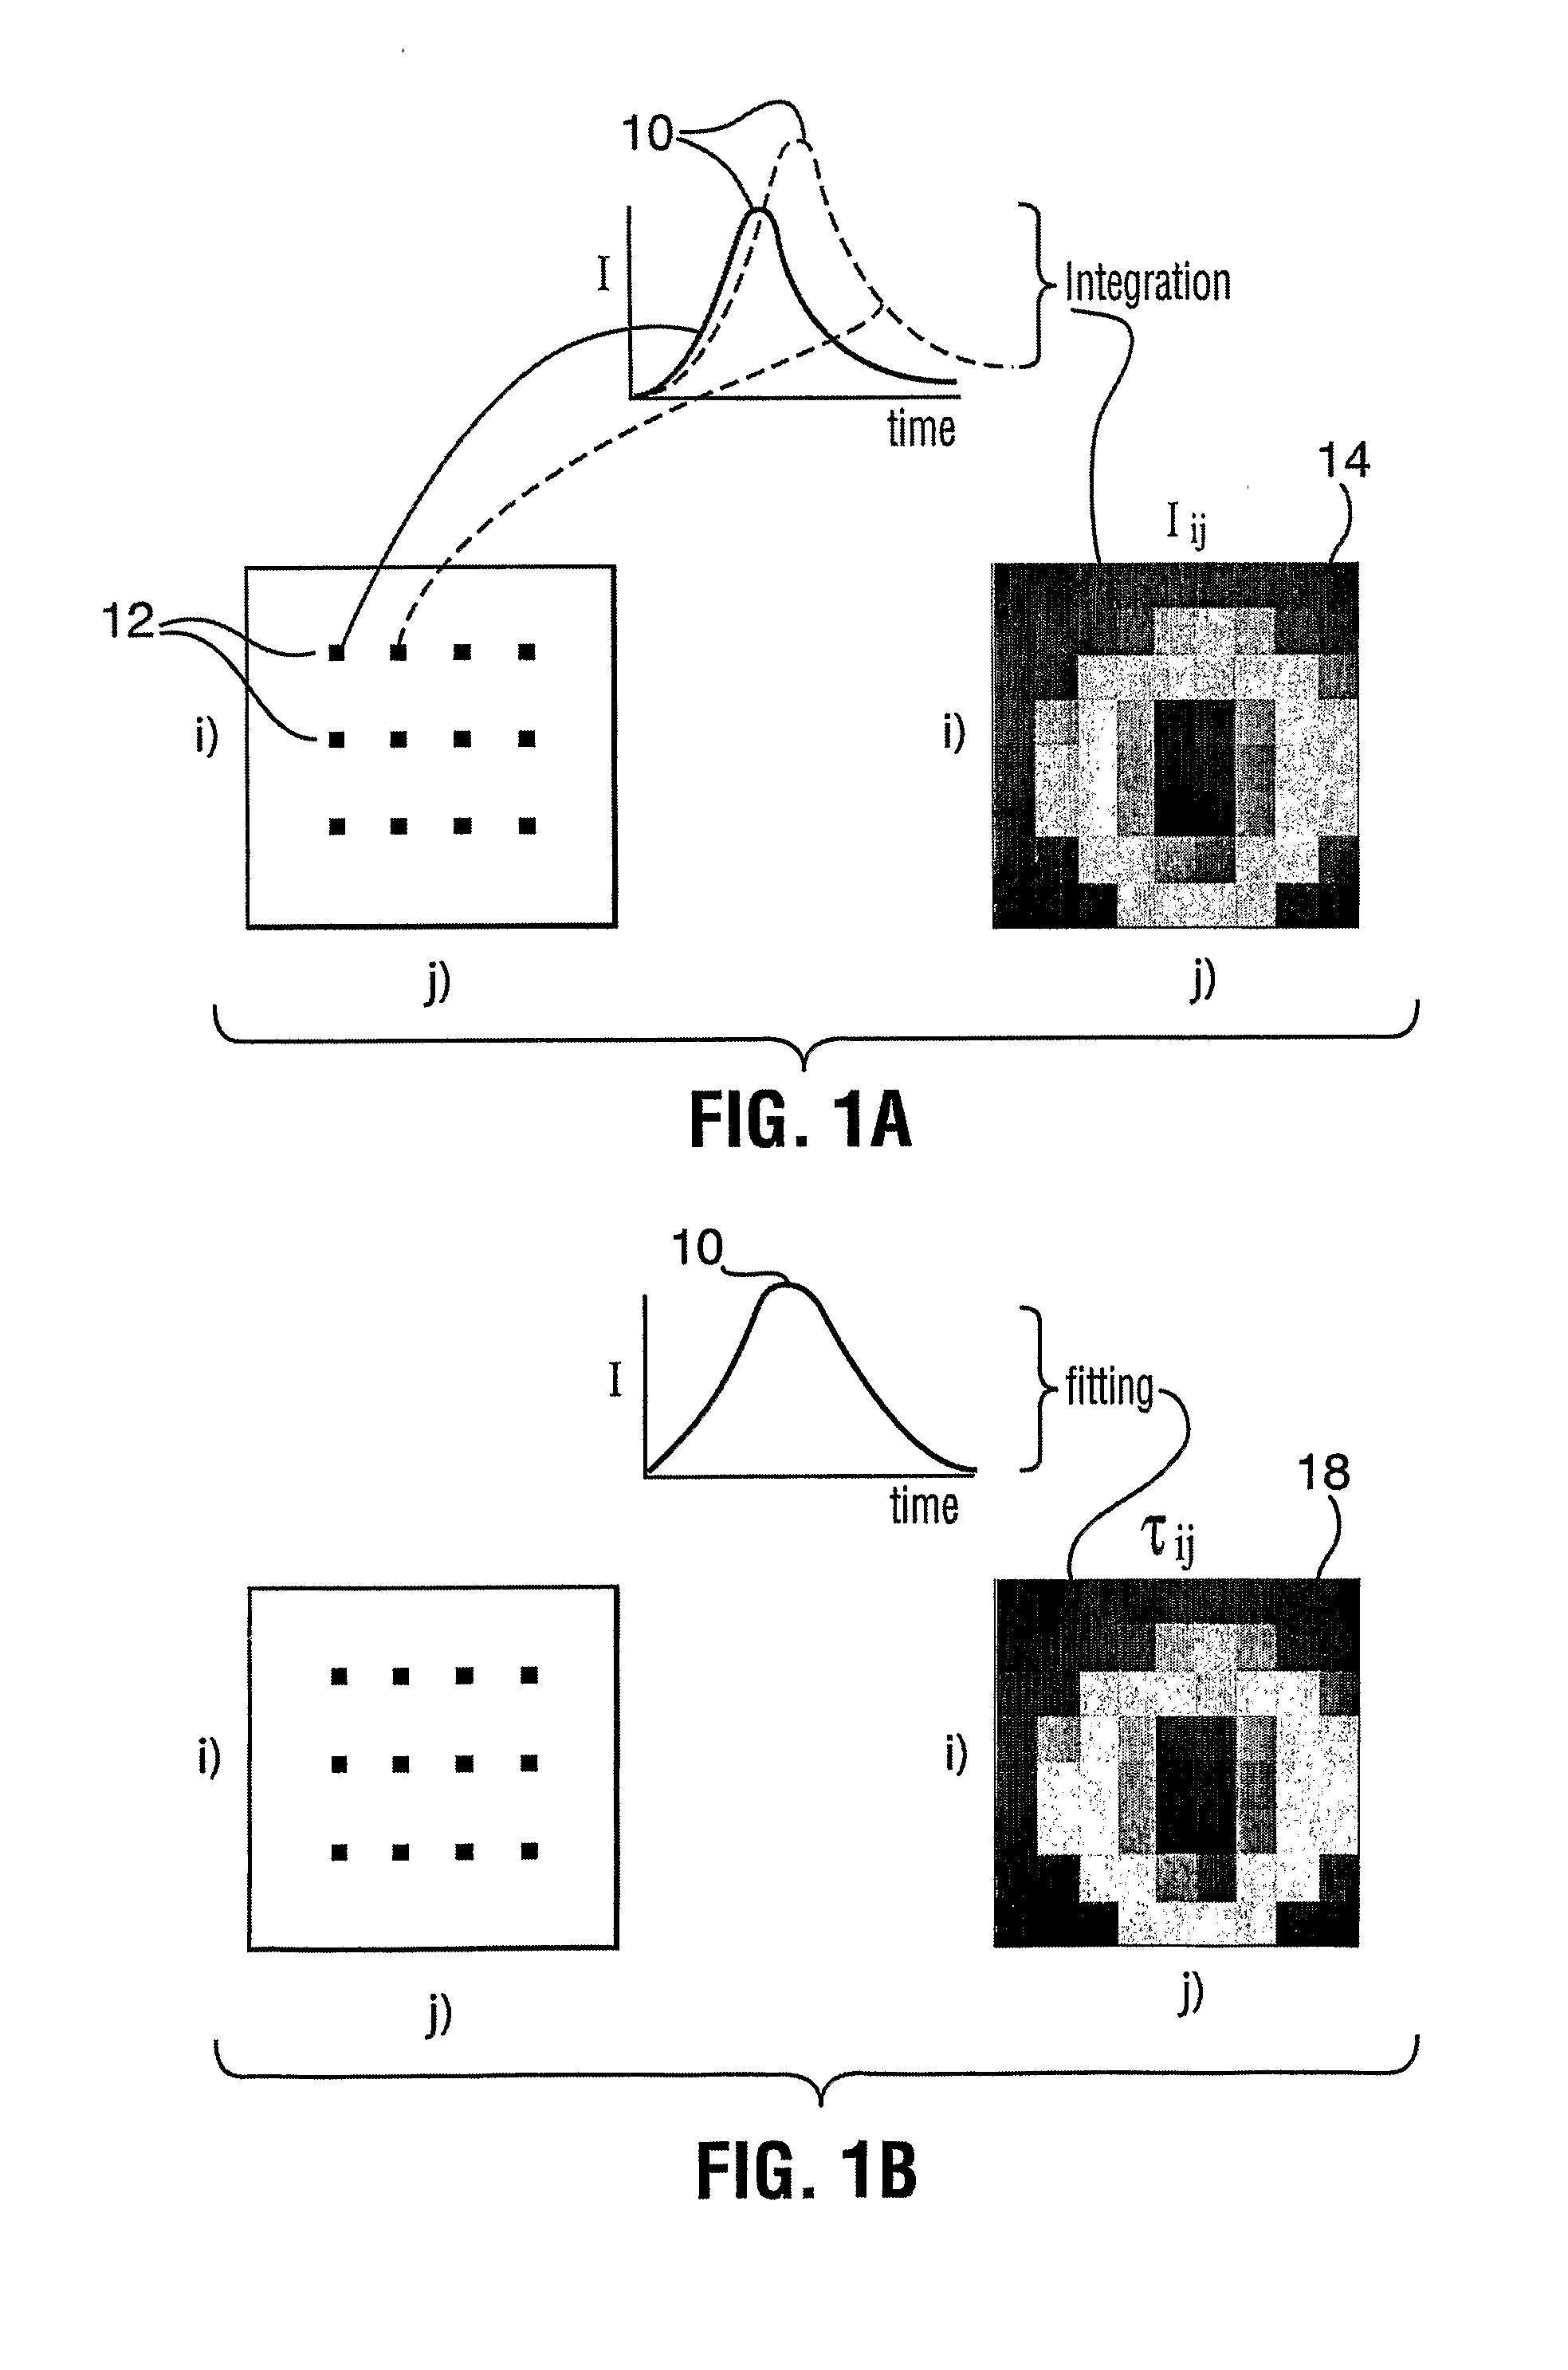
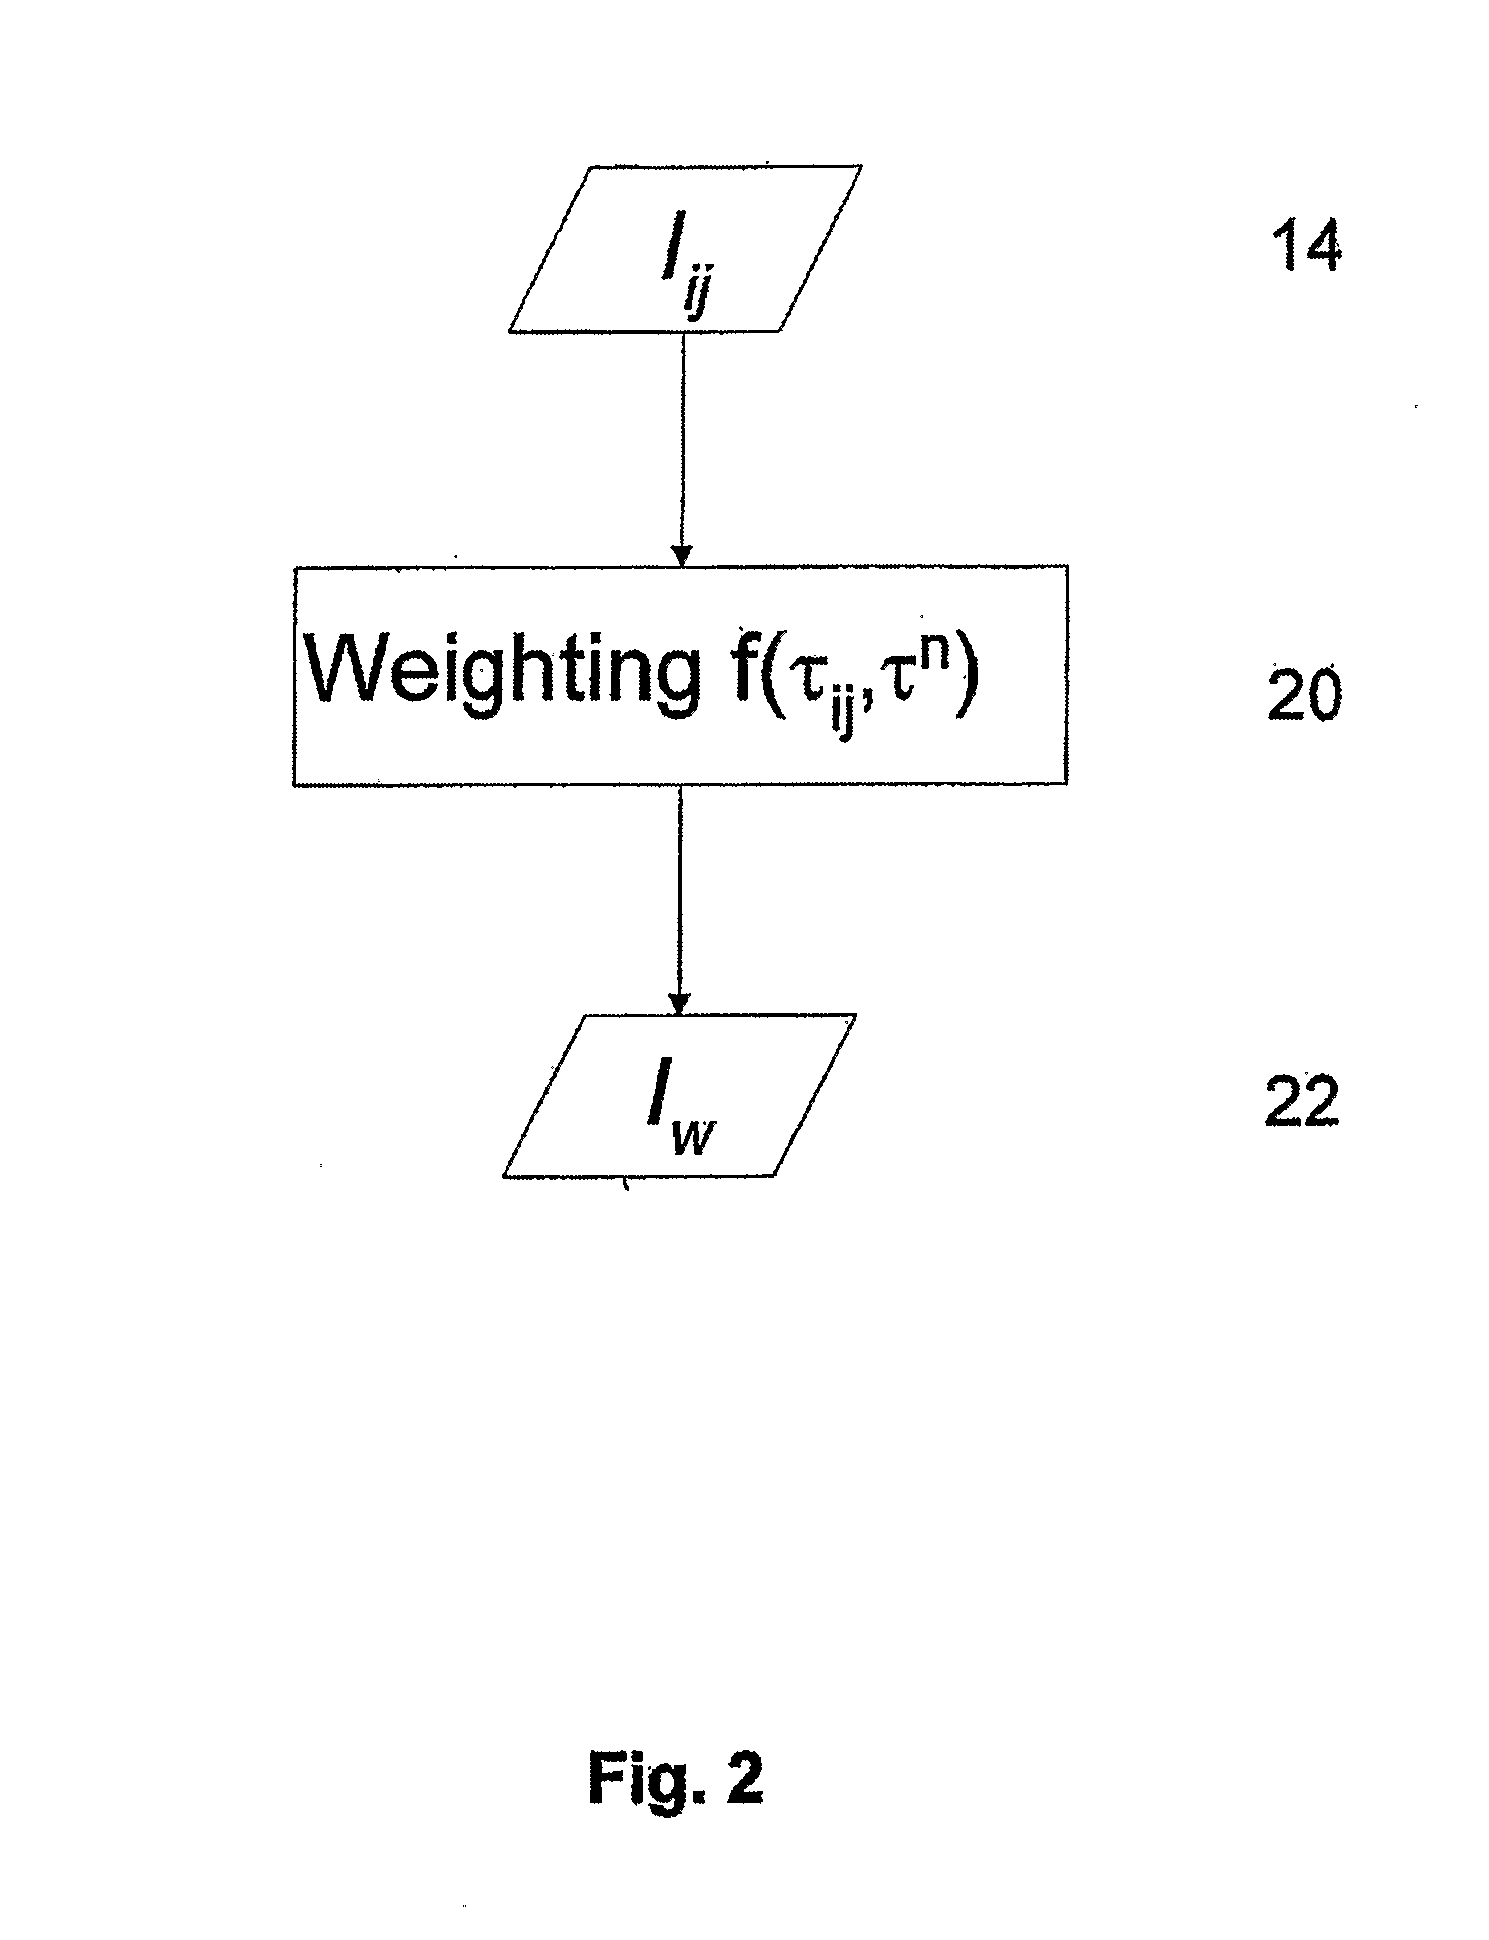
[0060]FIG. 5 illustrates the method described above. Panel (a-i) is a raw fluorescence intensity image of the Cy 5.5 and Atto 680 mixture. A lifetime image (panel (a-ii)) was generated using an effective lifetime (fitting the TPSF with a single exponential). Panel (a-iii) exhibits a processed intensity image (Inew) obtained by performing a preliminary weighting on the raw intensity image. Because only Cy5.5 and Atto 680 are present there is no difference between the raw image and processed image (no background fluorescence). Panels (b-i) and (c-i) exhibit lifetime ima...
example 2
[0061]One hundred nM Cy5.5 and 200 nM Atto680 solution were arranged in two separate locations. Fluorescence signal was obtained using eXplore Optix with a pulsed diode laser wavelength at 666 nm as the excitation light source.
[0062]In the particular case where the location of fluorophore species within the object are not overlapping, there is no need for multi-exponential fitting of the TPSF and one can proceed directly with the weighting step of the method. FIG. 6 provides such an example in which the two fluorophores species do not overlap. Panel (i) of FIG. 6 is a measured raw fluorescence intensity image with two fluorophore species, Atto 680 on the left and Cy5.5 on the right. From the intensity image alone, without knowing a priori where the fluorophores are located, one would not be able to identify the fluorophores species. Panel (ii) is the corresponding fluorescence lifetime image obtained by fitting the TPSF of each pixel with a single exponential decay model. While the ...
example 3
[0063]The fluorophore species may be the same fluorophore molecule in different environment. Thus, for example, the object may comprise one fluorophore having a lifetime τ1 when it is bound to a protein and a lifetime τ2 when it is free. In this case it is possible to model the TPSF by the following dual exponential:
fexp(−t / τ1)+(1−f)exp(−t / τ2) (15)
where, t is the time, τ1 and τ2 are the respective lifetimes of the bound and free states and f is the fraction of fluorophores in the bound state: f=[bound] / ([bound]+[free]). The parameters in this model can then be obtained from measured data through multi-variate curve fitting. The dual exponential for free / bound fluorophore species can be used to obtain weighted intensity images as described above.
PUM
 Abstract
Description
Claims
Application Information
 - R&D
- Intellectual Property
- Life Sciences
- Materials
- Tech Scout
- Unparalleled Data Quality
- Higher Quality Content
- 60% Fewer Hallucinations
Browse by: Latest US Patents, China's latest patents, Technical Efficacy Thesaurus, Application Domain, Technology Topic, Popular Technical Reports.
© 2025 PatSnap. All rights reserved.Legal|Privacy policy|Modern Slavery Act Transparency Statement|Sitemap|About US| Contact US: help@patsnap.com


