Ultrasonic diagnostic apparatus, ultrasonic image processing apparatus, and medical image processing apparatus

Active Publication Date: 2009-12-24
TOSHIBA MEDICAL SYST CORP
28 Cites 26 Cited by

AI-Extracted Technical Summary

Problems solved by technology

For this reason, the heart wall motion showing three-dimens...

Method used

[0082]In the case of displaying the three-dimensional strain gauge image 50 continuously with time-series, each strain gauge of the three-dimensional strain gauge image 50 exists within each plane of the five MPR images (that is, 4C plane, 2C plane, A plane, M plane, and B plane) in the reference time phase, while the strain gauge of the three-dimensional strain gauge image 50 may arbitrarily protrude from the planes of the five MPR images according to the movement of the tissue in subsequent time phase. Accordingly, in the example shown in FIG. 4, recognition of the anatomical orientation is realized by displaying the three-dimensional strain gauge image 50 in each time phase while showing the positions of the five MPR images in the reference time phase so that the correspondence relationship between each strain gauge on the three-dimensional...

Benefits of technology

[0021]According to yet another aspect of the invention, an ultrasonic image processing method includes: storing volume data collected over one or more periods of movement of tissue of a subject body, which moves periodically, by ultrasonically scanning the tissue of the subject body; setting a three-dimensional region of interest of the tissue of the subject body for the volume data in a predetermined time phase; generating motion vector information on the region of interest in time phases other than the predetermined time phase by processing using pattern matching; setting at least one three-dimensional position of a strain gauge, which is a line segment on the tissue of the subject body, using the motion vector information on the region of interest; generating a three-dimensional strain gauge image obtained by imaging the set strain gauge in a three-dimensional manner; and displaying the three-dimensional strain gauge image in a predetermined form.
[0022]According to yet another aspect of the invention, an ultrasonic image processing method includes: storing volume data collected over one or more periods of movement of tissue of a subject body, which moves periodically, by ultrasonically scanning the tissue of the subject body; setting a three-dimensional region of interest of the tissue of the subject body for the volume data in a predetermined time phase; generating motion vector information on the region of interest in time phases other than the predetermined time phase by processing using pattern matching; setting at least one three-dimensional position of a strain gauge, which is a line segment on the tissue of the subject body, using the motion vector information on the region of interest; setting at least one arbitrary section for volume data in each time phase; generating a three-dimensional strain gauge image obtained by projection of the strain gauge onto at least the one arbitrary section; and displaying the three-dimensional strain gauge image in a predetermined form.
[0023]According to yet another aspect of the invention, an ultrasonic image processing method includes: storing volume data collected over one or more periods of movement of tissue of a subject body, which moves periodically, by ultrasonically scanning the tissue of the subject body; setting at least one arbitrary section for volume data in each time phase; setting a region of interest of the tissue of the subject body on at least the one arbitrary section in a predetermined time phase; generating motion vector information on the region of interest in time phases other than the predetermined time phase by processing using pattern matching; setting at least one three-dimensional position of a strain gauge, which is a line segment on the tissue of the subject body, using the motion vector information on the region of interest; generating a three-dimensional strain gauge image in which the strain gauge is set at a corresponding position on at lea...

Abstract

A plurality of strain gauges defined by gauge endpoints are set in each time phase using motion vector information of tissue, and a three-dimensional strain gauge image in which each strain gauge is disposed at a three-dimensional position corresponding to, for example, an ultrasonic image in each time phase is generated and displayed. Moreover, an MPR image is set on volume data and is displayed in a predetermined form in a state where gauge coordinates are projected thereon.

Application Domain

Organ movement/changes detectionInfrasonic diagnostics +3

Technology Topic

Ultrasound diagnosticsUltrasound image +4

Image

  • Ultrasonic diagnostic apparatus, ultrasonic image processing apparatus, and medical image processing apparatus
  • Ultrasonic diagnostic apparatus, ultrasonic image processing apparatus, and medical image processing apparatus
  • Ultrasonic diagnostic apparatus, ultrasonic image processing apparatus, and medical image processing apparatus

Examples

  • Experimental program(8)

Example

First Embodiment
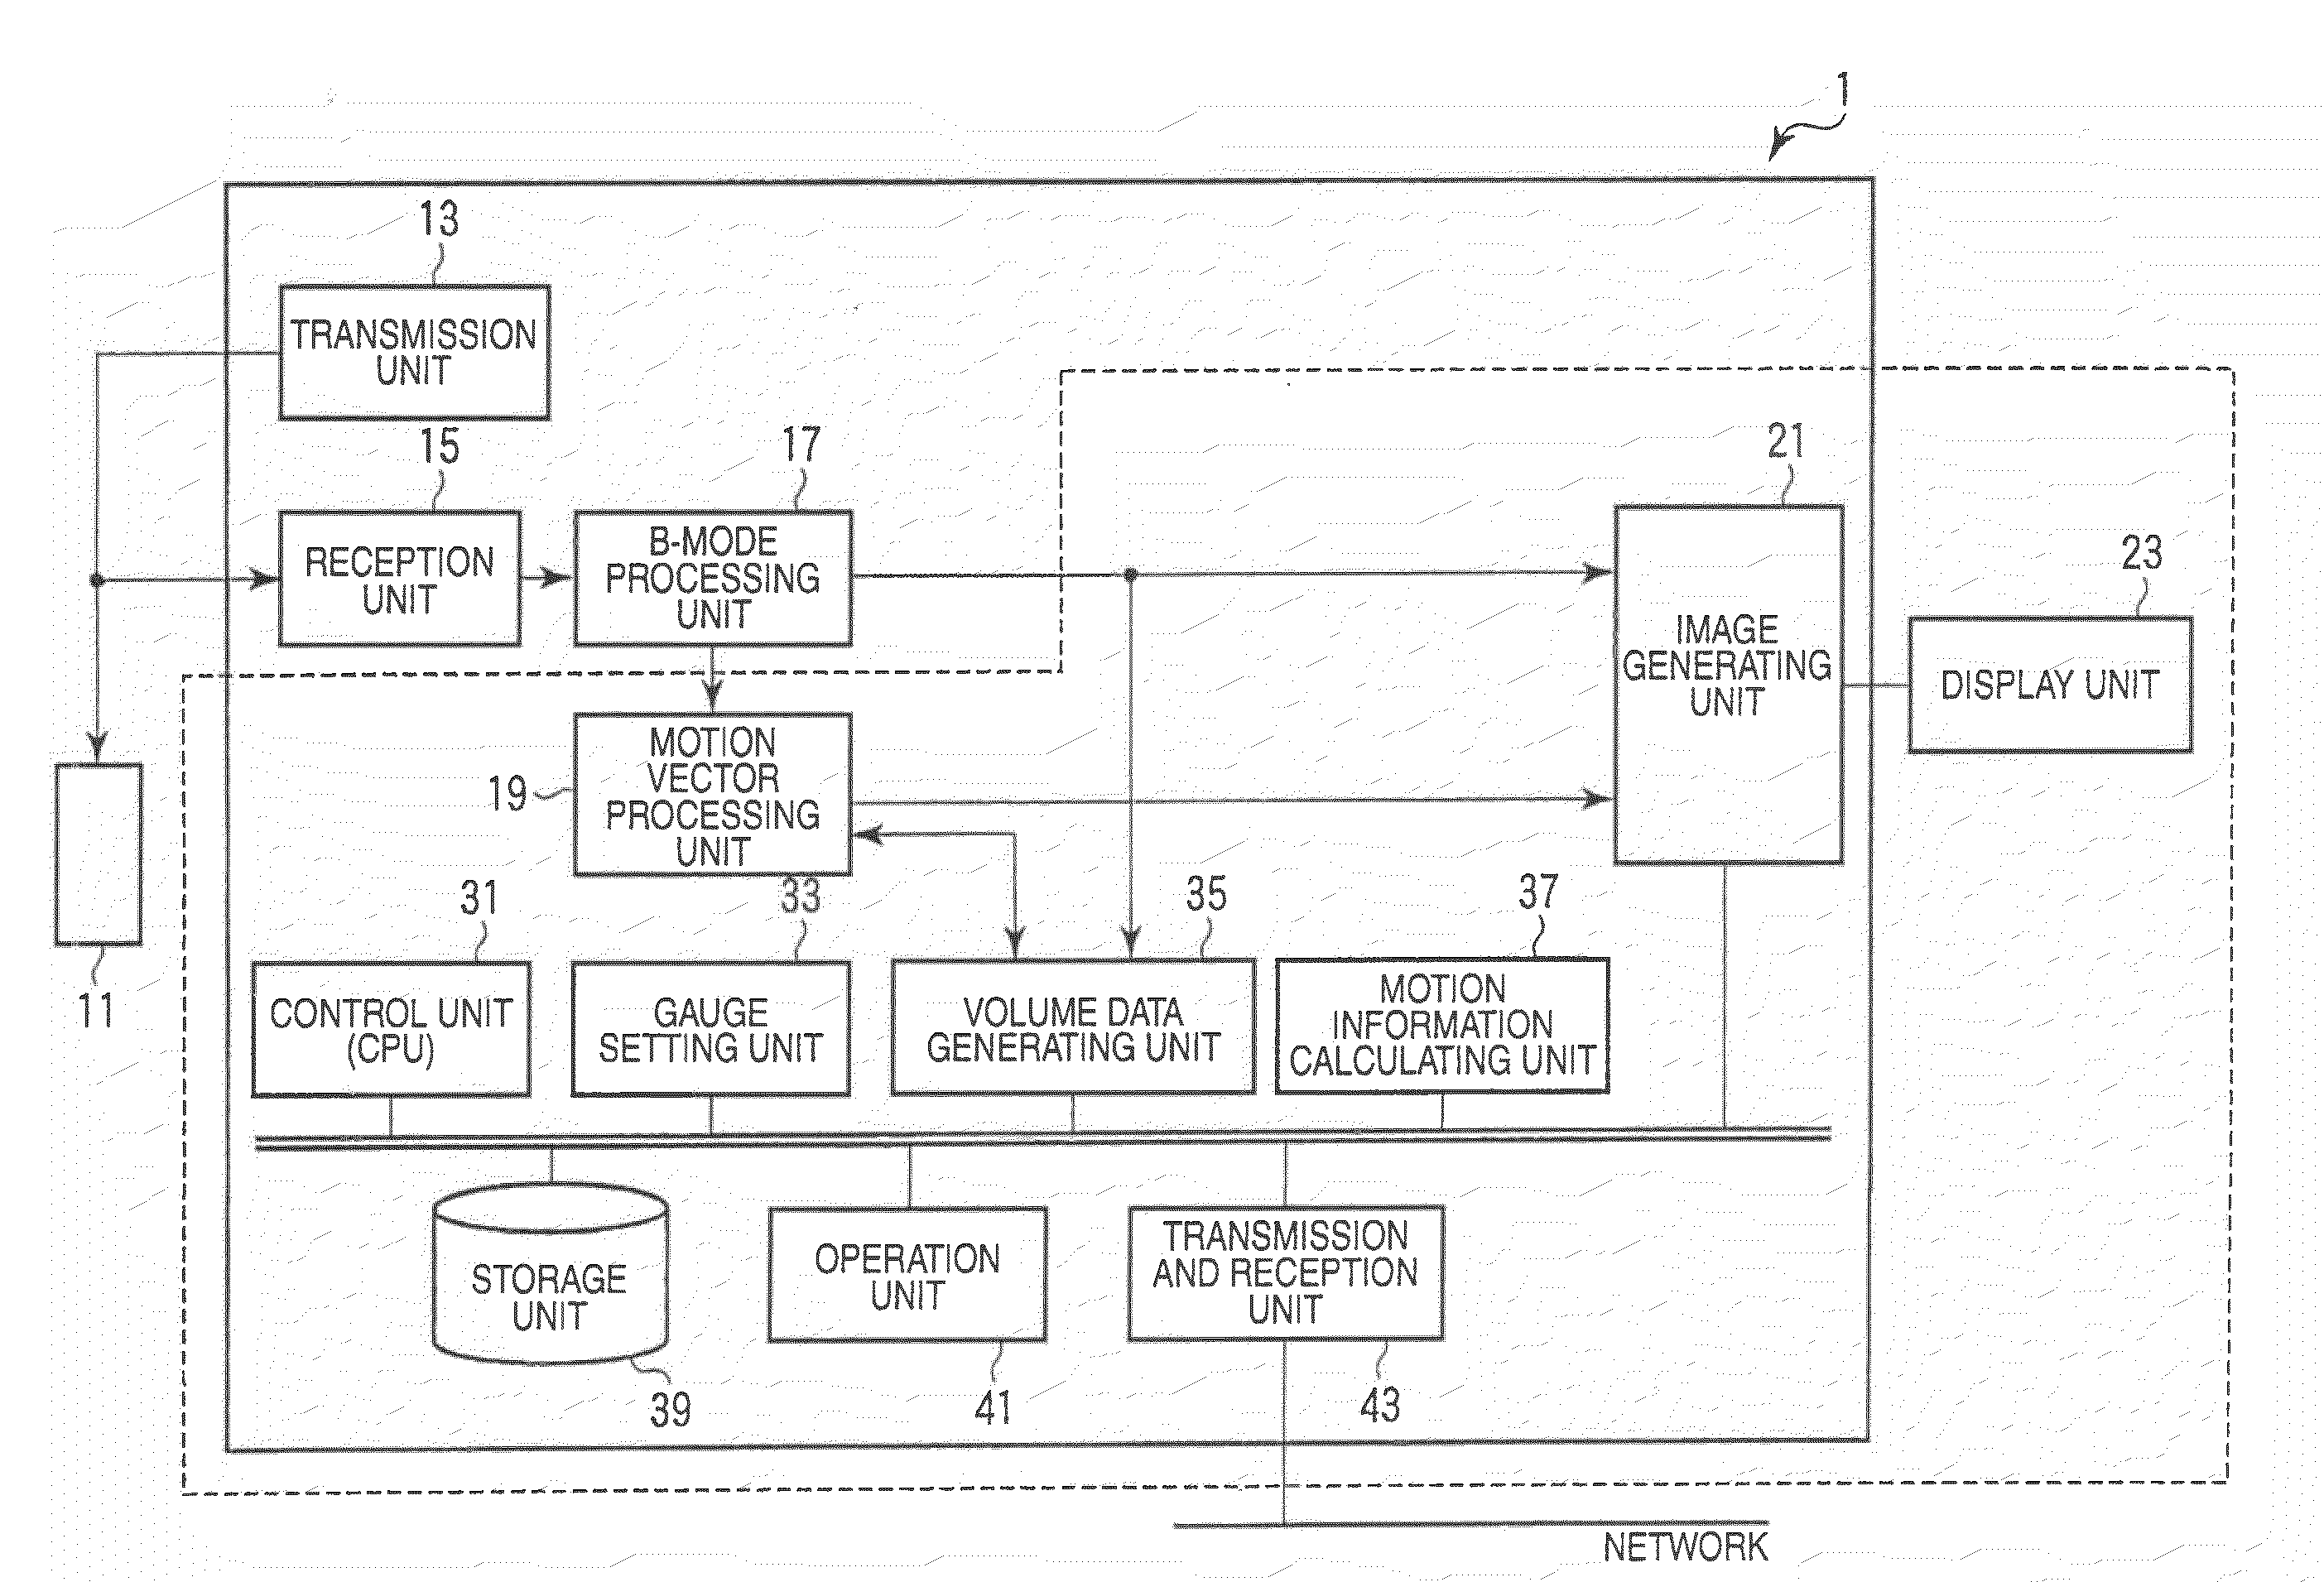
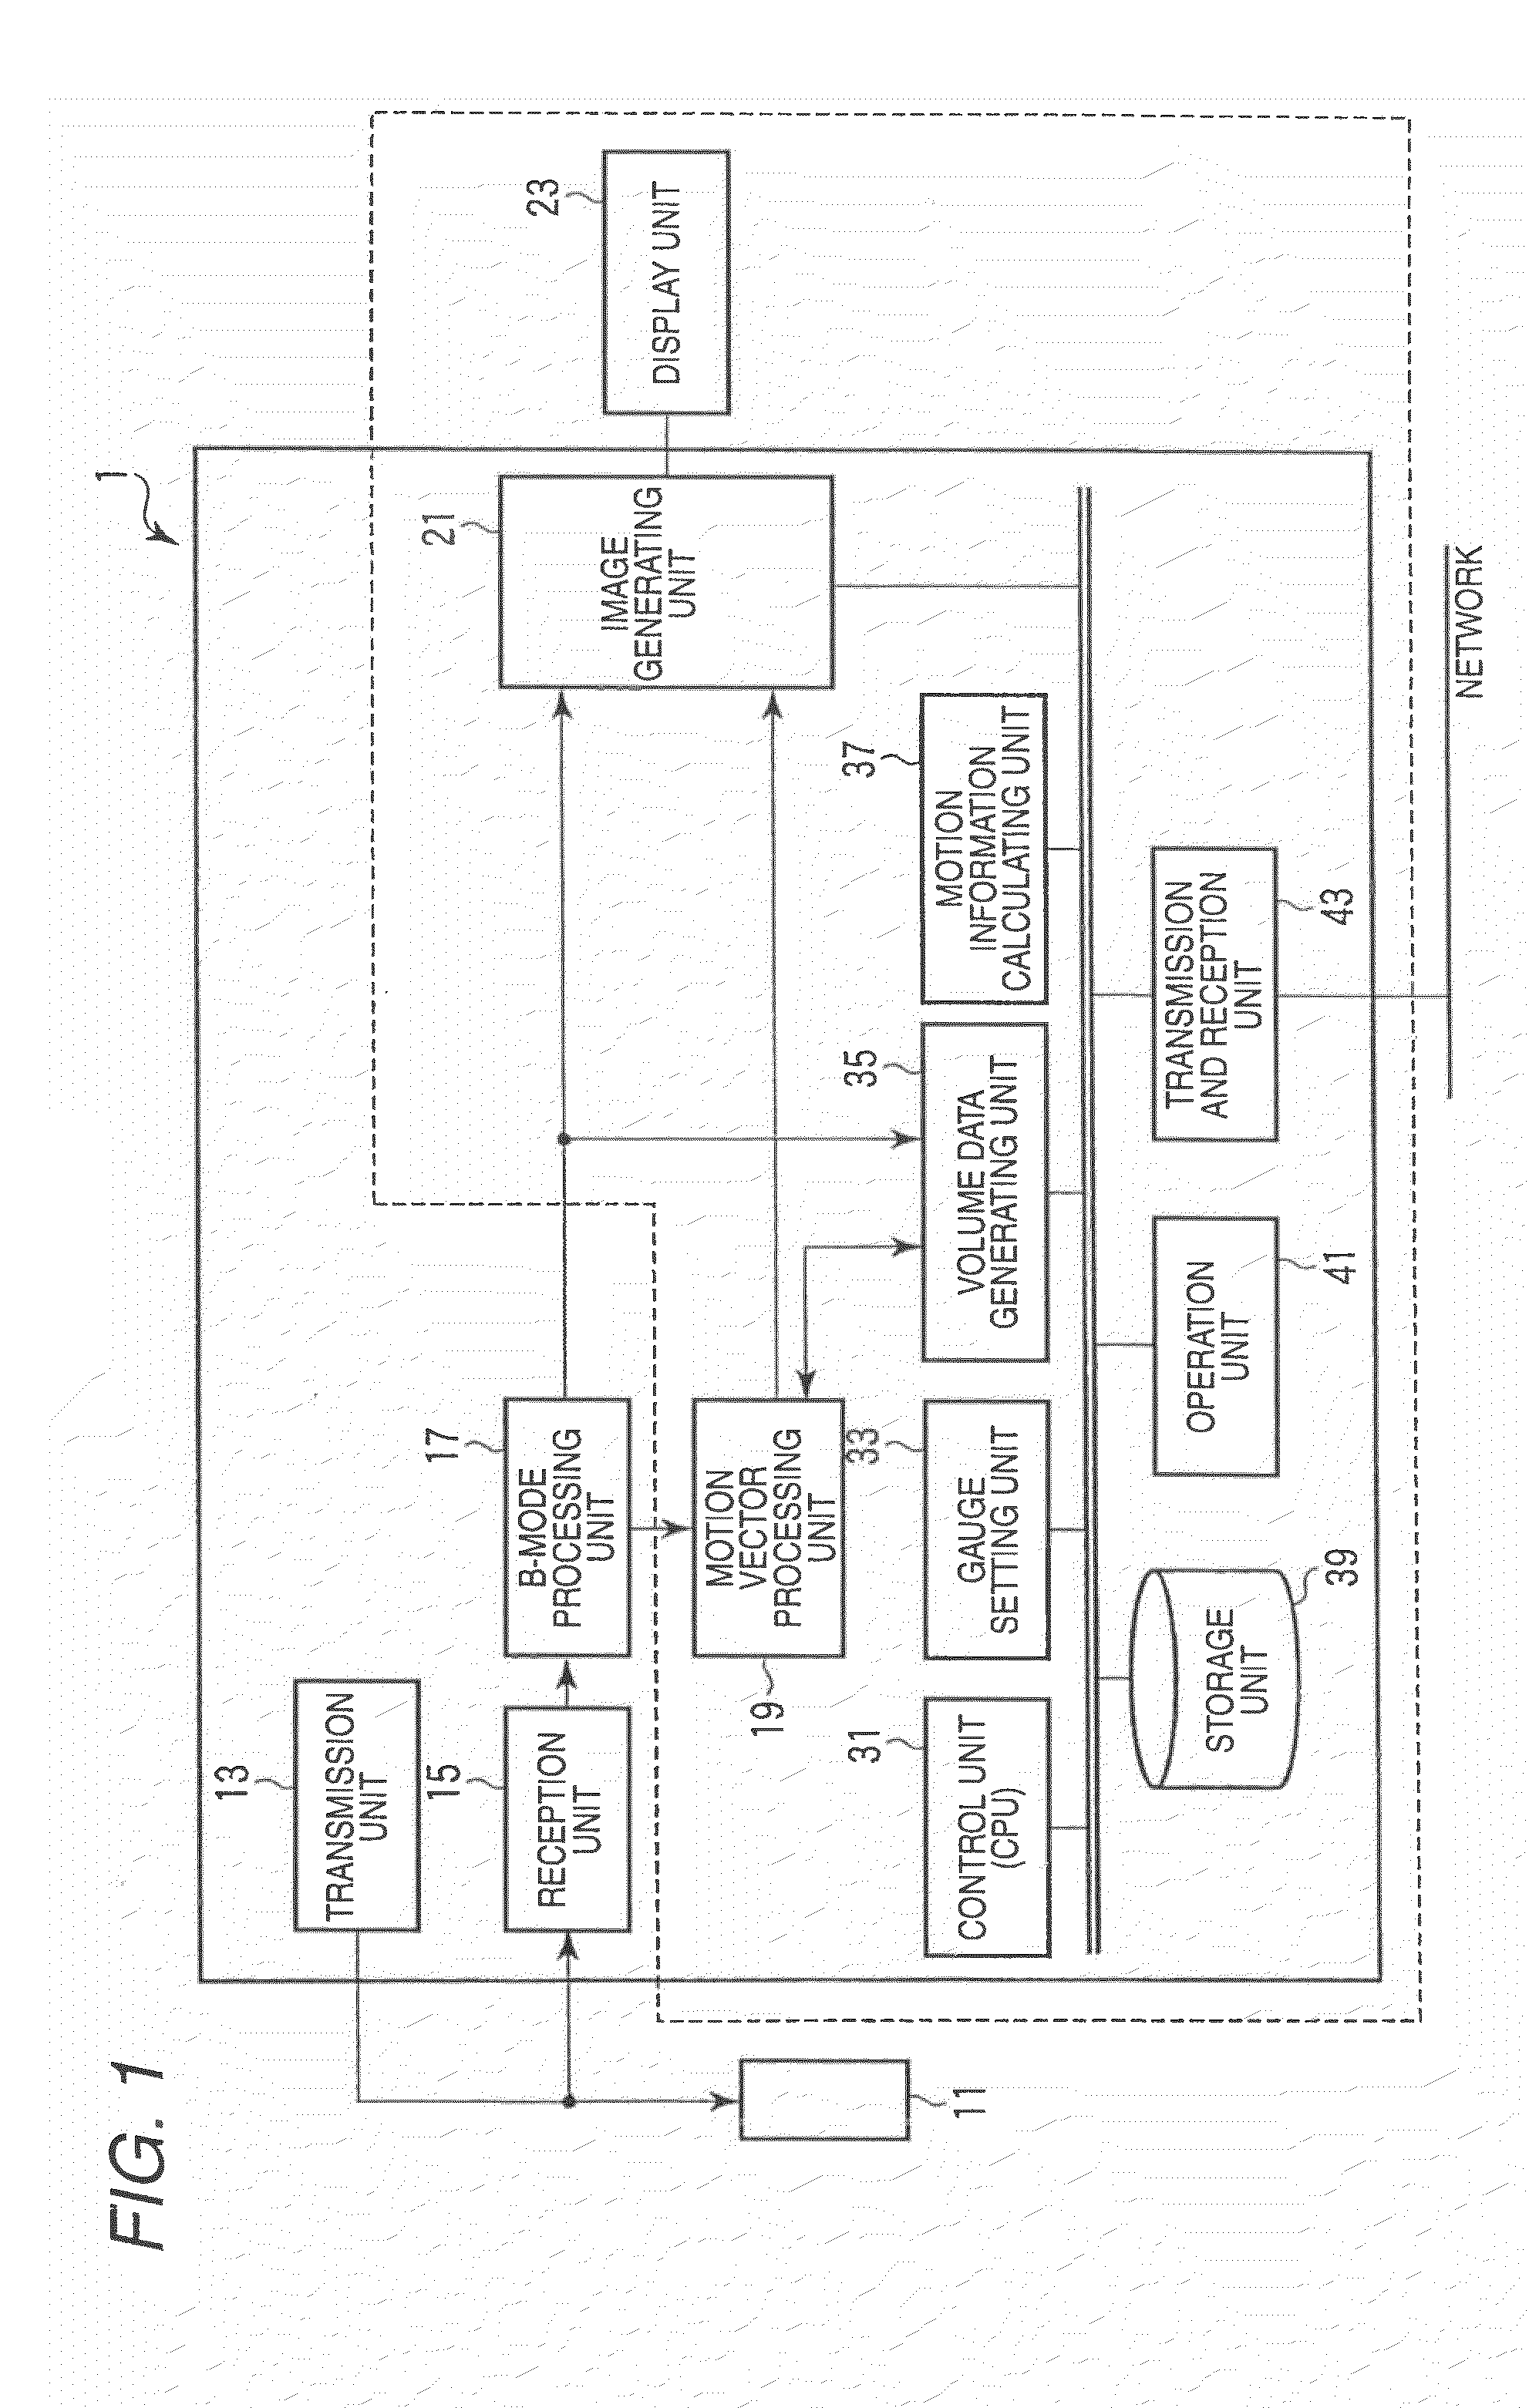
[0050]FIG. 1 is a block diagram illustrating an ultrasonic diagnostic apparatus 1 according to a first embodiment. The ultrasonic diagnostic apparatus 1 includes an ultrasonic probe 11, a transmission unit 13, a reception unit 15, a B-mode processing unit 17, the motion vector processing unit 19, the image generating unit 21, a display unit 23, a control unit (CPU) 31, a volume data generating unit 35, the motion information generating unit 37, the gauge setting unit 38, a storage unit 39, an operation unit 41, and a network transmission and reception unit 43. In addition, in the case of applying the technical idea of the invention to an ultrasonic image processing apparatus, the inside components of a dotted line of FIG. 1 are constituent components of the ultrasonic image processing apparatus, for example.
[0051]The ultrasonic probe 11 generates an ultrasonic wave on the basis of a driving signal from the transmission unit 12 and has a plurality of piezoelectric vibrators that convert reflected waves from a subject body into electric signals, a matching layer provided in the piezoelectric vibrators, a packing material that prevents rearward propagation of an ultrasonic wave from the piezoelectric vibrators, and the like. When an ultrasonic wave is transmitted from the ultrasonic probe 11 to the subject body, various harmonic components are generated with propagation of an ultrasonic wave due to nonlinearity of the body tissue. A fundamental wave and harmonic components which form the transmitted ultrasonic wave are scattered rearward by the boundary of the acoustic impedance of the body tissue, minute scattering, and the like and are received as a reflected wave (echo) in the ultrasonic probe 11.
[0052]The transmission unit 13 has a delay circuit, a pulse circuit, and the like which are not shown. The pulse circuit repeatedly generates a rate pulse for forming a transmitted ultrasonic wave at a predetermined rate frequency fr Hz (period; 1/fr second). In addition, in the delay circuit, a delay time which is required for making ultrasonic waves converge in the beam shape and determining the transmission directivity for every channel is given to each rate pulse. The transmission unit 12 applies a driving pulse to every vibrator, at timing based on the rate pulse, such that an ultrasonic beam is formed toward a predetermined scan line.
[0053]The reception unit 15 has an amplifying circuit, an A/D converter, an adder, and the like which are not shown. The amplifying circuit amplifies an echo signal received through the probe 11 for every channel. The A/D converter gives a delay time, which is required for determining the receiving directivity, to the amplified echo signal, and then the adder performs adding processing. By this addition, an ultrasonic echo signal corresponding to the predetermined scan line is generated.
[0054]The B-mode processing unit 17 generates a B-mode signal corresponding to the amplitude of an ultrasonic echo by performing envelope detection processing on the ultrasonic echo signal received from the reception unit 15.
[0055]The motion vector processing unit 19 detects and tracks the tissue position using pattern matching processing between two frames with different time phases and calculates the displacement of each tissue on the basis of the moved position. Specifically, the motion vector processing unit 19 calculates, for a region of interest on one frame, a corresponding region on another frame which is most similar to the region of interest. The total displacement of the tissue can be defined by accumulating a distance between the region of interest and the corresponding region which estimated by motion vector processing unit. By performing this processing frame by frame at each position on a frame, displacement (motion vector) of each tissue or spatial-temporal distribution data regarding displacement of tissue can be acquired.
[0056]The image generating unit 21 generates a B-mode ultrasonic image showing dimensional distribution related to a predetermined reconstruction of a B-mode signal. In addition, the image generating unit 21 generates a B-mode ultrasonic image, an image regarding motion information of tissue, a superimposed image of the B-mode ultrasonic image and the image regarding motion information of tissue, and the like. Here, the motion information of the tissue is physical information which may be acquired regarding the motion of the tissue other than strain, strain rate, displacement, and velocity of the tissue. Hereinafter, an image including such motion information of the tissue is generally called a ‘motion information image’.
[0057]The display unit 23 displays morphological information or motion information in the body, on the basis of a video signal from the image generating unit 21, as an image in a predetermined form. In addition, the display unit 23 displays markers for supporting matching of the positions between images in the case of displaying a plurality of images.
[0058]The control unit (CPU) 31 has a function as an information processing device (computer) and statically or dynamically controls an operation of a main body of the ultrasonic diagnostic apparatus. In particular, the control unit 31 realizes an arbitrary section tracking function, which will be described later, by loading an exclusive program stored in the storage unit 39 into a memory (not shown).
[0059]The volume data generating unit 35 executes spatial interpolation processing using B-mode data for every frame, which is received from the B-mode processing unit 17, and spatial distribution data of tissue displacement for every time phase, which is received from the motion vector processing unit 19, and generates volume data on a diagnostic subject, which moves periodically, for each time phase regarding the periodic movement. Moreover, in the present embodiment, it is assumed that the volume data generating unit 35 generates volume data using data (so-called raw data) in a preceding stage compared with the image generating unit 21. However, the volume data generating unit 35 may be configured to generate volume data using data (so-called image data) in a subsequent stage compared with the image generating unit 21, without being limited to that described above.
[0060]The motion information calculating unit 37 calculates various kinds of motion information (for example, displacement, velocity, strain, a strain rate, torsion, and a difference of rotation components between endomyocardial and epimyocardial layers) using each coordinate of the tissue for every time phase acquired by the motion vector processing unit 19.
[0061]The gauge setting unit 38 executes processing, such as strain gauge setting to be described later, using the motion vector information output from the motion vector processing unit 19.
[0062]The storage unit 39 is a recording medium, such as a magnetic disk (for example, a floppy (registered trademark) disk or a hard disk), an optical disk (for example, a CD-ROM, a DVD), and a semiconductor memory, and is a device that reads information recorded in these recording media. Transmission and reception conditions, a predetermined scan sequence, raw data and ultrasonic image data (for example, tissue image data photographed in a tissue Doppler mode, a B mode, etc.) corresponding to each time phase, volume data for every time phase generated in the volume data generating unit 35, various kinds of motion information acquired, an exclusive program for realizing a motion vector calculating function, a control program for executing generation and display of a three-dimensional strain gauge image, diagnostic information (for example, a patient ID and doctor's opinion), a diagnostic protocol, a body mark generating program, and the like are stored in the storage unit 39.
[0063]The operation unit 41 is connected to the main body of the apparatus and has a mouse or a trackball, a mode switch, a keyboard, and the like for importing to the main body of the apparatus various instructions from an operator, such as an instruction for setting a region of interest (ROI) and an instruction for setting various conditions on the image quality, designation of a reference time phase in arbitrary section tracking processing, setting of an arbitrary section in the reference time phase, and the like.
[0064]The transmission and reception unit 43 is a device which transmits information to another apparatus or receives information from another apparatus through a network. Data or an analysis result of an ultrasonic image obtained in the ultrasonic diagnostic apparatus 1 may be transmitted to another apparatus through the network by the transmission and reception unit 43.
[0065](Function of generation and display of a three-dimensional strain gauge image)
[0066]Next, a function of generation and display of a three-dimensional strain gauge image that the ultrasonic diagnostic apparatus 1 has will be described. This function is to generate a line segment (gauge) for visually showing the reigional strain of the cardiac muscle and to display it at the corresponding position on an ultrasonic image in a three-dimensional manner.
[0067]Moreover, in the present embodiment, a motion information generating function when a diagnostic subject is the heart will be described as an example in order to make a specific explanation. However, a subject to which the motion information generating function is applied is not limited to the heart, and the motion information generating function may be applied to any part as long as the part substantially moves periodically.
[0068]FIG. 2 is a flow chart illustrating the flow of processing (processing for generating and displaying a three-dimensional strain gauge image) based on the function of generation and display of a three-dimensional strain gauge image. Hereinafter, an explanation will be made with reference to FIG. 2.
[0069][Step S1: Data Collection]
[0070]First, for a desired observation portion of the heart of a certain patient, time-series three-dimensional image data (volume data; hereinafter, referred to as a ‘time-series volume data group’) is collected over a period of at least one cardiac beat using a predetermined time as a reference time (step S1). In addition, the volume data collection method is not particularly limited to one method. For example, volume scan may be performed using any one of a one-dimensional array probe with mechanical scan or a two-dimensional array probe. Alternatively, it may be possible to use three-dimensional triggered scan of generating volume data regarding a desired range by connecting sub-volume data regarding a small region, which was collected in synchronization with ECG, on the basis of a matched trigger and of sequentially updating the sub-volume data according to time information.
[0071][Step S2: Calculation Processing of Motion Vector Information]
[0072]Next, motion vector information of tissue in each time phase is generated (step S2). That is, the motion vector processing unit 19 calculates spatial-temporal motion vector information by extracting a region of interest of a myocardial portion from volume data in predetermined time phase, among volume data corresponding to each time phase of one or more cardiac beats which forms a time-series volume data group collected, in response to the user's instruction or the like and by tracking the extracted region of interest temporally by three-dimensional pattern matching processing (speckle tracking processing: ST processing).
[0073][Step S3: Generation of a Three-Dimensional Strain Gauge Image]
[0074]Then, processing for generating a three-dimensional strain gauge image is executed (step S3).
[0075]FIG. 3 is a flow chart illustrating the flow of processing executed to generate a strain gauge image. As shown in FIG. 3, the gauge setting unit 36 sets a predetermined number of (for example, about tens of) strain gauges for an ultrasonic image corresponding to the time phase (for example, time phase of end-systole as a reference time phase) as a reference (step S3a).
[0076]That is, the gauge setting unit 36 displays five MPR images of two B-mode images (apical four-chamber image: 4C, apical two-chamber image: 2C) and three C-mode images (apical level: A (Apical), middle level: M (Mid), basal level: B (Basal); hereinafter, apical level: A (Apical), middle level: M (Mid), and basal level: B (Basal) are simply referred to as A plane, M plane, and B plane, respectively), for example, sets the initial outline at positions of endomyocardial and epimyocardial layers on each MPR image in the time phase of end-systole, and sets one sides of a number of gauge endpoints set beforehand at predetermined distances (or at equal angles with the center of gravity of the endomyocardial layer as the center) on the initial outline. In addition, the gauge setting unit 36 sets a plurality of strain gauges by setting the positions, at which the normal vector with respect to the endomyocardial layer surface at one side of each gauge endpoint on the initial outline crosses the epimyocardial layer, as other sides of the gauge endpoints and connecting the gauge endpoints with each other as a line segment (strain gauge) along the normal vector.
[0077]Then, the gauge setting unit 36 sets each strain gauge for volume data in another time phase by using motion vector information and each strain gauge set in the reference time phase (step S3b). That is, the gauge setting unit 36 sets each corresponding strain gauge on volume data in each time phase by tracking a gauge endpoint, which forms each strain gauge set in the reference time phase, using the motion vector information.
[0078]Then, the image generating unit 21 generates a strain gauge image for every time phase, in which each strain gauge is disposed at a corresponding position of the ultrasonic image, by rendering processing or the like. (step S3c).
[0079][Step S4: Display of a Strain Gauge Image]
[0080]Then, the display unit 23 displays a three-dimensional strain gauge image in a predetermined form (step S4).
[0081]FIG. 4 is a view illustrating an example of a three-dimensional strain gauge image displayed on the display unit 23. On a three-dimensional strain gauge image 50 shown in FIG. 4, strain gauges set for the five MPR images of two planes (4C, 2C) of a B-mode image and three planes (A plane, M plane, B plane) of a C-mode image in the reference time phase are displayed sparsely so that they are easily observed among a plurality of strain gauges set within a region of interest of the myocardium.
[0082]In the case of displaying the three-dimensional strain gauge image 50 continuously with time-series, each strain gauge of the three-dimensional strain gauge image 50 exists within each plane of the five MPR images (that is, 4C plane, 2C plane, A plane, M plane, and B plane) in the reference time phase, while the strain gauge of the three-dimensional strain gauge image 50 may arbitrarily protrude from the planes of the five MPR images according to the movement of the tissue in subsequent time phase. Accordingly, in the example shown in FIG. 4, recognition of the anatomical orientation is realized by displaying the three-dimensional strain gauge image 50 in each time phase while showing the positions of the five MPR images in the reference time phase so that the correspondence relationship between each strain gauge on the three-dimensional strain gauge image 50 in each time phase and each strain gauge on the five MPR images in the reference time phase can be easily understood.
[0083]In addition, a number of strain gauges may be displayed in high density in a three-dimensional space of the myocardium, for example, without being limited to the example of FIG. 4. However, if easiness in understanding the anatomical orientation or an adverse effect in which displays of strain gauges are interfered with each other so as to be difficult to be seen is taken into consideration, it can be said that the example of FIG. 4 is preferable.
[0084]Moreover, three-dimensional strain gauges may be selectively displayed. For example, as shown in FIG. 5, it is possible to generate a three-dimensional strain gauge image 51, in which only strain gauges set on the 4C and 2C planes in the reference time phase are extracted, and to display the three-dimensional strain gauge image 51 together with a 4C-plane image and a 2C-plane image in the reference time phase. In addition, a three-dimensional strain gauge image 52 in which only a strain gauge set on the 4C-plane image in the reference time phase is extracted is displayed in FIG. 6 together with a corresponding MPR image in the reference time phase. A three-dimensional strain gauge image 53 in which only a strain gauge set on the 2C-plane image in the reference time phase is extracted is displayed in FIG. 7 together with a corresponding MPR image in the reference time phase. A three-dimensional strain gauge image 54 in which strain gauges set on the A-plane image, M-plane image, and B-plane image in the reference time phase are extracted is displayed in FIG. 8 together with a corresponding MPR image in the reference time phase. A three-dimensional strain gauge image 55 in which a strain gauge set on the A-plane image in the reference time phase is extracted is displayed in FIG. 9 together with a corresponding MPR image in the reference time phase. A three-dimensional strain gauge image 56 in which a strain gauge set on the M-plane image in the reference time phase is extracted is displayed in FIG. 10 together with a corresponding MPR image in the reference time phase. A three-dimensional strain gauge image 57 in which a strain gauge set on the B-plane image in the reference time phase is extracted is displayed in FIG. 11 together with a corresponding MPR image in the reference time phase.
[0085]According to the configuration described above, the following effects can be obtained.
[0086]In the ultrasonic diagnostic apparatus, a plurality of strain gauges defined by gauge endpoints are set in each time phase using motion vector information of the tissue and a three-dimensional strain gauge image, in which each strain gauge is disposed at the three-dimensional position corresponding to an ultrasonic image in each time phase, is generated and displayed. The observer can intuitively see not only a change in distance between endomyocardial and epimyocardial layers (change in wall thickness) but also a difference of rotation or displacement between the endomyocardial and epimyocardial layers by observing the three-dimensional strain gauge image displayed. Particularly by observing the three-dimensional behavior of a three-dimensional strain gauge, a situation of wall movement of the heart having a three-dimensional structure can be expressed in a form closer to the actual condition. As a result, the movement which could not be seen in the related art can be checked.

Example

Second Embodiment
[0087]Next, a second embodiment of the invention will be described. An ultrasonic diagnostic apparatus according to the present embodiment serves to generate and display a three-dimensional strain gauge image with an object to be subjected to speckle tracking processing as a strain gauge between endomyocardial and epimyocardial layers of the heart.
[0088]FIG. 12 is a flow chart illustrating the flow of processing for generating and displaying a three-dimensional strain gauge image in the second embodiment. Hereinafter, details of the processing in each step will be described.
[0089][Step S11: Data Collection]
[0090]First, similar to step S1, a time-series volume data group is collected (step S11).
[0091][Step S12: Setting of Arbitrary Section and Strain Gauge]
[0092]Then, a plurality of arbitrary sections are set for volume data in a reference time phase, and a strain gauge is set between endomyocardial and epimyocardial layers of the heart on each section (step S12). That is, in reference time phase t0 (for example, time phase of end-diastole or time phase of end-systole) of a period T, for example, three sections of B, M, and A planes are set and a strain gauge is set between the endomyocardial and epimyocardial layers existing on an MPR image corresponding to each section.
[0093]Moreover, setting of arbitrary sections for volume data in the reference time phase may be automatically executed using a device or may be manually executed by an operator's input using the operation unit 41. Moreover, for example, the method of step S3a may be used as a method of setting a strain gauge.
[0094][Step S13: Calculation Processing of Motion Vector Information]
[0095]Then, the motion vector processing unit 19 calculates motion vector information for every time phase by tracking each section and strain gauge set in the reference time phase t0 by speckle tracking processing and sets each corresponding section for volume data of remaining time phases (that is, each time phase other than the reference time phase t0 in the period T) in which sections and strain gauged were not set in step S12 (step S31).
[0096]Moreover, a specific method of tracking an arbitrary section will be described below according to examples.

Example

FIRST EXAMPLE
[0097]In a tracking method of this example, a motion component V is calculated by projecting a motion vector at each position of the tissue, which exists on each section, in the normal direction and averaging them and arbitrary sections and strain gauges in each time phase are tracked using the motion component V.
[0098]FIG. 13 is a flow chart illustrating the flow of calculation processing of motion vector information in step S13. As shown in FIG. 13, first, a motion component V=Vz, meant(to) in the reference time phase t0 is calculated by averaging only a normal direction component Vz (projected component in the normal direction) of the motion vector of each myocardium (that is, each position of the tissue included in each plane) on each of the B, M, and A planes set for volume data in the reference time phase (step S13a).
[0099]Then, each of the B, M, and A planes set in the reference time phase is moved in parallel by the motion component V=Vz, meant(t0) along the normal direction to thereby set a heart region included in each of the B, M, and A planes after movement as an arbitrary section in a time phase t1 and set a corresponding strain gauge (step S13b).
[0100]Then, a motion component V=Vz, meant(ti) in a time phase ti (where, ‘i’ is an integer satisfying 2≦i≦n) is calculated by averaging only a normal direction component of the motion vector of each myocardium on each of the B, M, and A planes in the time phase ti (step S13c).
[0101]Then, each of the B, M, and A planes in the time phase ti is moved in parallel by the motion component V=Vz, meant(ti) along the normal direction to thereby set the B, M, and A planes and corresponding strain gauges in the time phase ti (step S13d).
[0102]Then, B, M, and A planes and strain gauges in each time phase can be tracked by sequentially repeating the processing of steps S13c and S13d in a time-series manner until a time phase tn.
[0103]For the B, M, and A planes and the strain gauges tracked by the above-described method in the first example, the positions after movement are detected using the motion component V calculated by averaging only the normal direction component of each position (each myocardium) on each plane. Accordingly, in the method of this example, B, M, and A planes in each time phase are parallel to B, M, and A planes set in the reference time phase, respectively.

PUM

no PUM

Description & Claims & Application Information

We can also present the details of the Description, Claims and Application information to help users get a comprehensive understanding of the technical details of the patent, such as background art, summary of invention, brief description of drawings, description of embodiments, and other original content. On the other hand, users can also determine the specific scope of protection of the technology through the list of claims; as well as understand the changes in the life cycle of the technology with the presentation of the patent timeline. Login to view more.
Why Eureka
Try Eureka