Techniques for Thermal Modeling of Data Centers to Improve Energy Efficiency

a data center and thermal modeling technology, applied in the field of data centers, can solve the problems of difficult cooling of data center or telecommunications room densely packed systems, ineffective cooling of equipment, and the application of ns-cfd modeling to data center can be somewhat problemati

Inactive Publication Date: 2009-12-31
GLOBALFOUNDRIES INC
View PDF15 Cites 123 Cited by
  • Summary
  • Abstract
  • Description
  • Claims
  • Application Information

AI Technical Summary

Problems solved by technology

The heat dissipated by today's computing equipment is reaching levels that make it very challenging to cool these systems in densely packed data centers or telecommunications rooms.
Without a proper layout in the data center, costly inefficiencies in the cooling system inevitably occur, and can potentially result in ineffective cooling of the equipment.
There can be, however, several potential problems associated with NS-CFD modeling of a data center.
First, while NS-CFD modeling has been successfully deployed for the design of very well-defined structures, such as air plane wings, the application of NS-CFD modeling to data centers can be somewhat problematic because input data needed for NS-CFD modeling is often not available and / or is inaccurate.
Namely, every data center is different and a current inventory list is often not available for each data center (further, heterogeneous technology may be used within a given data center, e.g., computer equipment from different vendors and / or of different vintages), available data (e.g., name-plate power and flow data) generally does not reflect actual usage, air flow is very difficult and time-consuming to accurately measure and characterize (and often does not capture room effects such as drafts).
In all, it could easily take one person at least one week to survey a 5,000 square foot data center, which is an overly time-consuming process.
Second, a data center NS-CFD model can be difficult to generate and typically requires a detailed survey of the data center, which is a time consuming and costly process (as described above).
However, even if a complicated NS-CFD model has been built, there is very little confidence that it actually gives dependable insights, because, as described above, the input data for the NS-CFD model is often not available and / or does not accurately represent the data center.
Third, the calculations involved are time-consuming (slow) and besides many assumptions, which are intrinsically built into these NS-CFD models (i.e., with CFD and other related models such as the k-epsilon turbulence model, uniform air flow rate through server rack and uniform volumetric heat generation inside of the server rack are assumed) such models cannot readily include spatial and temporal variability in the workload, as well as other unknowns, because the pure computation time of these models is quite significant.
Fourth, existing data center NS-CFD models cannot easily be used to optimize data center layout.
Namely, there is no systematic strategy for changing inputs to the model based on measurements.
Rather, data center optimization is done today rather unscientifically “by hand” playing a few what-ifs, e.g., where an engineer looks at results and uses his / her intuition to adjust the model.

Method used


Image

  • Techniques for Thermal Modeling of Data Centers to Improve Energy Efficiency
  • Techniques for Thermal Modeling of Data Centers to Improve Energy Efficiency
  • Techniques for Thermal Modeling of Data Centers to Improve Energy Efficiency

Examples


Embodiment Construction

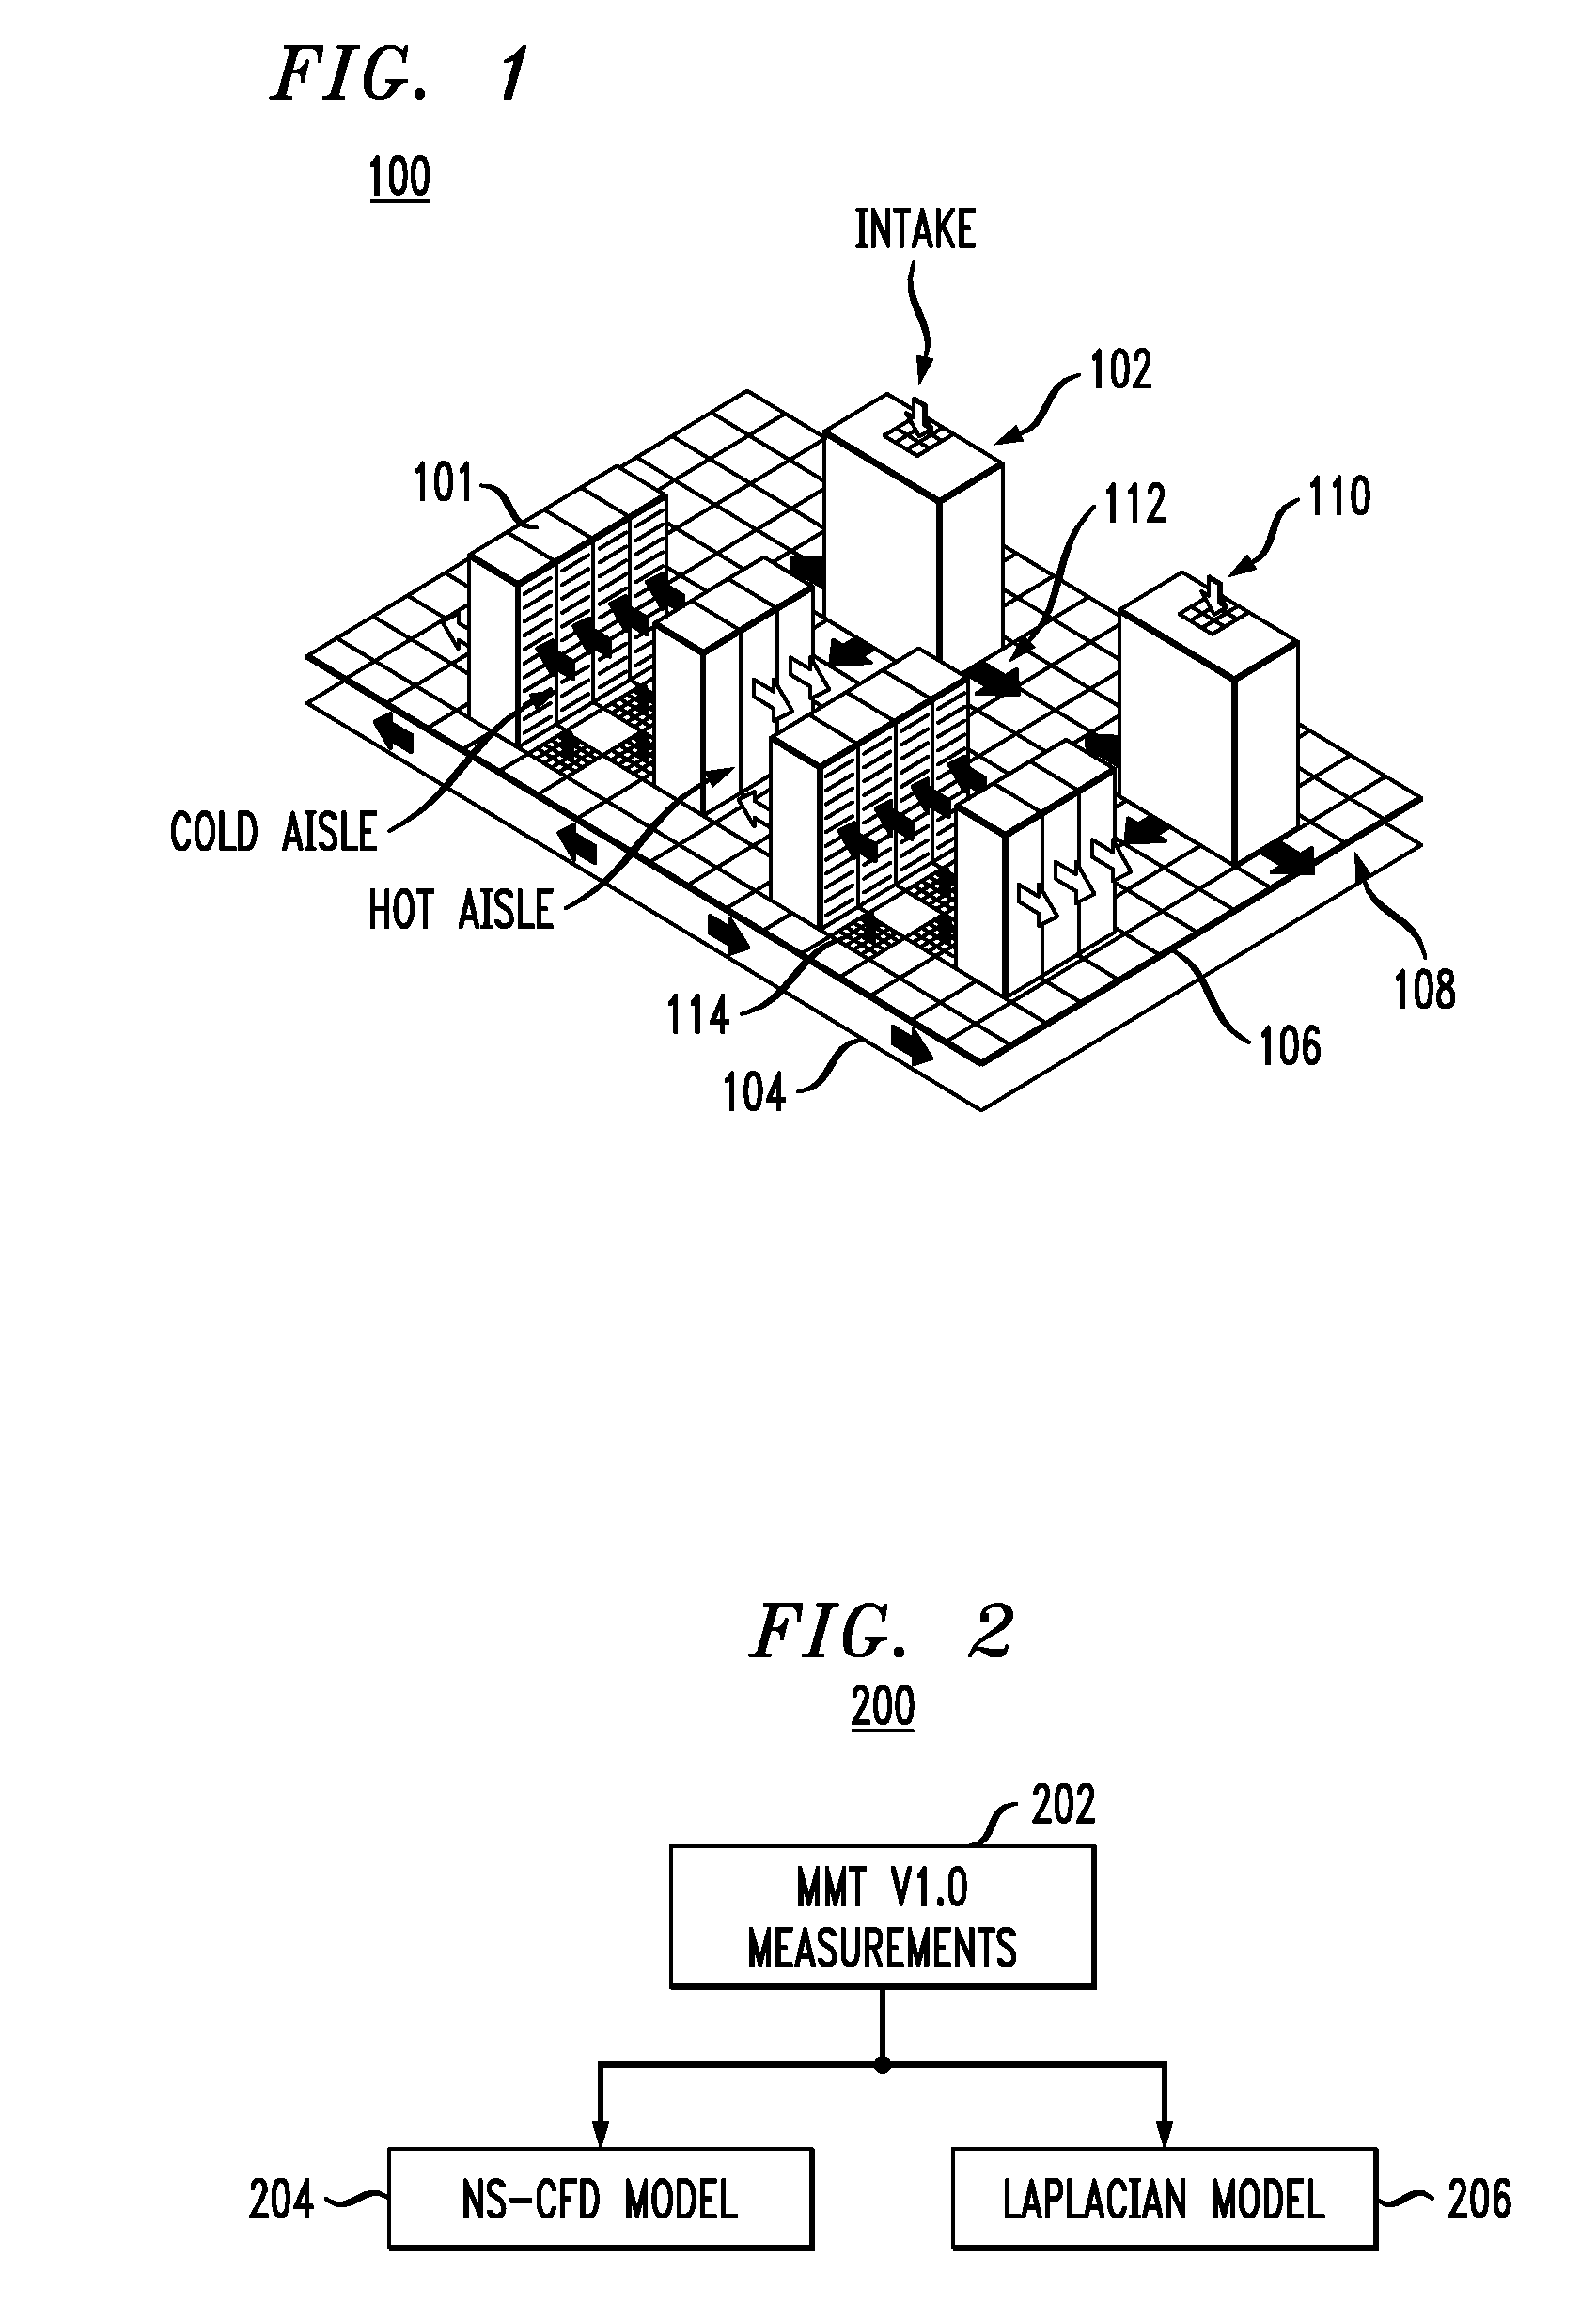
[0023]FIG. 1 is a diagram illustrating exemplary data center 100. Data center 100 has information technology (IT) racks 101 and a raised-floor cooling system with air conditioning units (ACUs) 102 (also referred to herein as computer room air conditioners (CRACs), see below) that take hot air in (typically from above through one or more air returns in the CRACs) and exhaust cooled air into a sub-floor plenum below. Hot air flow through data center 100 is indicated by light arrows 110 and cooled air flow through data center 100 is indicated by dark arrows 112.

[0024]In FIG. 1, IT racks 101 use front-to-back cooling and are located on raised-floor 106 with sub-floor 104 beneath. Namely, according to this scheme, cooled air is drawn in through a front (inlet) of each rack and warm air is exhausted out from a rear (outlet) of each rack. The cooled air drawn into the front of the rack is supplied to air inlets of each IT equipment component (servers for example) therein. Space between rai...


PUM


Abstract

Techniques for modeling a data center are provided. In one aspect, a method for modeling a data center is provided. The method comprises the following steps. Spatially dense three-dimensional thermal distribution and air flow measurements made in the data center using a mobile off-line surveying system are obtained. A temperature and air flow model for the data center is created using the spatially dense three-dimensional thermal distribution and air flow measurements. The temperature and air flow model is used to make thermal distribution and air flow predictions of the data center. The thermal distribution and air flow predictions are compared with the thermal distribution and air flow measurements made using the mobile off-line surveying system to produce a validated model for the data center.

Description

CROSS-REFERENCE TO RELATED APPLICATIONS[0001]This application is related to the commonly owned U.S. application Ser. No. ______, entitled “Techniques to Predict Three-Dimensional Thermal Distributions in Real-Time,” designated as Attorney Reference No. YOR920080115US1, filed herewith on the same day of ______, the contents of which are incorporated by reference herein.FIELD OF THE INVENTION[0002]The present invention relates to data centers, and more particularly, to techniques for modeling data centers.BACKGROUND OF THE INVENTION[0003]The heat dissipated by today's computing equipment is reaching levels that make it very challenging to cool these systems in densely packed data centers or telecommunications rooms. In data centers, the computing equipment, such as a multitude of computer servers, are commonly placed in a series of racks arranged in a series of aisles in the data center. Typically, a data center has a cooling system that, e.g., by way of one or more air conditioning u...

Claims


Application Information

Patent Timeline
Patent Type & Authority Applications(United States)
IPC IPC(8): G06F17/10G06G7/56
CPCG06F1/206H05K7/20836G06F17/5009G06F17/5004G06F2217/80Y02B60/1275G06F30/13G06F2119/08Y02D10/00
Inventor HAMANN, HENDRIK F.IYENGAR, MADHUSUDAN K.KESSEL, THEODORE G. VAN
Owner GLOBALFOUNDRIES INC
Why Eureka
Try Eureka