Abnormality detection method, device and program

a technology of abnormality detection and detection method, applied in the field of abnormality detection technique, can solve the problems of system performance data fluctuation, erroneous abnormality detection, and erroneous abnormality detection, and achieve the effect of improving the accuracy of abnormality detection and less tim

Inactive Publication Date: 2011-02-03
HITACHI LTD
View PDF19 Cites 64 Cited by
  • Summary
  • Abstract
  • Description
  • Claims
  • Application Information

AI Technical Summary

Benefits of technology

[0021]According to the present invention, it is possible to carry out abnormality determination taking into consideration events which take place without temporal periodicity and which are supposed to characteristically affect the process being performed. The results in improving the accuracy of abnormality detection represented, for example, by reproducibility and the goodness of fit. So far, when errone

Problems solved by technology

Therefore, if a normal event unexpectedly takes place at the specific time causing the load on the system to change, erroneous abnormality detection may result.
Therefore, if, while the periodicity is followed, a normal event unexpectedly takes place causing the system performance data to fluctuate, erroneous abnormality detection may result.
When the system configuration or environment subsequently changes, however, such an exceptional performance change pattern may come to really represent abnormality, that is, an abnormality detection error may result.
Thus, model data generated based only on time or periodicity is not always appropriat

Method used


Image

  • Abnormality detection method, device and program
  • Abnormality detection method, device and program
  • Abnormality detection method, device and program

Examples


first embodiment

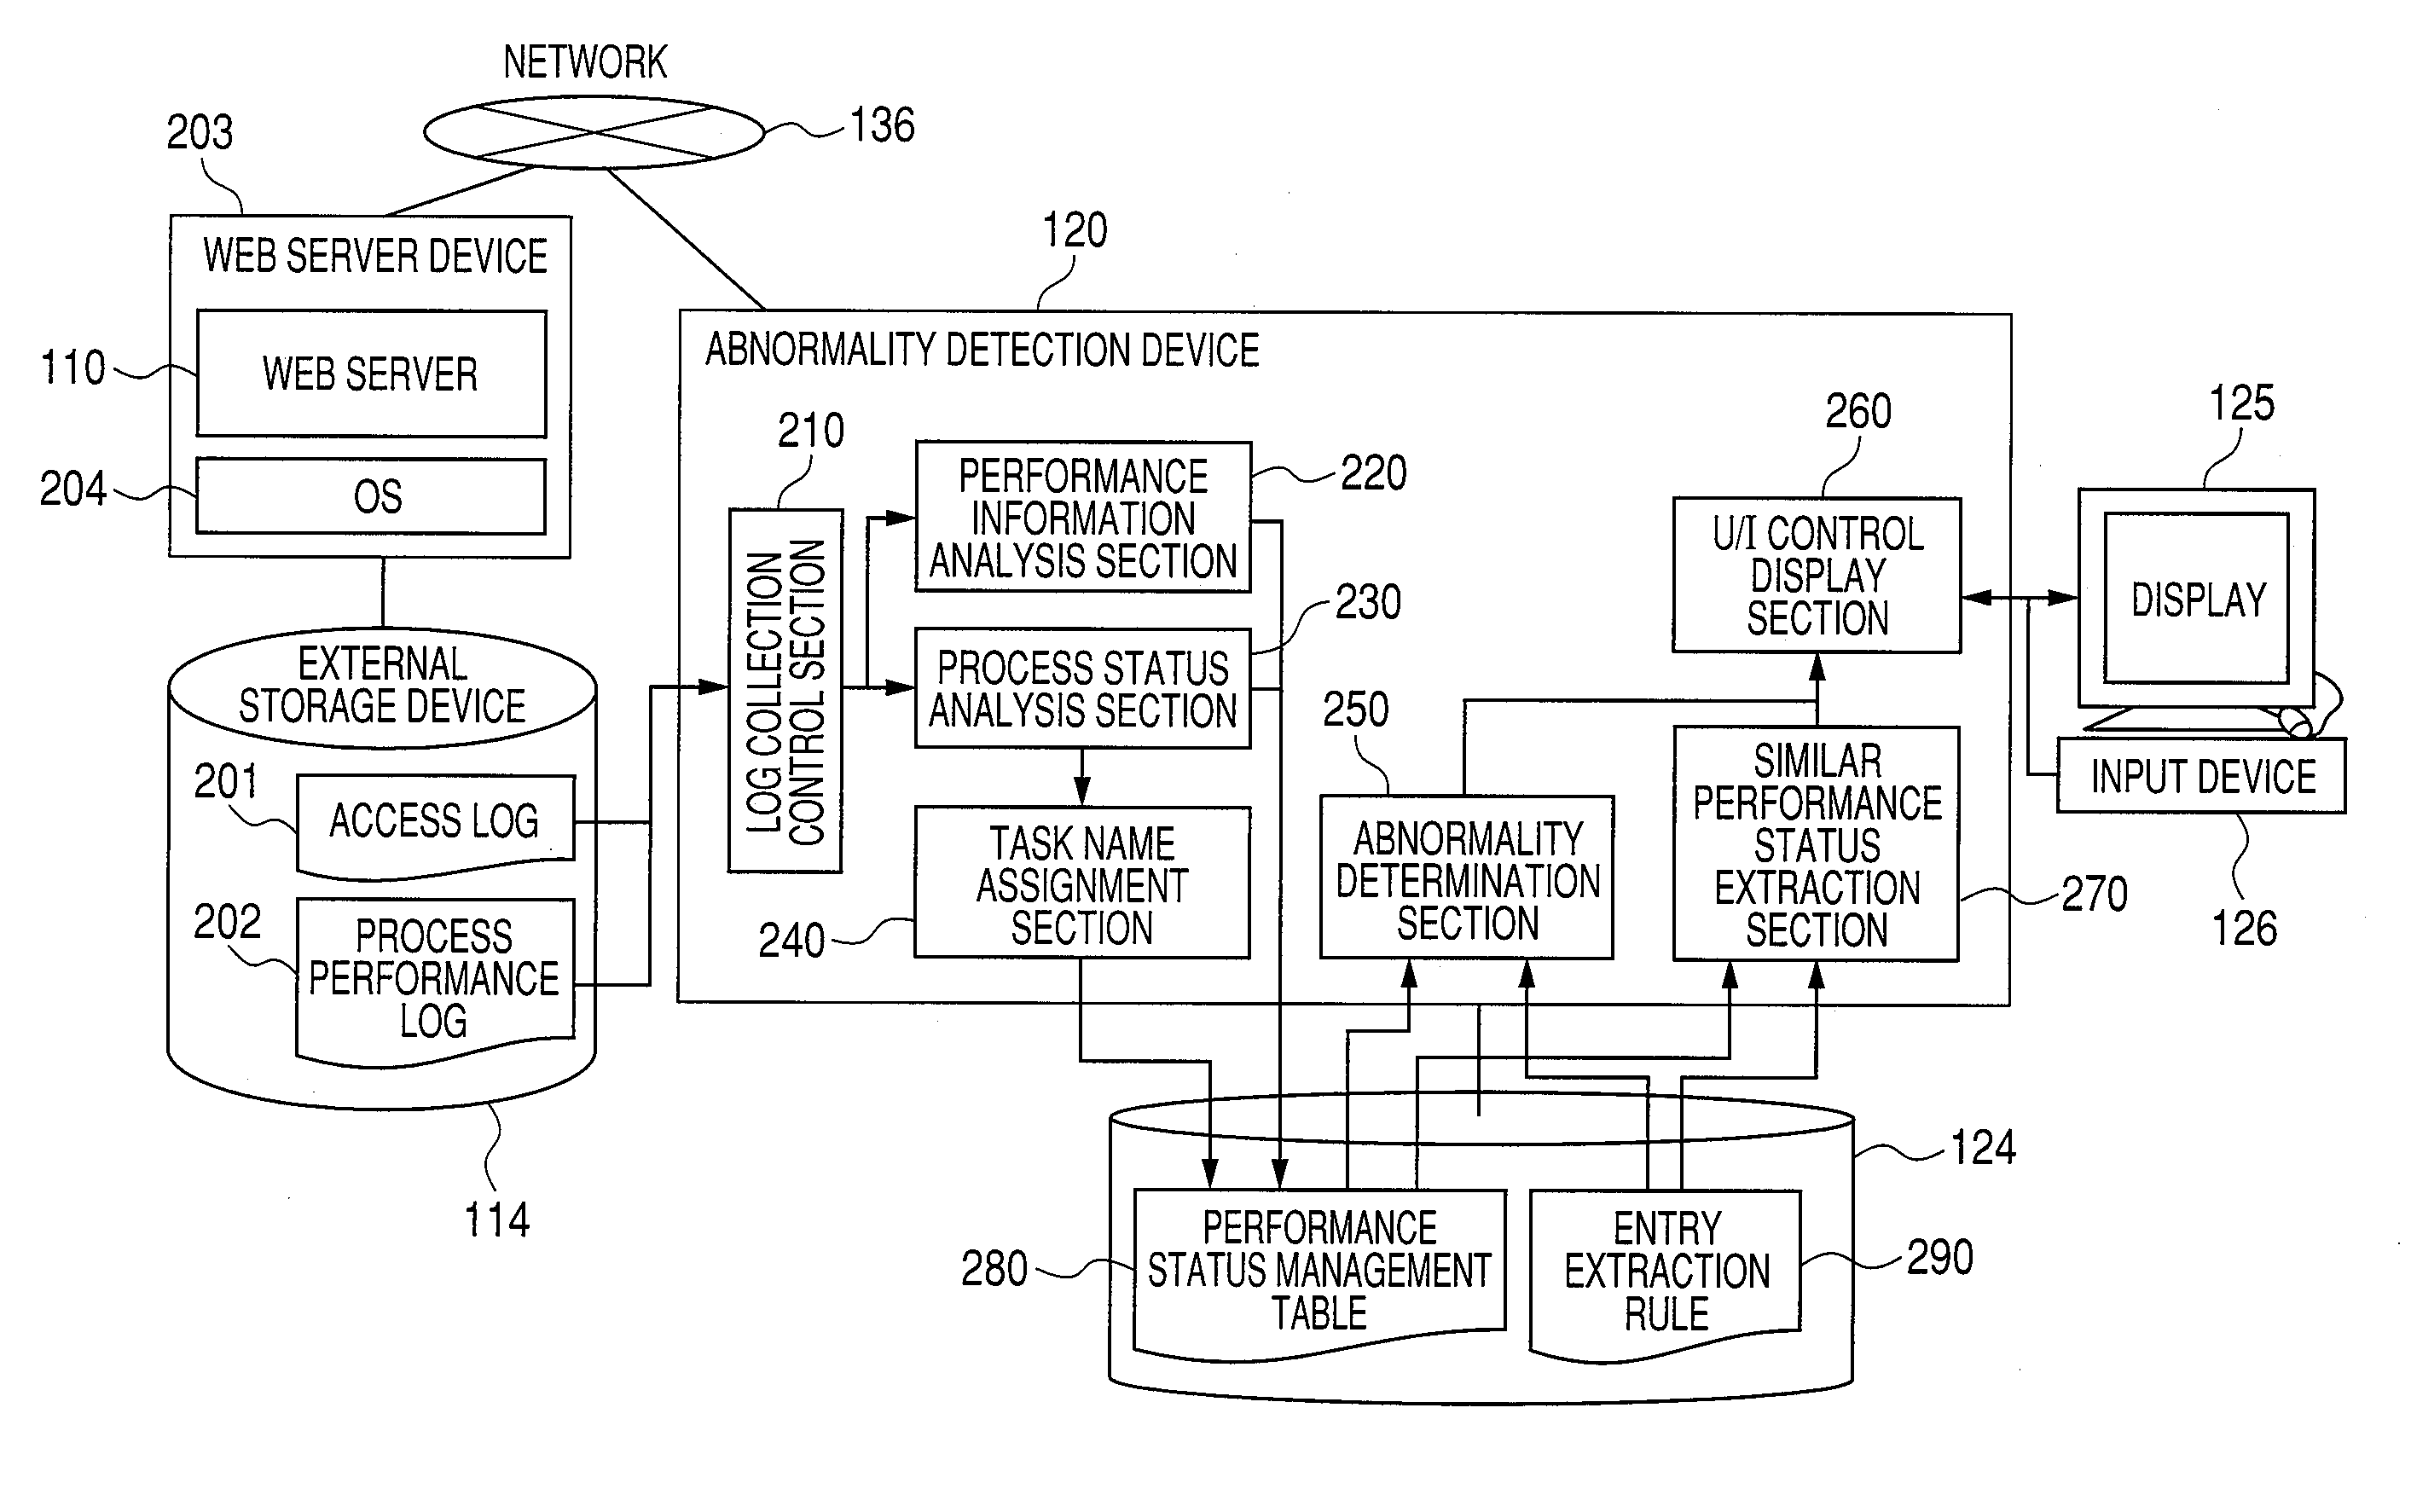
[0044]The first embodiment being described below is a configuration in which model data is generated using an access log and a process performance log, processing to detect web server abnormality is performed, and, when any abnormality is detected, it is displayed on a screen along with the reason why it has been detected.

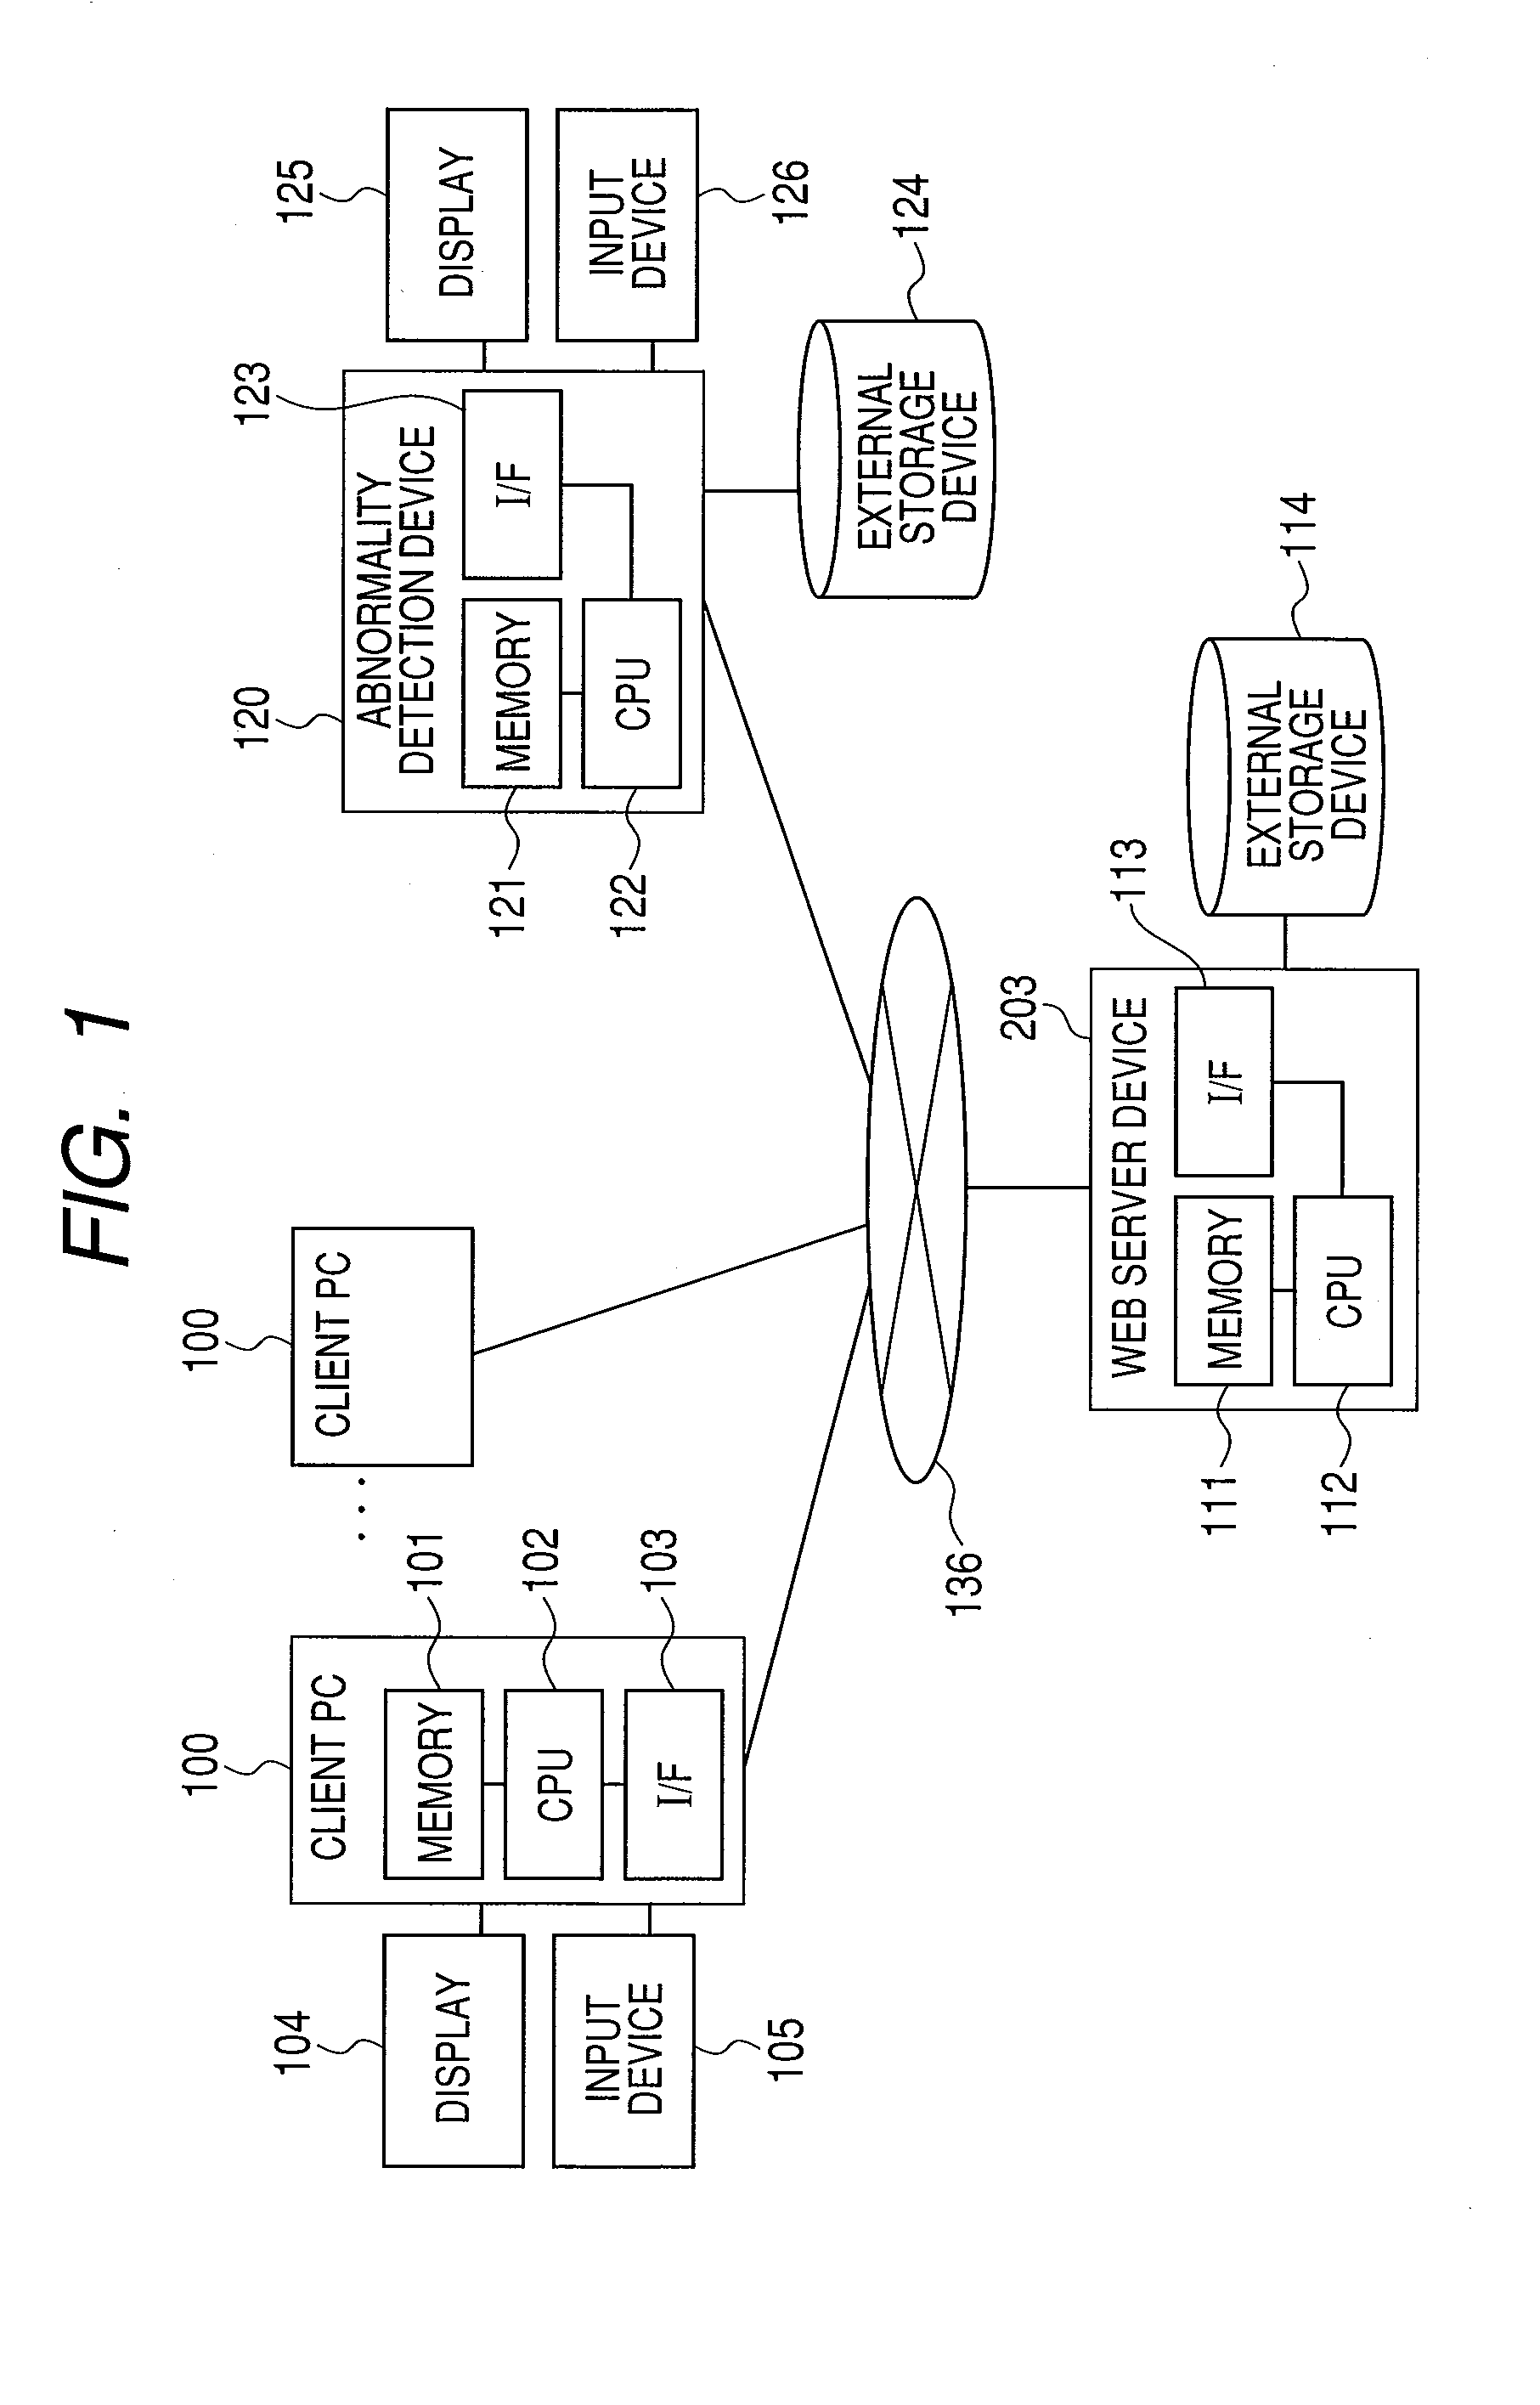
[0045]FIG. 1 is a block diagram of an overall configuration of a computer system according to the first embodiment.

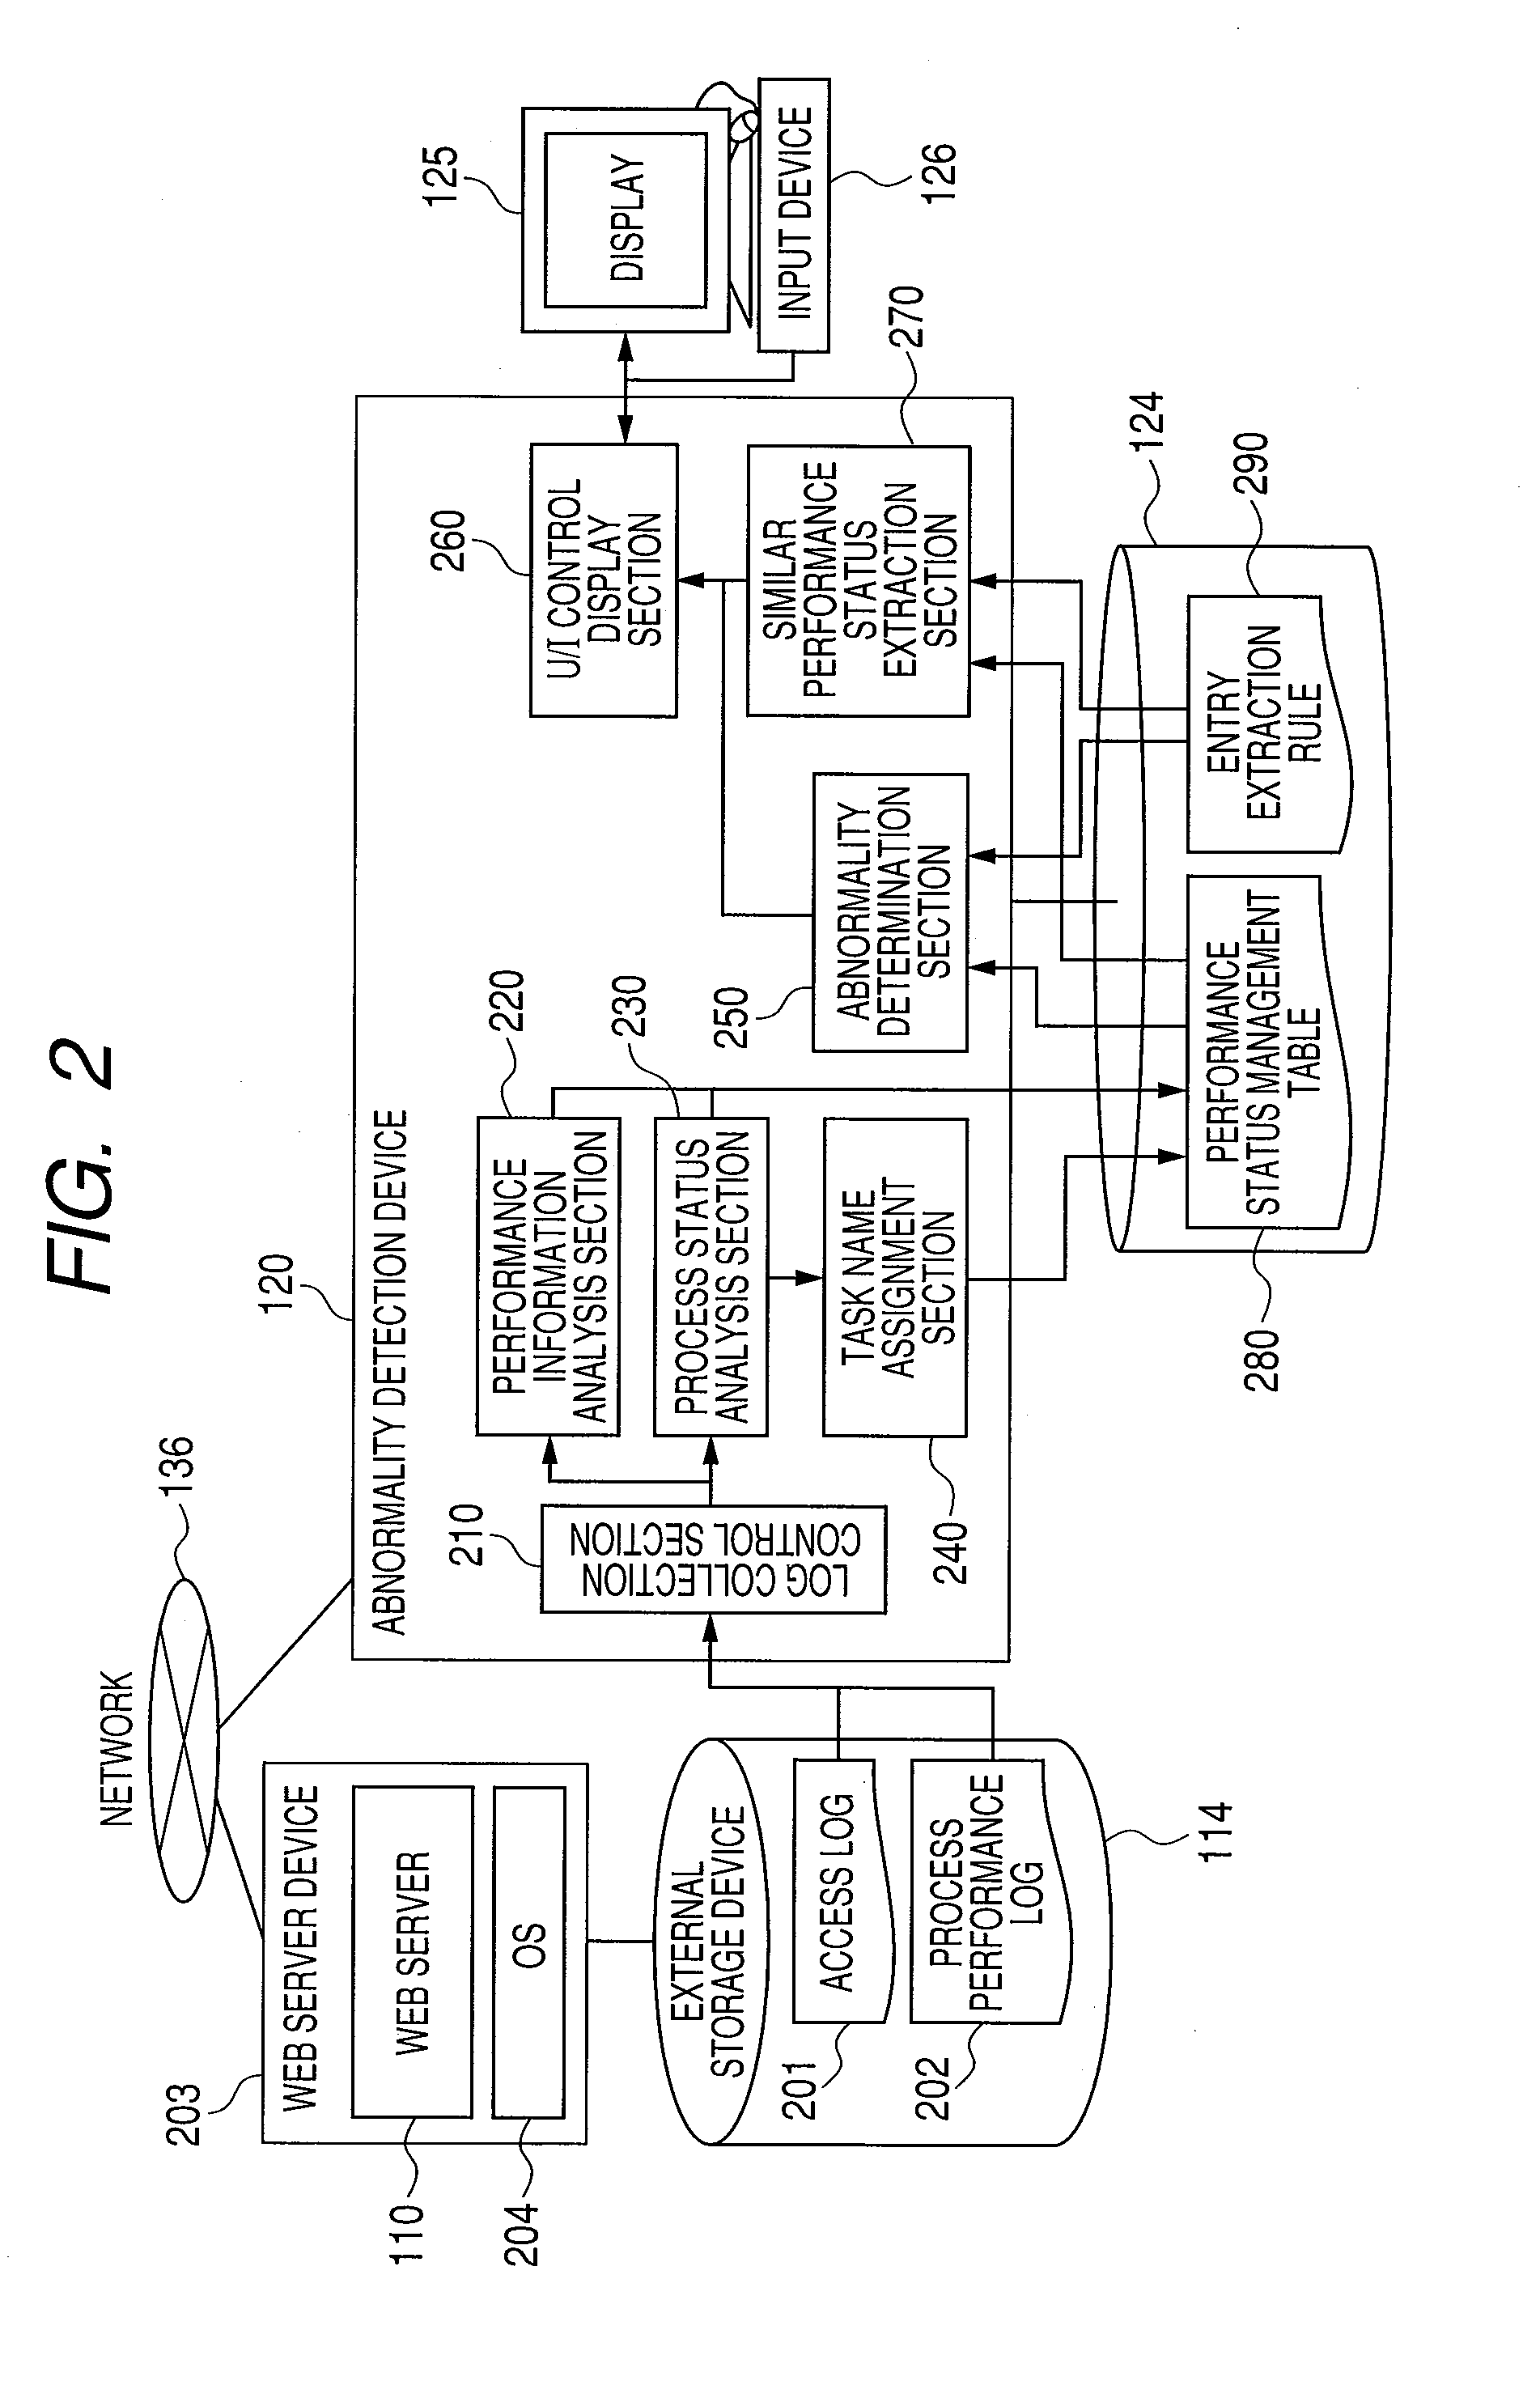
[0046]The computer system of the present embodiment includes a web server device 203 to provide web services, one or more clients’ personal computers (PCs) 100 for using the services provided by the web server device 203, an abnormality detection device 120 for detecting abnormality in the web server device 203, and a network 136 connecting the computer system to other computer systems.

[0047]Each of the client PCs 100 is a computer having a central processing unit (CPU) 102, a memory 101 used as a storage section, and an interface (I / F) 103 which are i...

second embodiment

[0136]In the configuration according to a second embodiment of the present invention, after abnormality is detected in the web server device 203 by the abnormality detection device 120, the entry extraction rule can be updated by selecting a reflection button not to cause erroneous abnormality detection.

[0137]FIG. 15 is a block diagram showing constituent functional elements of a program which operates in the abnormality detection device 120. The program structure is the same as in the first embodiment except that a selection reflection section 1500 is included in the program for the second embodiment. The selection reflection section 1500 is a functional section for updating the entry extraction rule 290 when a reflection button is selected.

[0138]FIG. 16 is a flowchart showing an example of processing performed by the selection reflection section. First, in step S1600, an editing screen 1700 for inputting conditions used to generate recommended performance status in the entry extra...


PUM


Abstract

Model data is generated from performance information sorted by day of the week, time period, and process status by a performance information analysis section and a process status analysis section. An abnormality determination section detects abnormality using appropriate model data. What the graph of an expected status is like, how much the graph of the current status that has been determined abnormal differs from the graph of the expected status, and how much the current status is like the expected status are displayed allowing a system manager to observe detailed information about abnormality determination.

Description

CLAIM OF PRIORITY[0001]The present application claims priority from Japanese patent application JP 2009-177978 filed on Jul. 30, 2009, the content of which is hereby incorporated by reference into this application.FIELD OF THE INVENTION[0002]The present invention relates to an abnormality detection technique for detecting abnormality in a device to be monitored based on past and current performance information on the device.BACKGROUND OF THE INVENTION[0003]Recently, with Web-based applications for business systems increasing and Internet businesses spreading, the scale of businesses handled by Web systems has been expanding. In such a situation, it is absolutely necessary to enhance the reliability of Web systems. Abnormalities occurring in Web systems are, however, quite diversified, and causes for such abnormalities also vary widely, for example, from software bugs to operator errors. It is, therefore, difficult to completely prevent the occurrence of such abnormalities. Hence, ba...

Claims


Application Information

Patent Timeline
IPC IPC(8): G06F11/07
CPCG06F11/0709G06F11/0748G06F2201/875G06F11/3476G06F11/0751
Inventor NAKAGAWA, HIROMITSUMORI, YASUHIDENAKAMURA, TOMOHIROKIKUCHI, KATSURO
Owner HITACHI LTD
Why Eureka
Try Eureka