Multiple Biomarker Panels to Stratify Disease Severity and Monitor Treatment of Depression
a technology of disease severity and biomarker panel, which is applied in the field of stratifying disease severity and monitoring the effectiveness of treatment in a depressed individual, can solve the problems of subjective methods and often unreliable, and achieve the effect of accurately stratifying disease severity and monitoring patient respons
- Summary
- Abstract
- Description
- Claims
- Application Information
AI Technical Summary
Benefits of technology
Problems solved by technology
Method used
Image
Examples
example 1
Diagnostic Markers of Depression
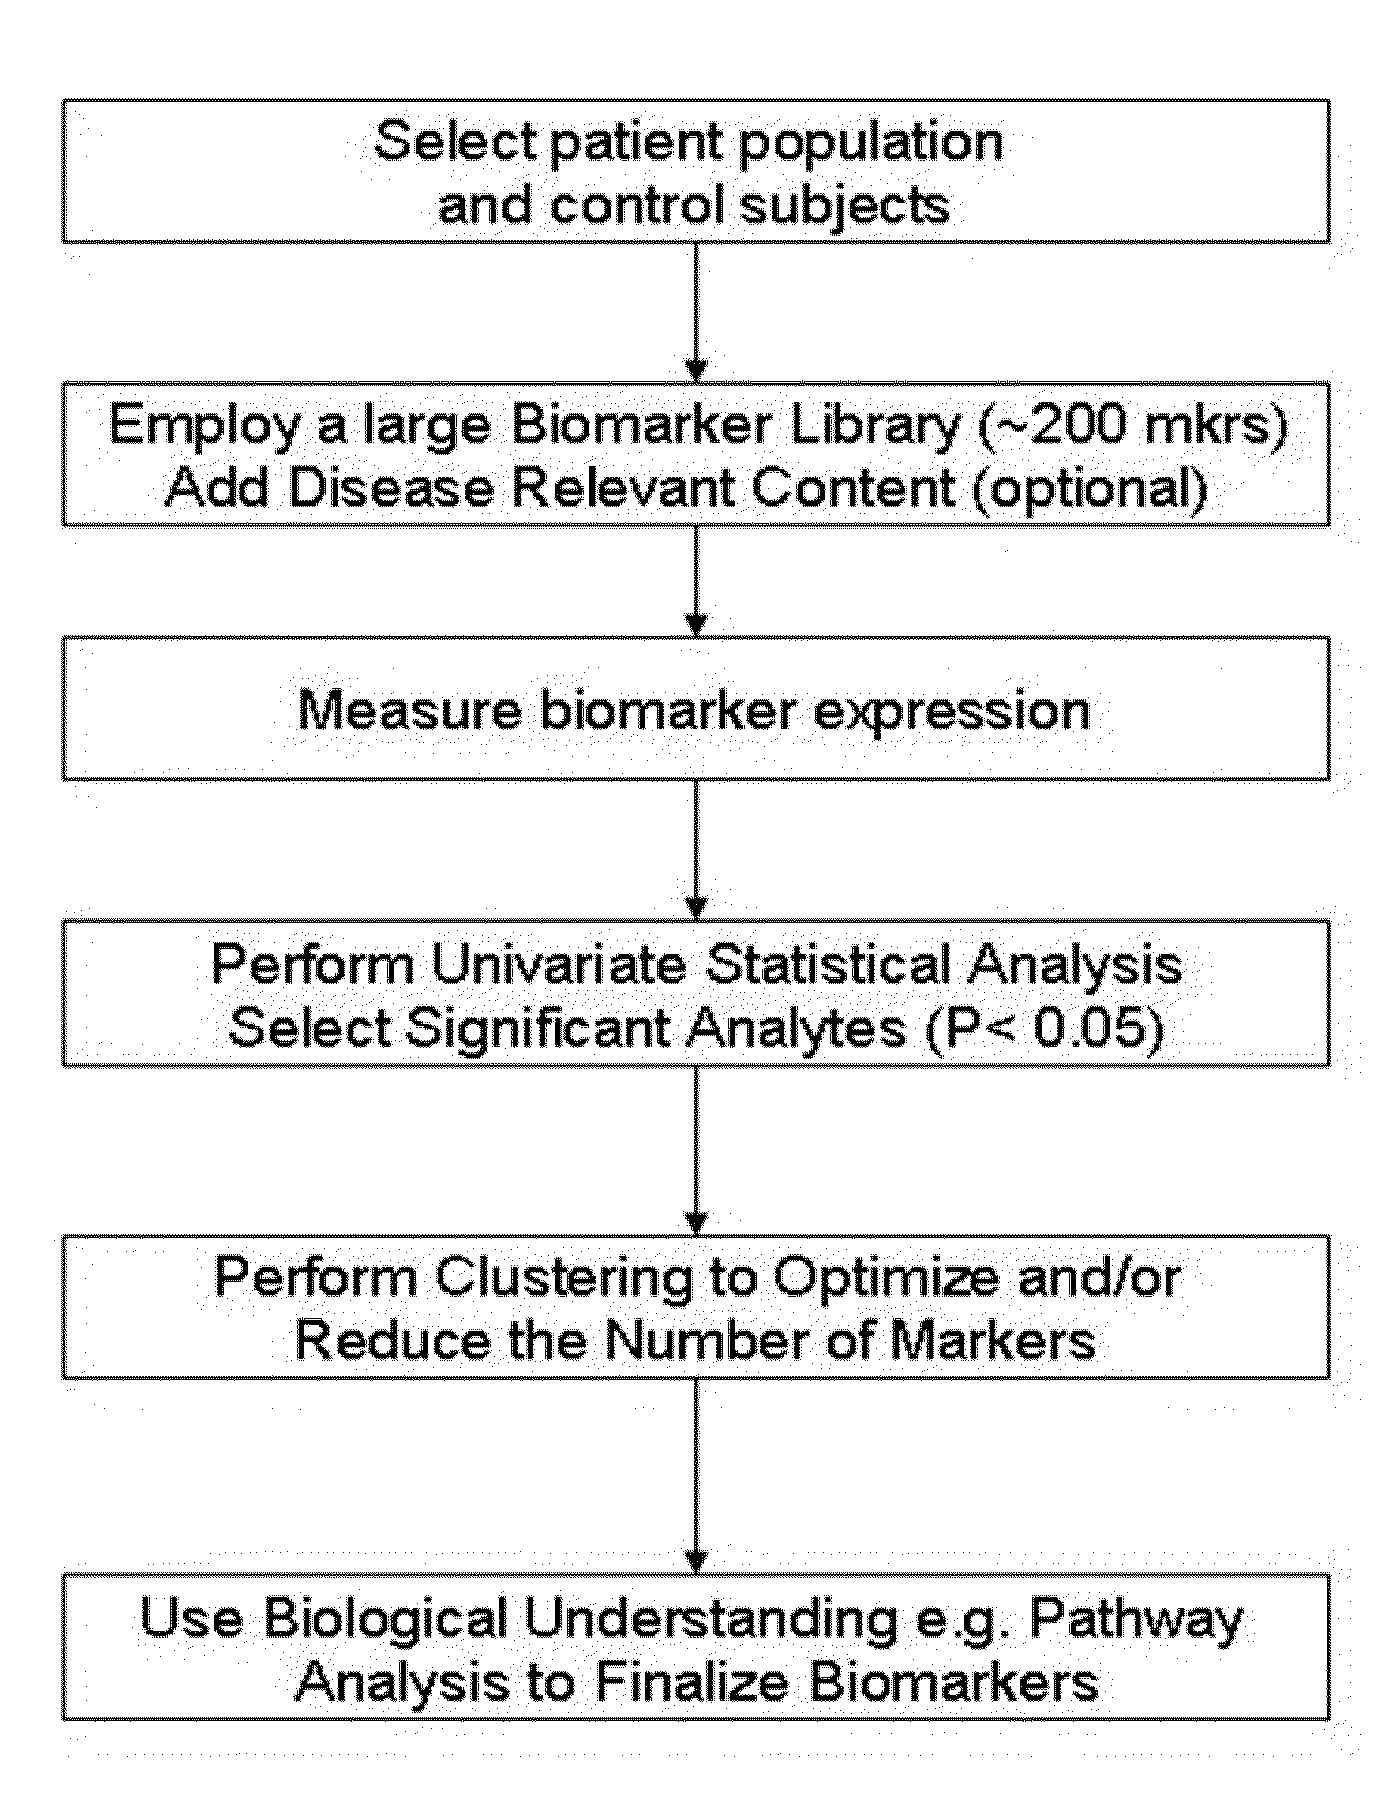
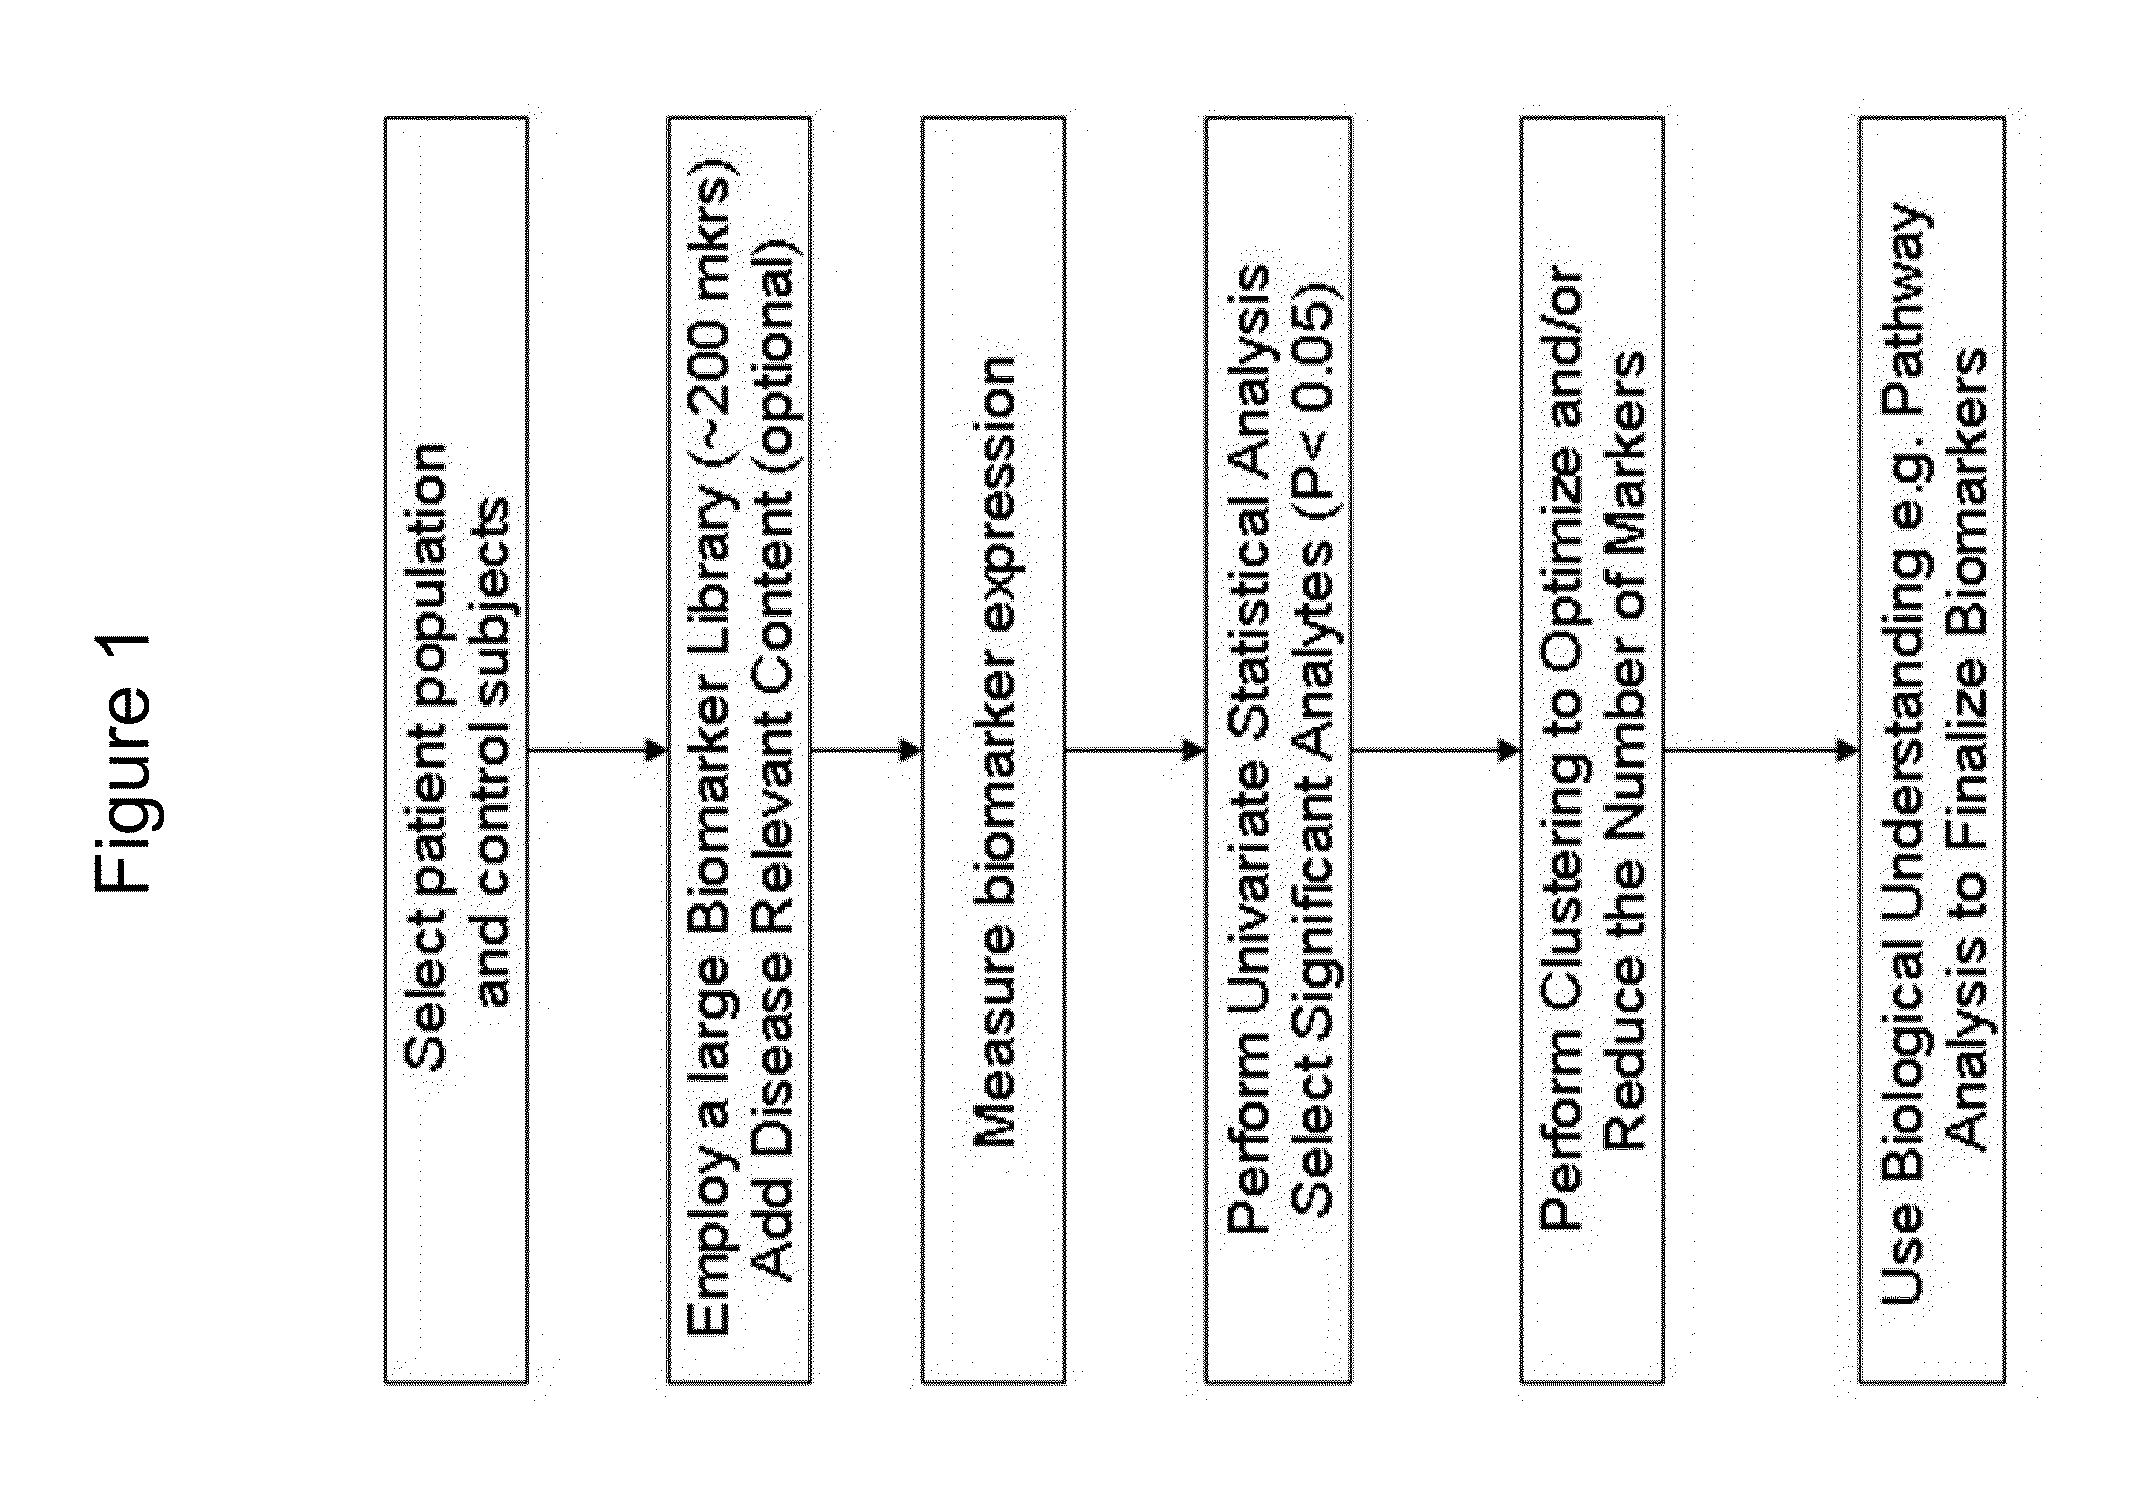
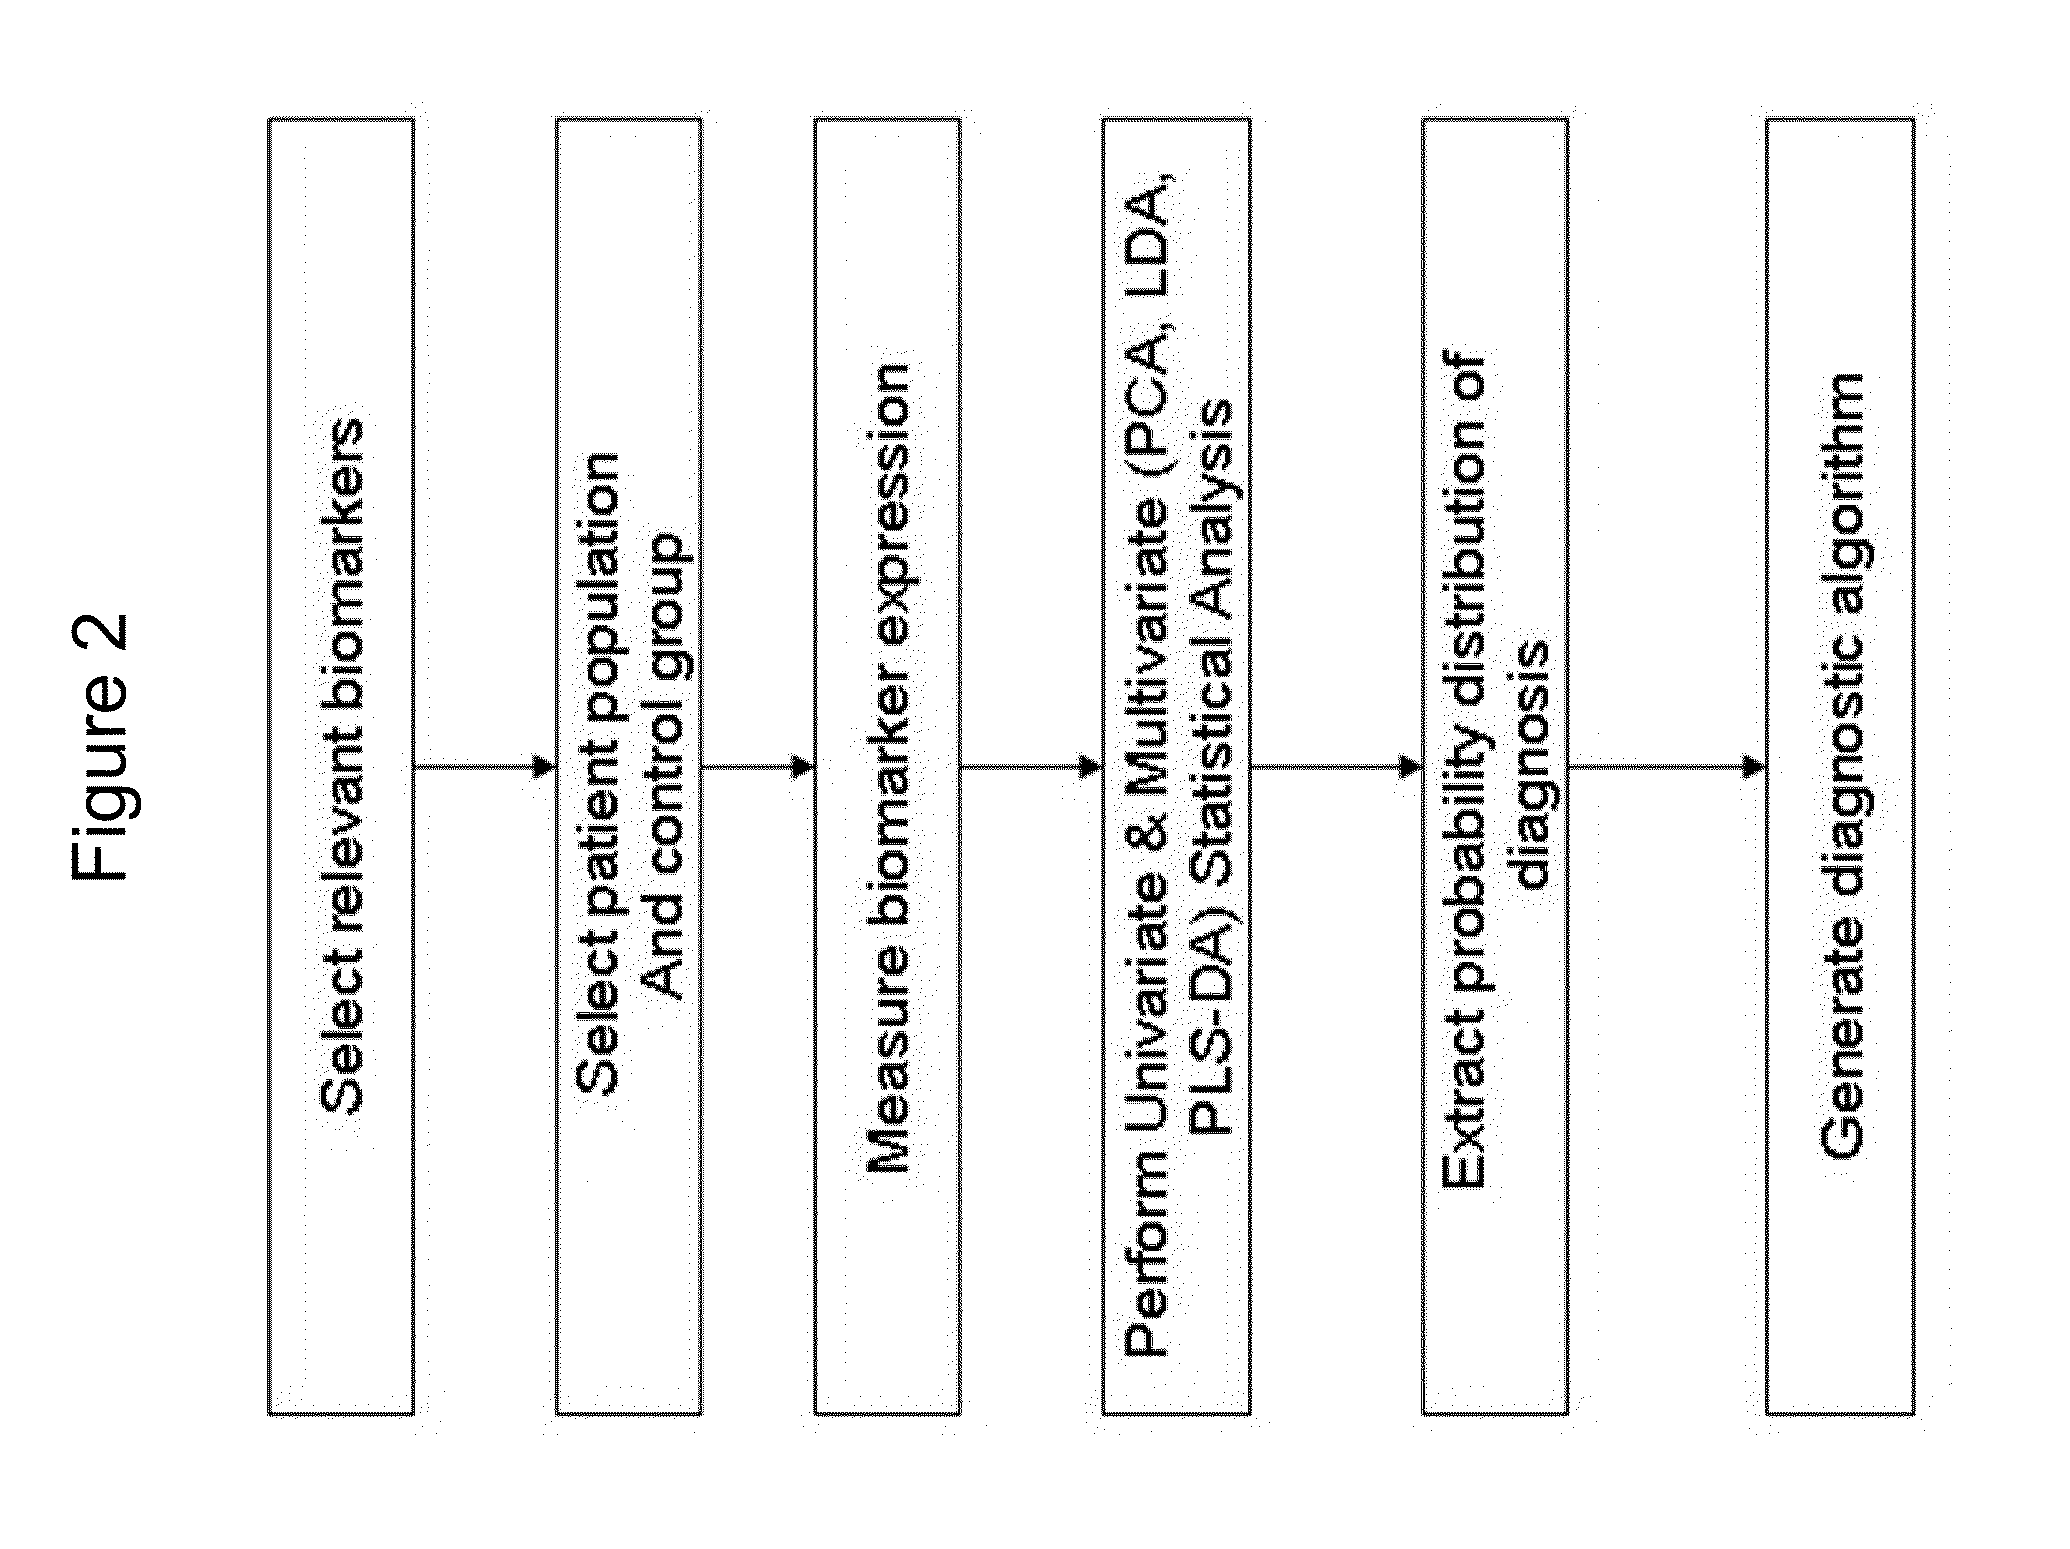
[0068]Methods as described herein were used to develop an algorithm for determining depression scores that are useful to, for example, diagnose MDD, stratify disease severity, and / or evaluate a patient's response to anti-depressive therapeutics. This systematic, highly parallel, combinatorial approach was proposed to assemble “disease specific signatures” using algorithms as described herein. Two statistical approaches were used for biomarker assessment and algorithm development: (1) univariate analysis of individual analyte levels, and (2) linear discriminant analysis and binary logistic regression for algorithm construction.
[0069]Univariate Analysis of Individual Analyte Levels: Univariate analysis explores each variable in a data set separately. This analysis looks at the range of values, as well as the central tendency of the values, describes the pattern of response to the variable, and describes each variable on its own. By way of example, FIG. ...
example 2
Depression Diagnostic Scores Change Following Drug Therapy
[0076]Using the algorithms described herein to establish diagnostic scores, patient populations were stratified according to HAM-D scores above 25. FIG. 7 indicates that patient HAM-D Scores improved (i.e., reduced) at both 2 and 8 weeks after treatment with the antidepressant Lexapro (a SSRI). FIG. 8 shows the change in MDDSCORE™ in a subset of those patients at baseline and after 2 weeks of treatment. FIG. 9 shows the potential for predicting the efficacy of treatment at 8 weeks by determining the MDDSCORE™ after 2 weeks of treatment. These data are indicative of treatment efficacy and demonstrate the utility of MDD diagnostic scores for both patient stratification and treatment monitoring.
example 3
Antidepressant Treatment Monitoring with Multiple Biomarker Measurements
[0077]To develop an algorithm for using a panel of biomarker measurements to monitor antidepressant drug treatment, a group of patient candidates was selected for antidepressant drug treatment, and an initial blood sample was taken from each patient. The samples were spun down to separate serum from cells, and stored as PS1 (Patient p draw 1). Each patient was treated with an antidepressant drug (Lexapro®) for eight weeks, and blood samples were collected during the course of treatment. The samples were spun down, labeled and stored.
[0078]The samples (PS1, PS2, PS3, etc.) for each patient were assayed to measure the levels of five biomarkers—prolactin, BDNF, resistin, TNFRII, and A1A (Mn1, Mn2, and Mn3=biomarkers n1, n2, and n3; FIG. 10). A mathematical algorithm was applied to the biomarker measurements to calculate a monitoring score that was correlated to the final outcome (the HAMD score change) at the end o...
PUM
 Abstract
Description
Claims
Application Information
 - R&D
- Intellectual Property
- Life Sciences
- Materials
- Tech Scout
- Unparalleled Data Quality
- Higher Quality Content
- 60% Fewer Hallucinations
Browse by: Latest US Patents, China's latest patents, Technical Efficacy Thesaurus, Application Domain, Technology Topic, Popular Technical Reports.
© 2025 PatSnap. All rights reserved.Legal|Privacy policy|Modern Slavery Act Transparency Statement|Sitemap|About US| Contact US: help@patsnap.com


