Measuring and Displaying Wireless Network Quality

a wireless network and quality measurement technology, applied in the field of wireless digital networks, can solve the problems that the networks operating on channels b>1/b> and b>2/b> may interfere with each other

Active Publication Date: 2011-10-06
HEWLETT-PACKARD ENTERPRISE DEV LP
View PDF19 Cites 30 Cited by
  • Summary
  • Abstract
  • Description
  • Claims
  • Application Information

AI Technical Summary

Problems solved by technology

Unfortunately, the frequencies used by these networks are shared.
These channels overlap, so Wi-Fi network devices operating on channels 1 and 2 may interfere with each other as they overlap in the frequency spectrum they use.

Method used


Image

  • Measuring and Displaying Wireless Network Quality
  • Measuring and Displaying Wireless Network Quality

Examples


Embodiment Construction

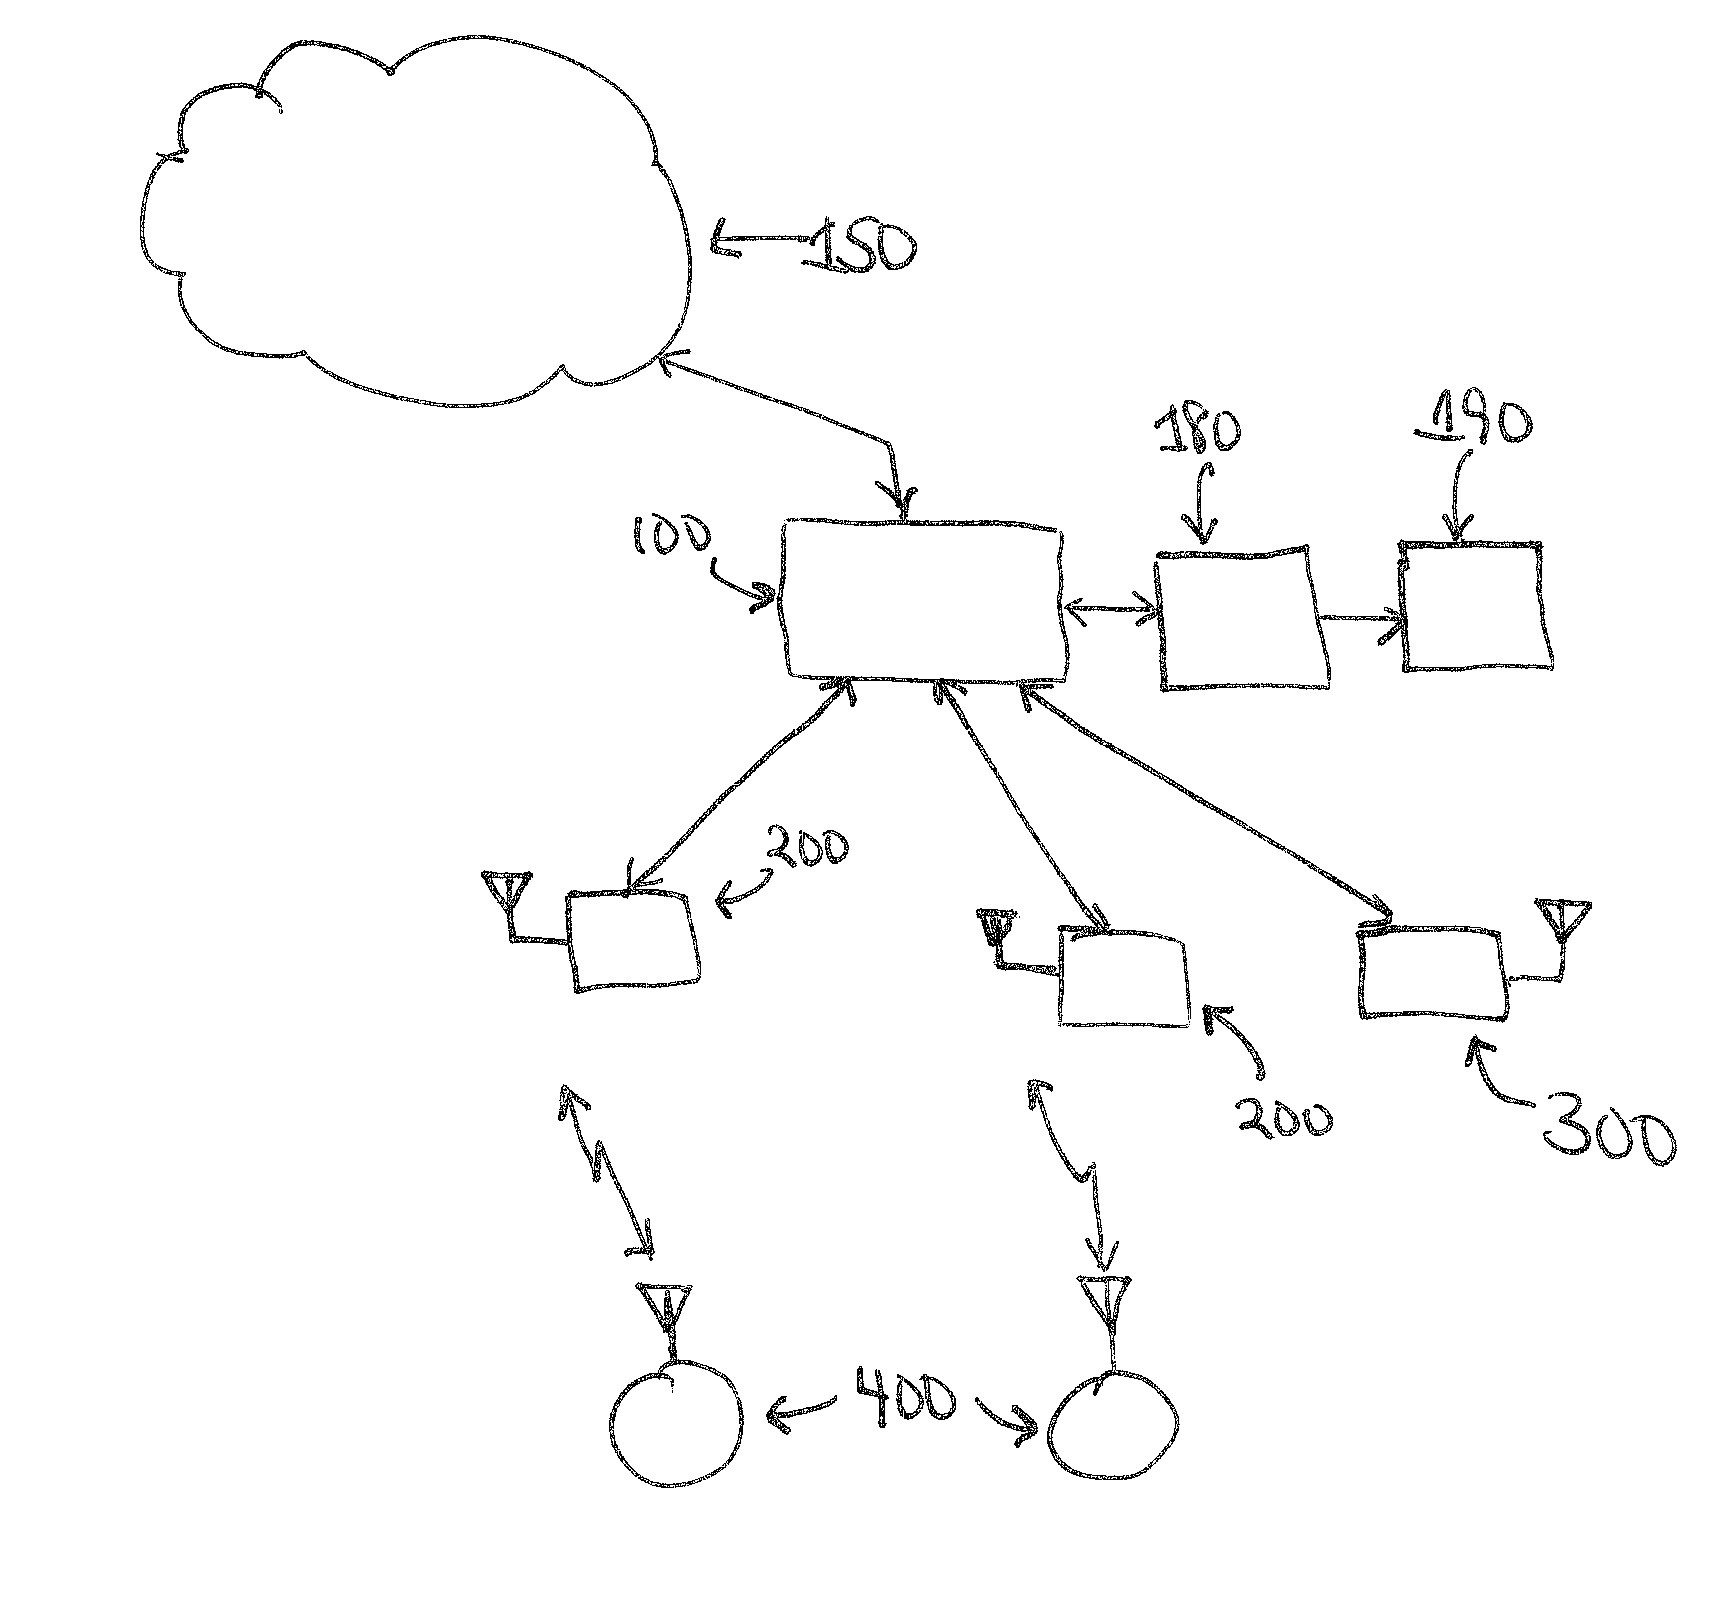
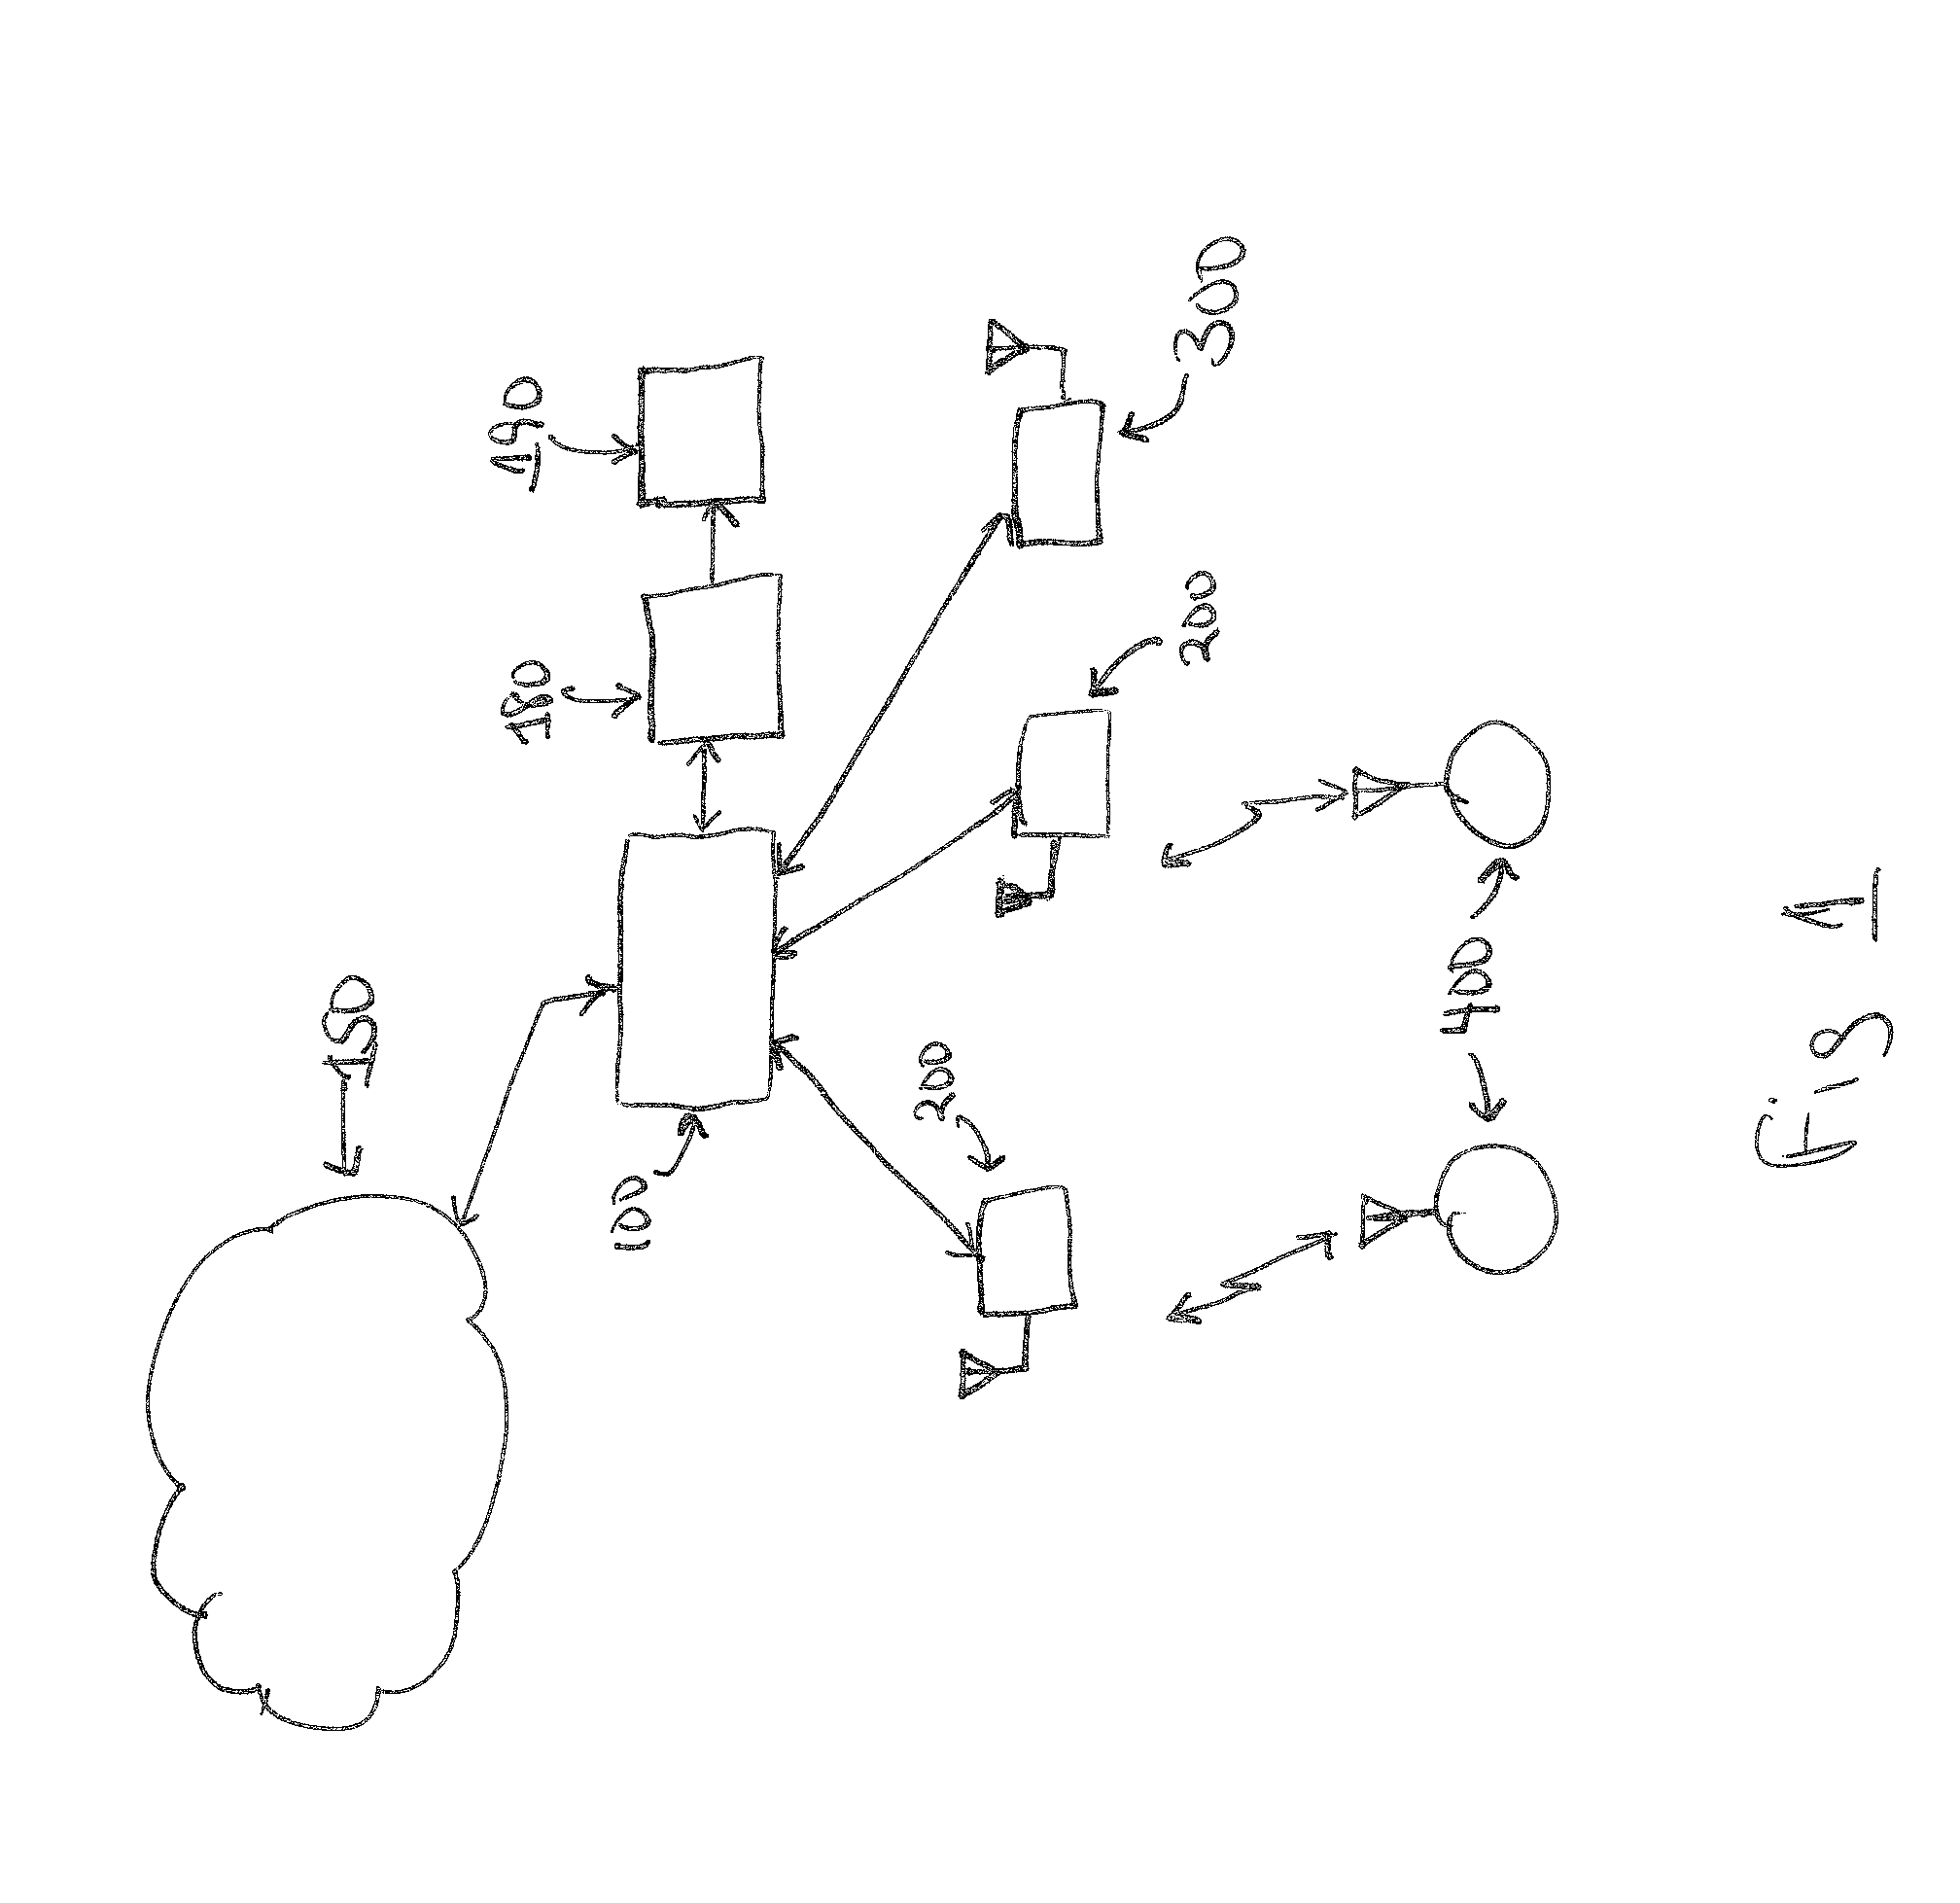
[0009]Embodiments of the invention relate to methods of calculating and displaying quality metrics on a wireless digital network such as a network using IEEE 802.11 Wi-Fi standards. Quality metrics are calculated on a per-channel basis. While many factors may go into a quality calculation, not all factors may have significance. Thus the quality metric calculation assigns weights only to the factors which are observed above a threshold, and combines multiple factors to form a scalar result. The quality metric is derived from the weighted sum of two or more parameters such as: adjacent channel interference (ACI), Co-channel interference (CCI), noise floor offset, channel busy indication, overlapping channel interference, interferer duty-cycle, frame retry-rate, PHY error rate and CRC error rate. Quality spectrograms may be used to display calculated quality metrics across a channel, channel range, or frequency band, plotting calculated quality metric versus frequency or channel range ...


PUM


Abstract

Methods of calculating and displaying quality metrics on a wireless digital network such as a network using IEEE 802.11 Wi-Fi standards. The quality metric calculation assigns weights only to factors which are observed above a threshold, combining multiple factors into a scalar result. The quality metric is derived from the weighted sum of two or more parameters such as: noise floor offset, channel busy indication, adjacent and overlapping channel interference, interferer duty-cycle, frame retry-rate, PHY error rate and CRC error rate. Quality spectrograms may be used to display calculated quality metrics across a channel, channel range, or frequency band, plotting calculated quality metric versus frequency or channel range over a configurable time frame. Using known locations of radios, quality ranges are mapped onto visual representations such as contour lines, shading density, or color codes, and overlayed for example over floor plans or other site representations.

Description

CROSS-REFERENCES TO RELATED APPLICATIONS[0001]This application claims the benefit of priority on U.S. Provisional Patent Application No. 61 / 321210 filed Apr. 6, 2010 and entitled “Automatic conversion of access points to spectrum monitors and hybrid mode access point” (Attorney Docket No. 06259P086Z), U.S. Provisional Patent Application No. 61 / 321179 filed Apr. 6, 2010 and entitled “Measuring and displaying wireless network quality” (Attorney Docket No. 06259P085Z), and U.S. Provisional Patent Application No. 61 / 321214 filed Apr. 6, 2010 and entitled “Displaying a Wideband spectrum using a narrowband receiver” (Attorney Docket No. 06259P087Z), all incorporated herein by reference.BACKGROUND OF THE INVENTION[0002]The present invention relates to wireless digital networks, and in particular, to the problem of measuring and displaying quality metrics in wireless digital networks.[0003]Wireless digital networks are becoming ubiquitous in enterprises, providing secure and cost-effective ...

Claims


Application Information

Patent Timeline
Patent Type & Authority Applications(United States)
IPC IPC(8): H04L12/26
CPCH04L41/22H04L43/08H04W24/08H04W72/00H04W84/12H04W24/10H04W72/541H04W72/0446H04W88/10
Inventor PONNUSWAMY, SUBBURAJAN
Owner HEWLETT-PACKARD ENTERPRISE DEV LP
Why Eureka
Try Eureka