
Order-preserving clustering data analysis system and method

a data analysis and order-preserving technology, applied in the field of data analysis and data mining, can solve problems such as noise in changes, and achieve the effects of reducing noise, flexible and effective, and facilitating comparison of large sets of data

Inactive Publication Date: 2011-11-17
NAT RES COUNCIL OF CANADA
View PDF5 Cites 14 Cited by
  • Summary
  • Abstract
  • Description
  • Claims
  • Application Information

AI Technical Summary

Benefits of technology

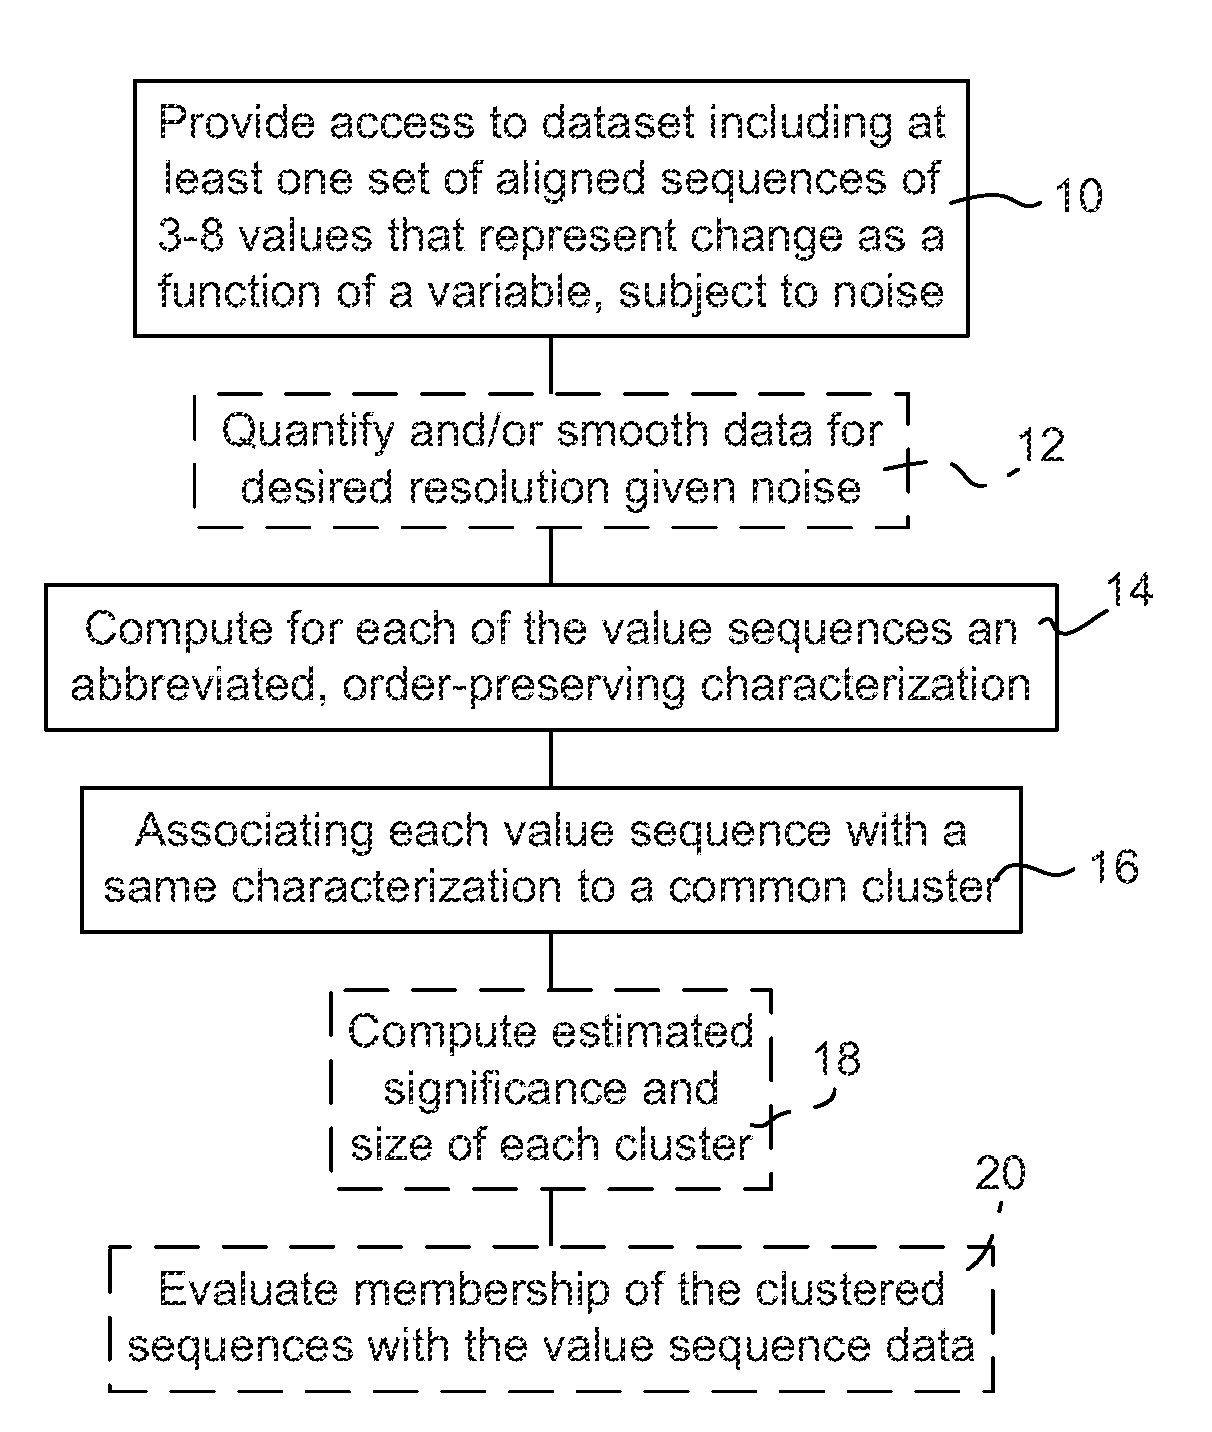
[0013]According to the present invention, there is provided a novel clustering data analysis technique, particularly suited for short time-series data mining of experimental genomic, proteomic, or materiomics, or other applications that involve clustering short sequences of values according to their trend, as the clustering data analysis technique is able to identify all clusters with coherent evolution from a given dataset. It can be extended to longer time-series datasets by recursion, for example with a windowing function or other partitioning of the data.
[0014]The clustering data analysis technique assigns an abbreviated order preserving characterization to each of the sequences of values to facilitate comparisons of large sets of data (e.g. more than a few thousand sets of data sequences to be trended), and removing an effect of noise. Unlike [12], which provides an abbreviated order preserving characterization to data from a variety of experiments, and then seeks to identify essentially random subsets of the experiments that are coherent, according to the present invention, only data that is part of a same experiment are treated this way. Whereas in [12] the expression values that are characterized by ranking, come from independently scaled gene expression values combined from different readouts for different experiments (tissues), which may be relative or absolute measures of expression level, the expression values characterized in accordance with the present invention are sequences of values that represent changes in observed values as a function of a variable, such as time, position within a tissue, temperature, concentration of a solute, electric or magnetic field, or other property or index of properties. The abbreviated order preserving characterization of such values is particularly advantageous because the difference between the expression values from a single experiment is more reliable a measure (when noise is evident) than the values themselves, especially when the values are well quantified. Thus, in comparison with [12], the present invention uses value sequences that represent changes in observed values as a function of a variable, provides a more flexible and effective analysis, has a complexity that is linear, and thus is computationally feasible on larger datasets, is optimal, for a given quantification, as it does not rely on probabilistic clustering methods, and further provides greater possibilities for analysis by providing a complete classification of the sequences of variables. These substantial advantages are provided by limiting the search from all subsets of all experimental values to patterns of short sequences (3-20, more preferably 3-8, values), which are considered indivisible by the analysis, and treating different samples and genes independently.

Problems solved by technology

The value sequences represent changes in observed values as a function of a variable, and the changes are subject to noise.

Method used


Image

  • Order-preserving clustering data analysis system and method
  • Order-preserving clustering data analysis system and method
  • Order-preserving clustering data analysis system and method

Examples


examples

[0044]An example of the present invention is provided for use in gene-sample-time, short time series datasets. A 3D microarray gene expression dataset or gene-sample-time (GST) microarray dataset is a real-valued N×M×L matrix is provided, representing set of N genes G={g1, . . . gn, . . . gN}, a set of M biological samples S={s1, . . . , sm, . . . , sM}, and a series of L time points T={t1, . . . , tl . . . , tL}. Typically 1010>N>104, 10>M>1, and 20>L>3. Each cell anmi in the matrix derives from an observed measurement of expression level of gene gn in sample sm at time (or under the conditions associated with) tl. This 3D microarray dataset is referred to as: A=(G, S, T). The expression level of gene gn in sample sm across the time points (sequence) is denoted: fnm(t), which is a row vector. The expression level of a gene gn in all the samples, across all time points fn(s,t), is another name for the matrix A. Thus the 3D gene expression matrix can be viewed as a set of 2D matrices...


PUM


Abstract

Clustering data analysis that is robust to noise and is able to extract the most reliable information from sequential data comprises the ranking all of the measurement values across a third dimension of a 3D dataset in a selected one of an increasing order or a decreasing order and producing a three dimensional array of ranked values therefrom. It further comprises identifying coherent 3D patterns from the 3D array of ranked values, and counting the number of identified coherent 3D patterns. Each coherent 3D pattern parameters with a similar ranking and across subsets of the set of elements to a same group defines a cluster.

Description

FIELD OF THE INVENTION[0001]The present invention relates in general to data analysis and data mining, and more specifically, it relates to a system and method for carrying out clustering data analysis based on order-preserving trends.BACKGROUND OF THE INVENTION[0002]There are many systems of data that require clustering data analysis, specifically clustering data that exhibits a same or similar trend. Some applications call for the clustering of aligned, relatively short, units of data (a sequence of 3-8 values). Often noise within the data is problematic, and increasingly greater volumes of data are analyzed. In general, an efficient and computationally inexpensive algorithm for trend-based clustering of similar data units is desired.[0003]One such application for clustering data analysis comes from microarray technology, which has met with substantial commercial success over the past decade, in part because of its ability to quantify samples with high throughput. Thousands of gen...

Claims


Application Information

Patent Timeline
IPC IPC(8): G06F17/30G16B40/30G16B30/10
CPCG06F19/24G06F19/22G16B30/00G16B40/00G16B40/30G16B30/10
Inventor TCHAGANG, ALAIN B.
Owner NAT RES COUNCIL OF CANADA
Learn More