
Systems and Methods for Impact Analysis in a Computer Network

a computer network and impact analysis technology, applied in the field of statistical analysis computer systems, can solve the problems of continuous improvement techniques, difficult to describe quantitatively, and difficulty in finding good quantifiable metrics,

Inactive Publication Date: 2011-12-22
FORESEE RESULTS
View PDF10 Cites 4 Cited by
  • Summary
  • Abstract
  • Description
  • Claims
  • Application Information

AI Technical Summary

Benefits of technology

"The present invention provides a computer-implemented system and method for determining the impact of user actions on the performance of a pre-specified or modeled system. It uses a manifest variable database to store data on user interactions with the system and an imputation engine to estimate the value of missing data. The system also calculates scores for latent variables based on the stored manifest variables, which are indicative of customer characteristics. An impact calculator is then used to determine the impact relationships among the latent variables based on the scores. This invention helps to better understand and improve the performance of the system by providing valuable insights into user behavior."

Problems solved by technology

For most industries, however, finding a good, quantifiable metric has proven elusive.
For most industries, business processes have become complex and difficult to describe in quantitative terms.
Therein lies the root of a major problem in applying continuous improvement techniques to achieve better quality.
Even surveys expressly designed to uncover this hidden data can frequently fail to produce meaningful results unless the data are well understood and closely monitored.
Experts in statistical analysis know to represent such intangible variables as “latent variables” that are derived from measurable variables, known as “manifest variables.” However, even experts in statistical analysis cannot say that manifest variable A will always measure latent variable B. The relationship is rarely that direct.
However, these packages do not perform any statistical analysis based on a pre-defined model that approximates system structure or behavior.
Furthermore, these packages lack a semi-automated process for examining the “manifest” variables (i.e., measured survey data) in many different cuts or segments using a model-based approach.
Also, these packages have difficulty dealing with surveys where the data are incomplete or few responses have been gathered.

Method used


Image

  • Systems and Methods for Impact Analysis in a Computer Network
  • Systems and Methods for Impact Analysis in a Computer Network
  • Systems and Methods for Impact Analysis in a Computer Network

Examples


Embodiment Construction

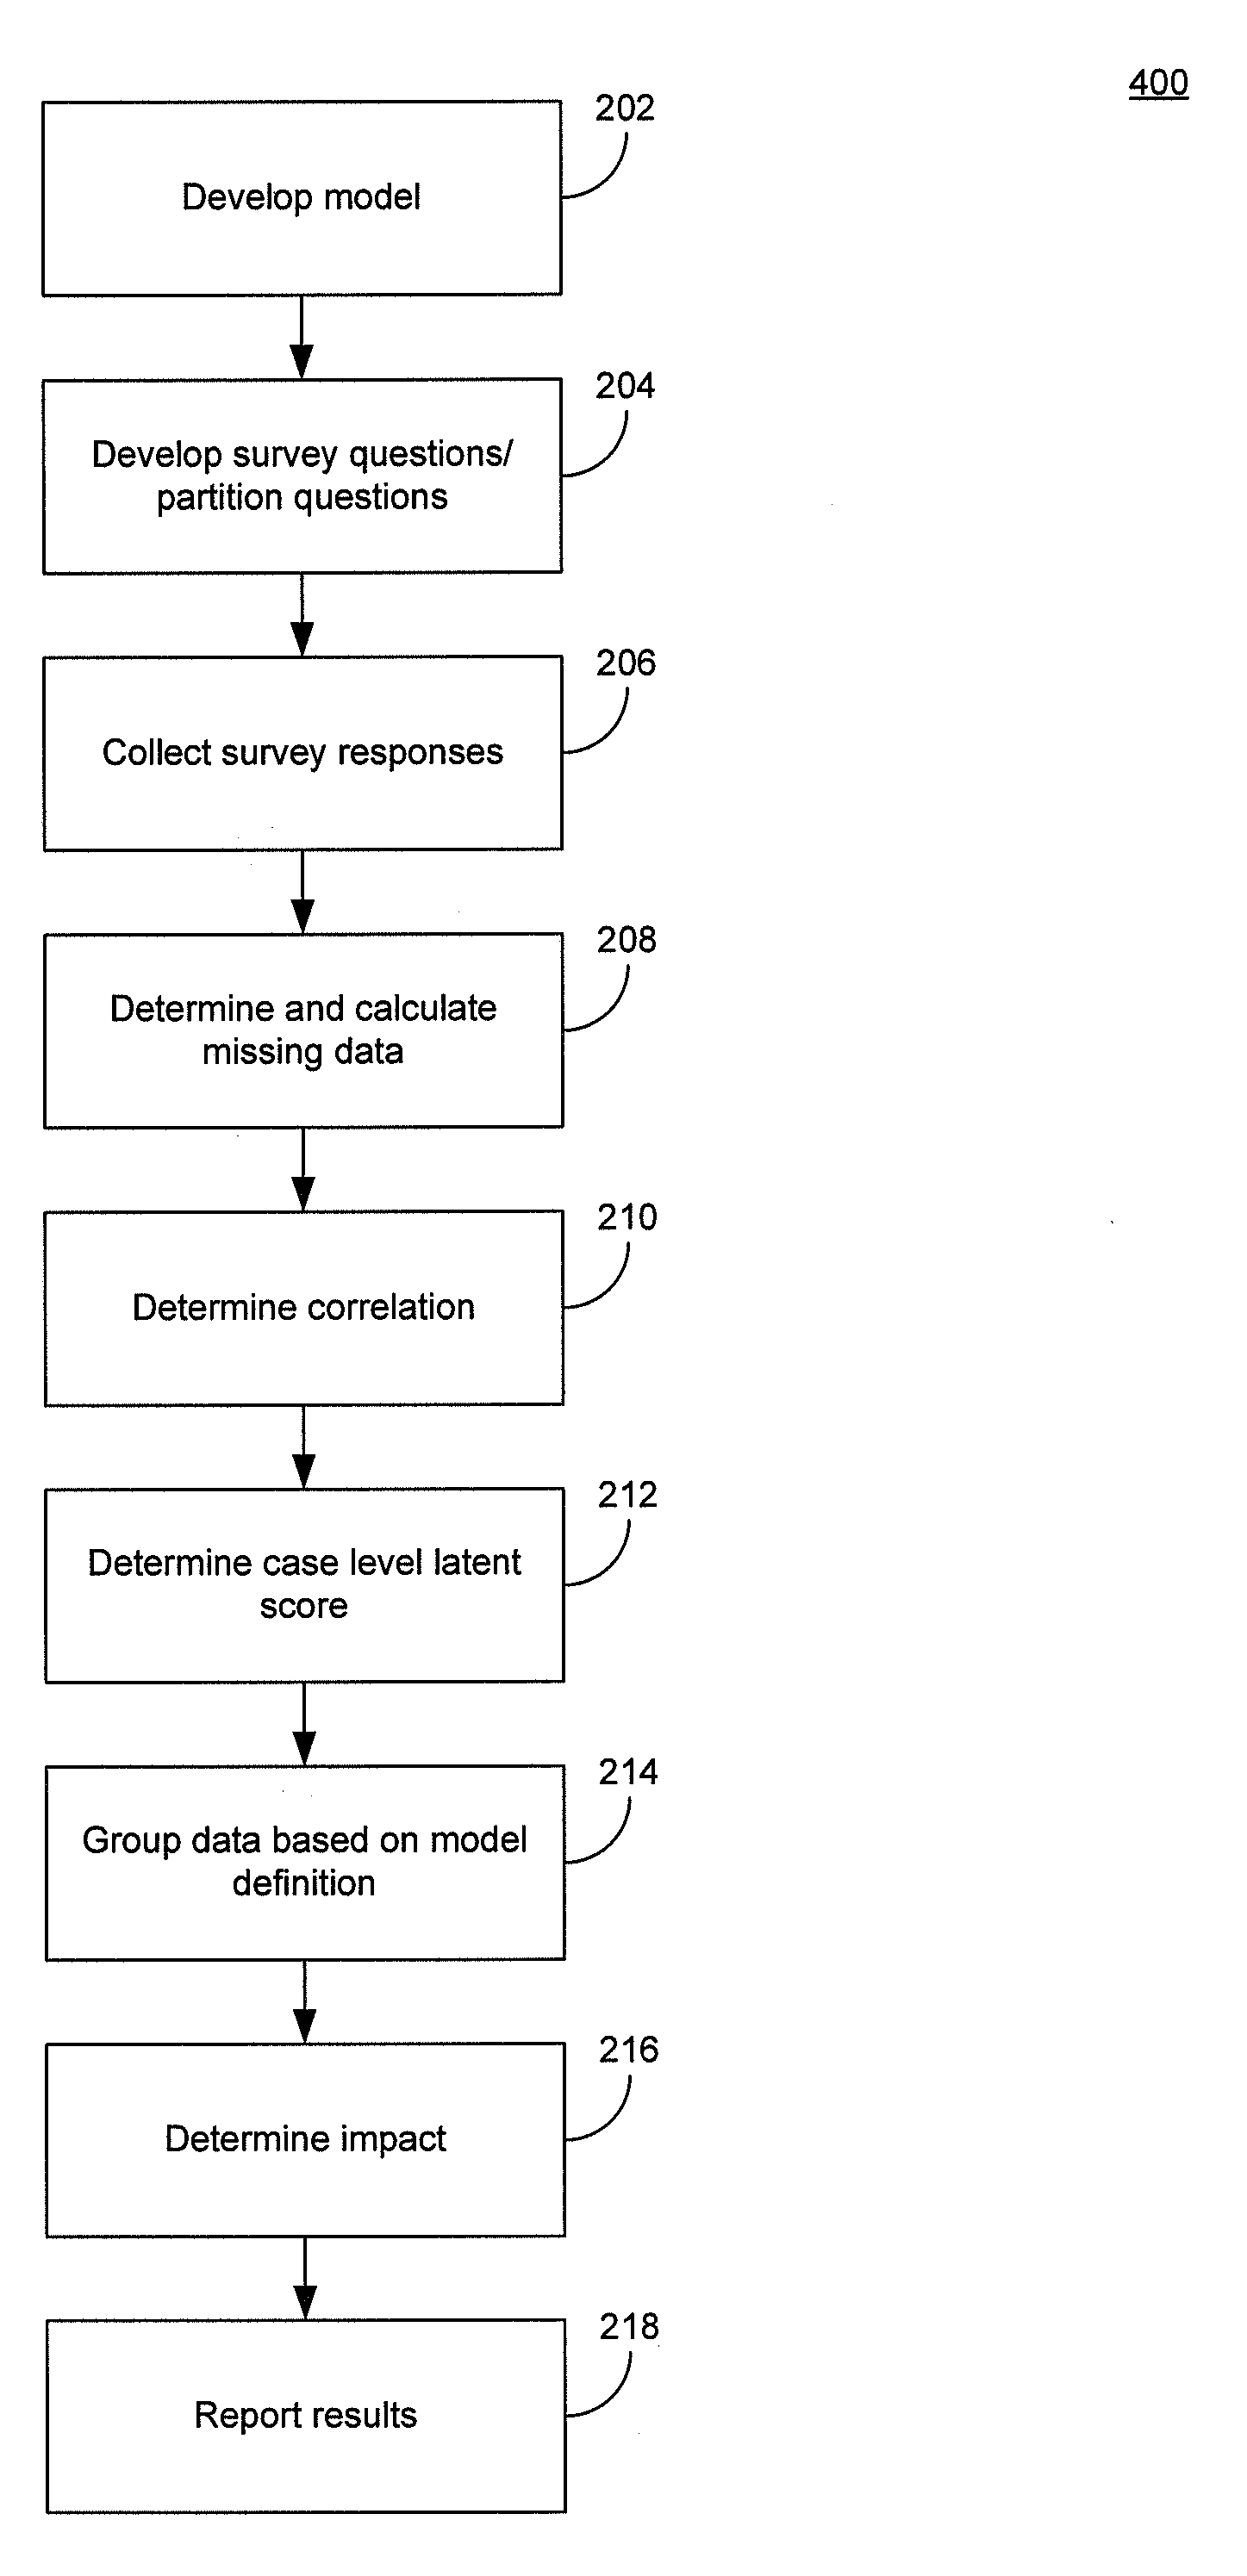
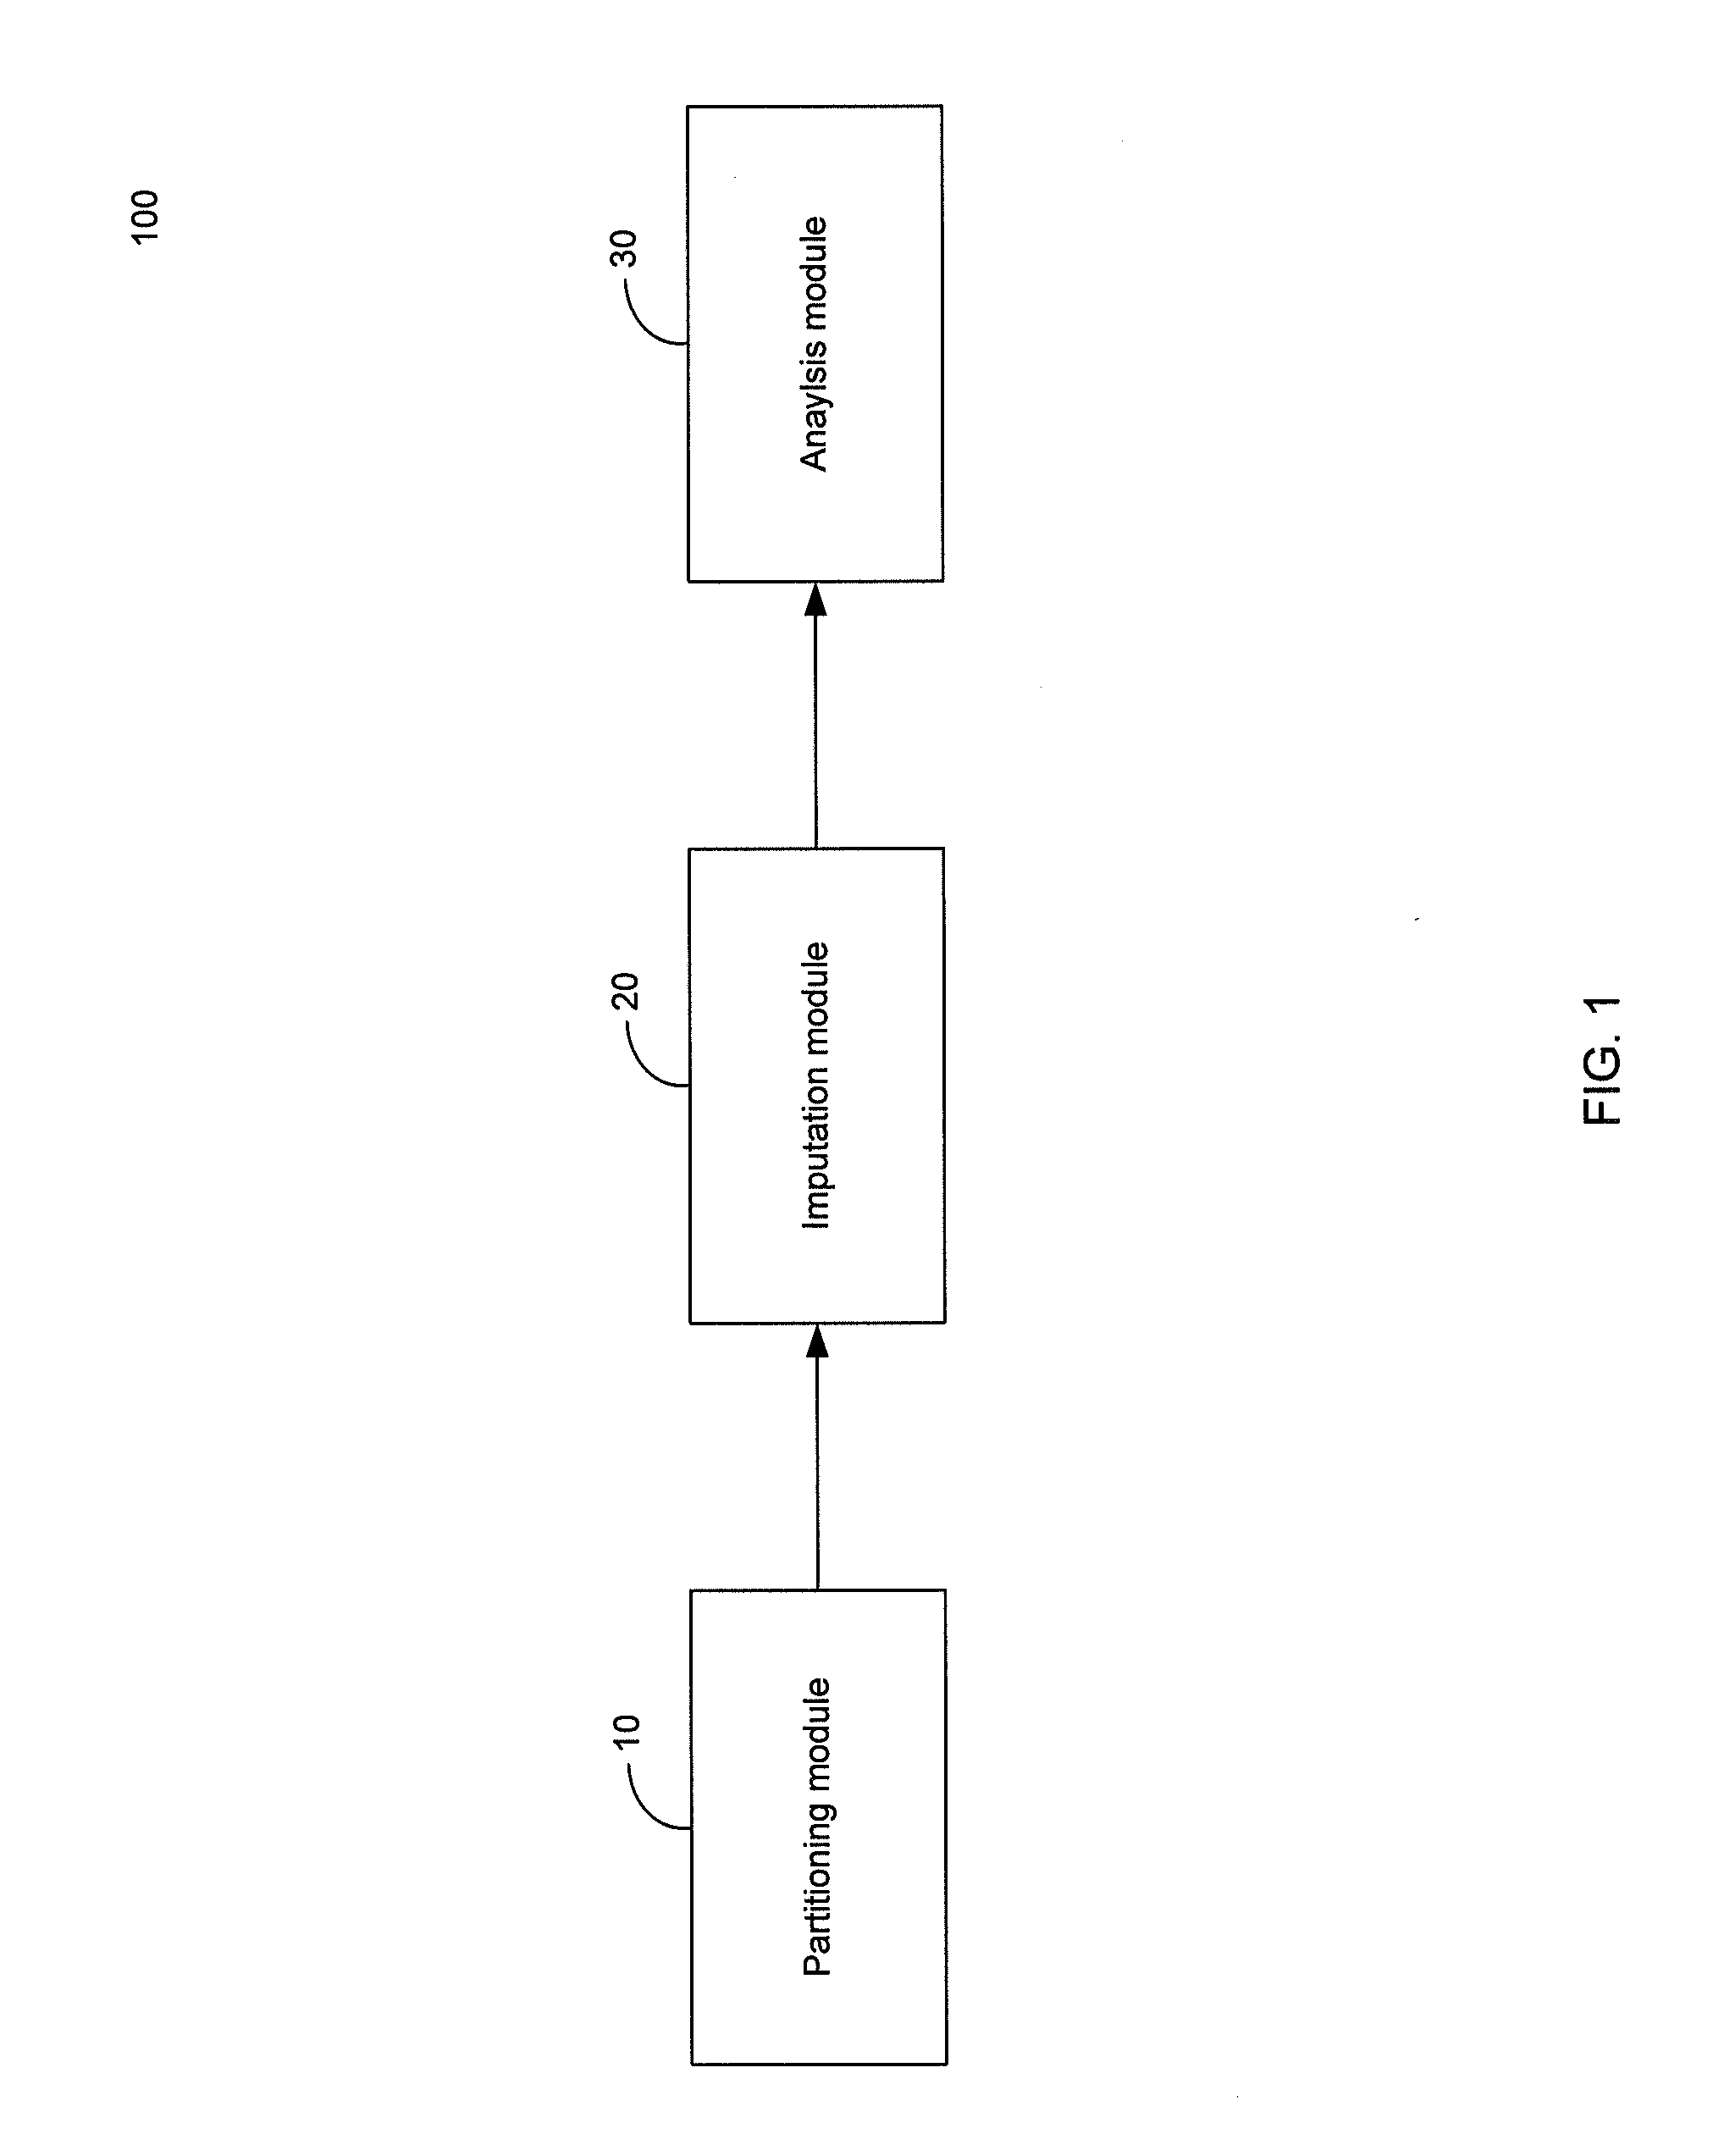
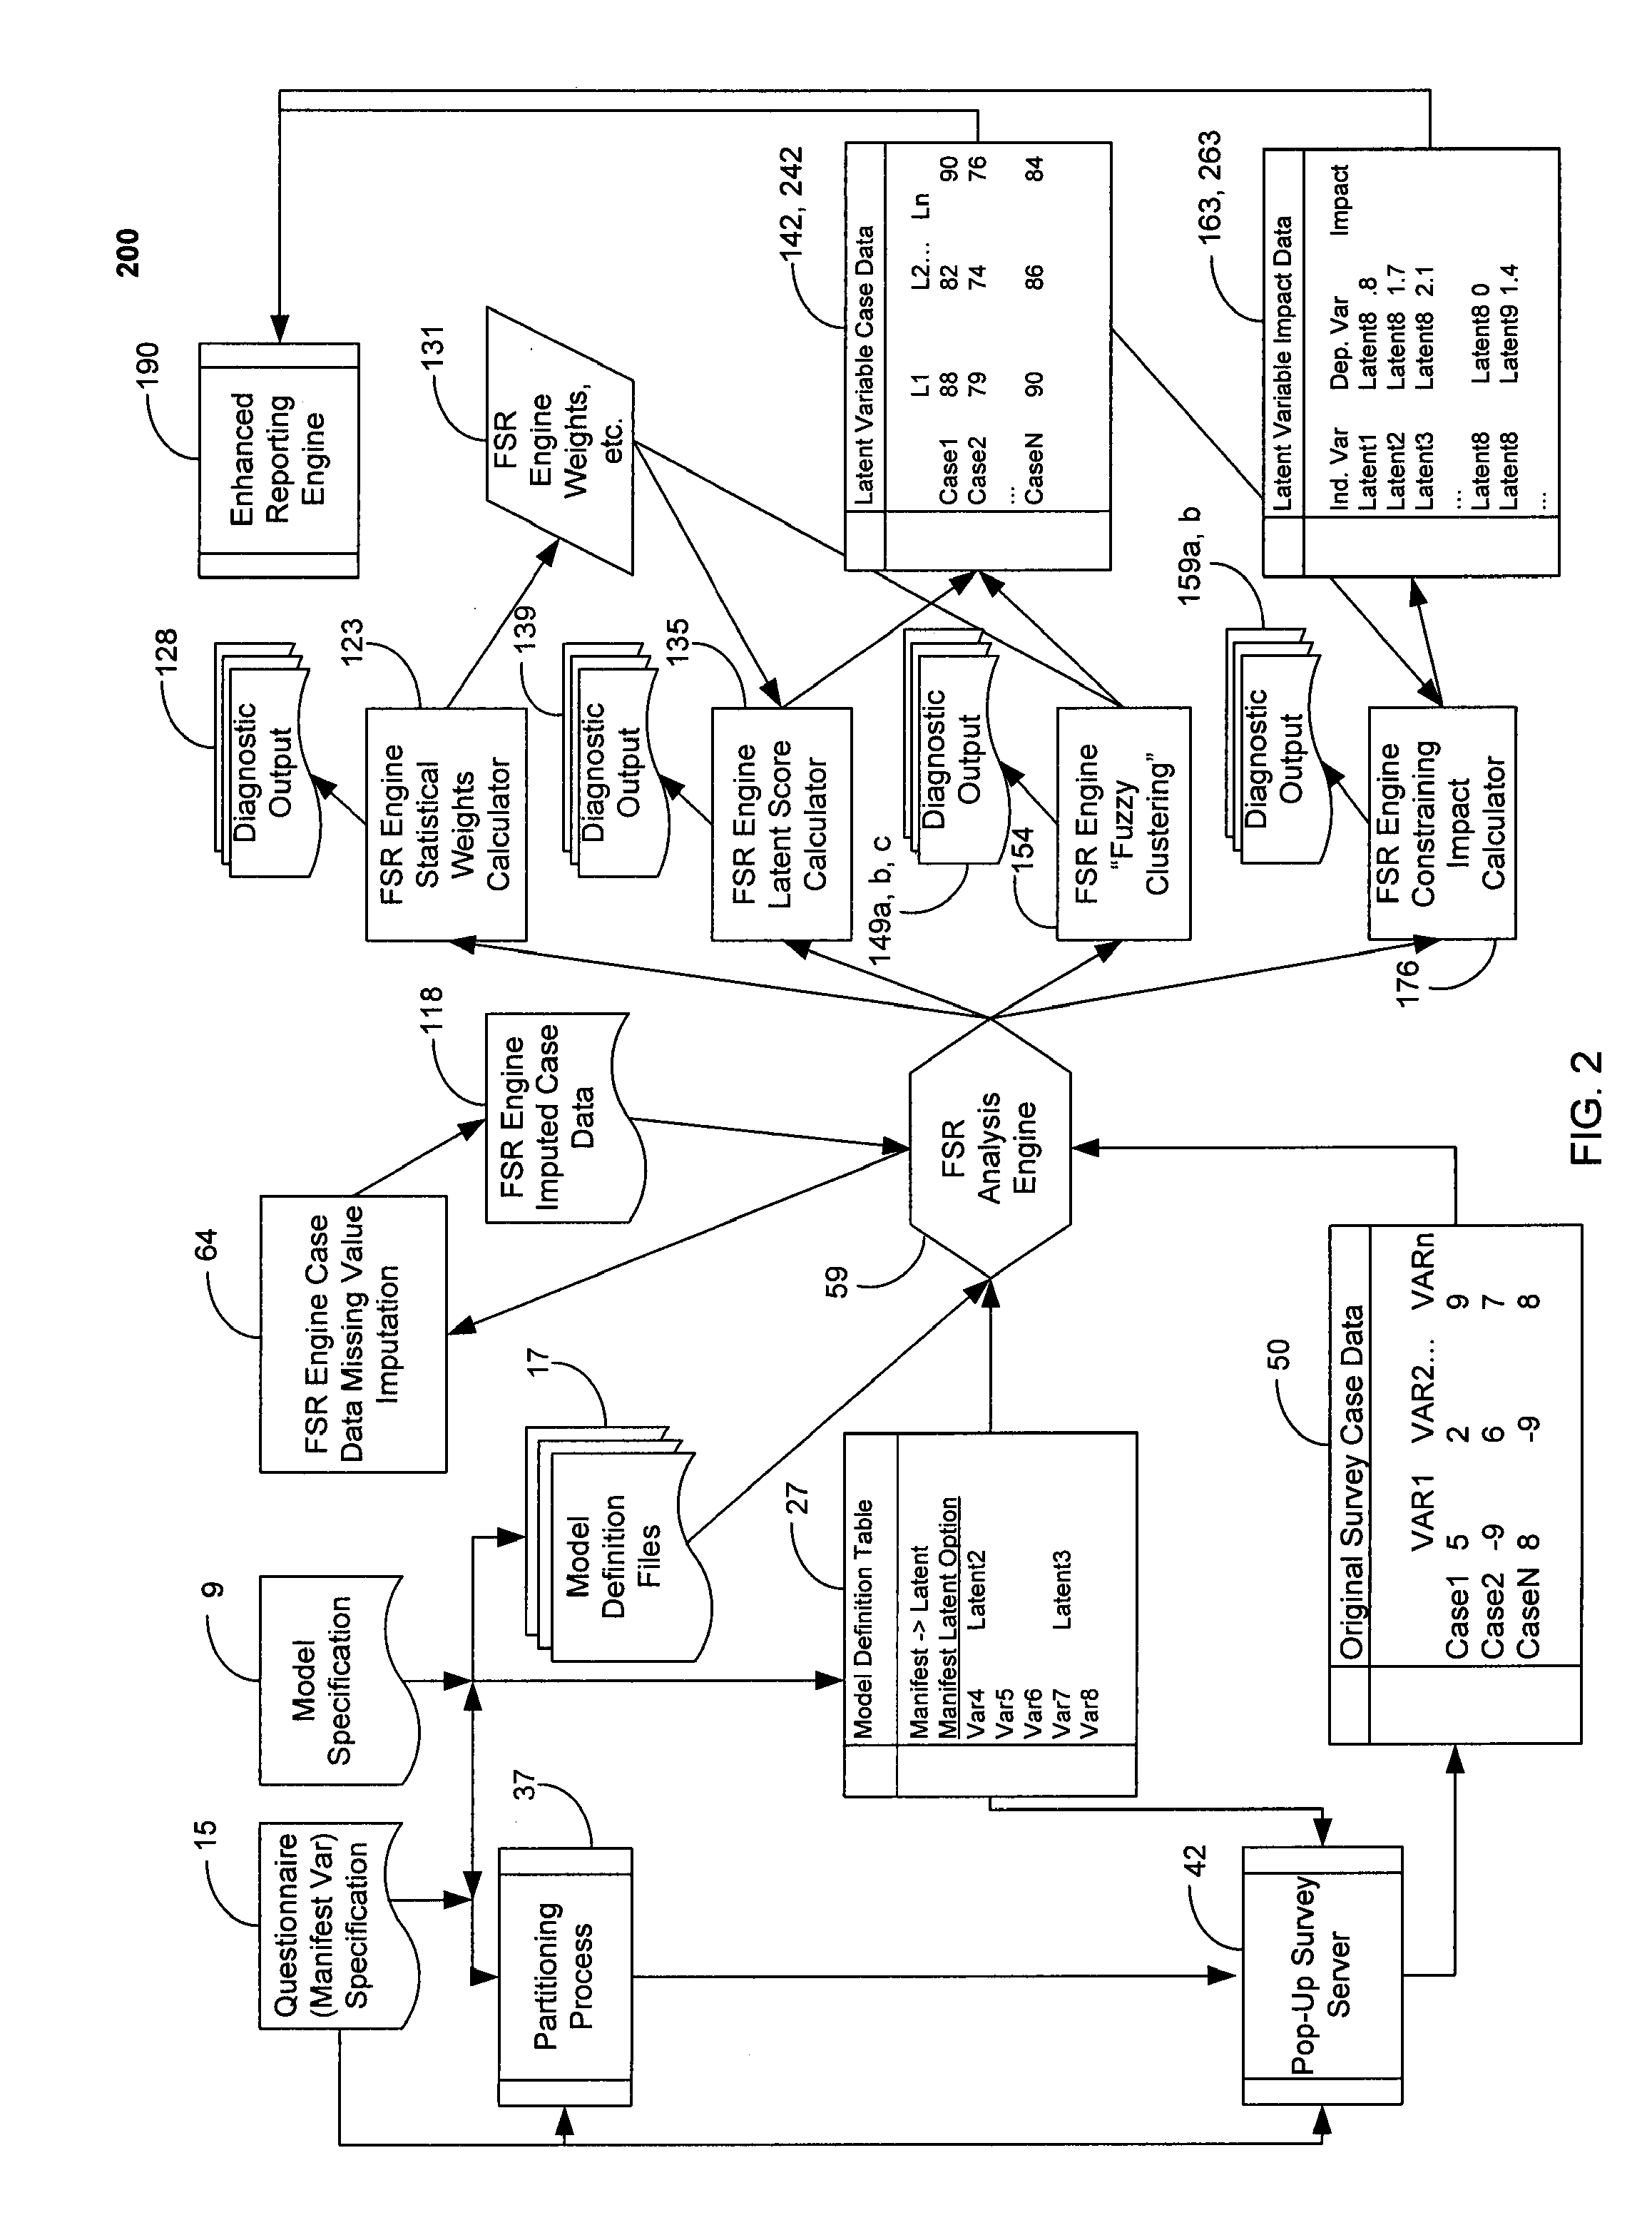
[0016]As shown in FIG. 1, the present invention may be generally arranged in three sections, partitioning module 10, imputation module 20 and analysis module 30. During operation, data, which may be in the form of survey responses, is processed by partitioning module 10 and grouped into subsets that facilitate the correlation of certain latent variables to certain manifest variables in the data. One way this may be accomplished is by separating surveys into smaller sections in order to reduce respondent fatigue. In some embodiments, these surveys may by stored in one or more pop-up servers and provided to respondents on rotating basis.

[0017]Next, imputation module 20 may estimate or otherwise determine the value of any data “missing” from that provided to partitioning module 10. In embodiments of the invention, it is contemplated that at least some data will be “missing” in an effort to decrease the length of the required survey questionnaire (e.g., purposefully omitted but derivabl...


PUM


Abstract

In accordance with the teachings of the present invention, a computer-implemented apparatus and method is provided for determining the impact of certain actions on the performance of a pre-specified or modeled system is provided. A manifest variable database is utilized for storing manifest variable data relating to user interaction with a system of interest. An imputation module may be coupled to the manifest variable database for calculating any missing manifest variables. Embodiments of the invention may further include a statistical weights calculator for determining strength of correlation among manifest and latent variables, a latent score calculator, a fuzzy clustering module that derives clusters or segments that have their own impacts and scores for a fitted model and constraining impact calculator that determines the impact of certain operations on the fitted model.

Description

BACKGROUND OF THE INVENTION[0001]The present invention relates generally to statistical analysis computer systems. More particularly, the present invention relates to statistical impact analysis computer systems.[0002]The desire to improve product quality and the end-user experience is ubiquitous to nearly all manufacturing and service industries. As a result, there is great interest in improving the quality of products and services and their environments through systematic performance evaluation followed by the completion of the business process. Some (but admittedly few) industries are fortunate to have easily quantifiable metrics to measure the quality of their products and services. Using these metrics a continuous improvement process can be implemented, whereby (a) the product or service is produced using existing processes and assessed using quantifiable metrics, (b) the existing processes are then changed based on the results of the metrics, and (c) the efficacy of the change...

Claims


Application Information

Patent Timeline
Patent Type & Authority Applications(United States)
IPC IPC(8): G06F17/30
CPCG06Q30/0201G06Q10/063
Inventor COHEN, MITCHELLMERZ, G. RUSSELLSMITH, JEFFREY L.HWANG, HEUNGSUN
Owner FORESEE RESULTS
Learn More