Method of generating a mass spectrum having improved resolving power

a mass spectrum and resolving power technology, applied in the field of mass spectrum generation, can solve the problems of reducing the resolution of the signal, so as to improve the resolution power, and improve the resolving power

Active Publication Date: 2012-05-03
THERMO FISHER SCI BREMEN
View PDF9 Cites 22 Cited by
  • Summary
  • Abstract
  • Description
  • Claims
  • Application Information

AI Technical Summary

Benefits of technology

[0020]According to a further aspect of the present invention there is provided a method of improving the resolving power of mass spectrometric analysis of ion peaks closely separated in m / z domain, comprising:
[0030]The present invention provides a method of improving the resolving power and enables the resolving power of a mass spectrometer employing image current detection, such as FTMS, to be increased beyond the limits imposed by the duration of the image current signal. The composite mass spectrum formed by the histogram of the centroids has a significantly higher resolving power than the acquired mass spectra immediately after transformation of the image current signal from the time domain. Moreover, the invention may be implemented with relatively low computational effort. The resolving power in a mass spectrum is defined as the observed mass (m) divided by the difference between two masses (Δm) that can be separated, i.e. m / Δm.
[0037]When during detection the probability of two peaks overlapping is low, such as happens when the conditions in the spectrometer are such that most of the peaks found in a mass spectrum are due to individual ions, the measured centroid indicates quite accurately and precisely (e.g. within a few ppm or even a few ppb) the (mass or frequency) position of the ion, e.g. the corresponding isotope of analyte. When this factor is coupled with the high mass precision of the image current detection method, a histogram or distribution of centroids on mass generated after acquiring a sufficient number of mass spectra, enables an improvement in resolving power to be achieved, e.g. using a data group width in the histogram significantly smaller than the data group width of the original transformed mass spectra. In other words, after acquiring a sufficiently large number of mass spectra, and determining the centroids from the spectra, the histogram of centroids will start to approximate the real mass spectrum of the analyte but with improved resolving power.
[0041]Preferably a sufficient number of mass spectra are acquired such that the histogram of the centroids determined from the mass spectra will approximate the real mass spectrum of the analyte. Preferably at least 10, more preferably at least 100 and most preferably at least 1000 (typically many thousands, even 10,000 or more) spectra are acquired to form the histogram. The acquisition of 10,000 spectra typically takes above 2 hours at a pace of 1 spectra per second. Such a histogram thus constitutes a synthetic or composite spectrum which may have a much higher resolution or resolving power than the “raw” resolving power of the original acquisition, e.g. of the Fourier transformed spectrum. With the use of present invention, from the histogram the mass position of a peak may be determined to 0.5, or 0.2, or 0.1, or even less, of the data group width of the Fourier-transformed spectrum, This can be achieved by using a data group width in the histogram which is at least 2 times narrower than the data group width of the acquired mass spectra in the m / z domain. Preferably (in order of increasing preference), the data group width in the histogram is at least 3 times, at least 4 times, at least 5 times, at least 6 times, at least 7 times, at least 8 times, at least 9 times, at least 10 times, narrower than the data group width of the acquired mass spectra in the m / z domain. Practically, an improvement in resolving power of 3-6 times or greater can be readily achieved using the present invention, the improvement being greater for higher signal-to-noise ratios of the peaks and longer detection times.

Problems solved by technology

However, FTMS requires relatively long detection times to achieve high resolving powers.
This method of increasing the resolving power by increasing detection time has potential drawbacks, such as signal decay over time (e.g. due to de-phasing, or ion loss by collisions) which limits the maximum achievable resolution.
The signal may also deteriorate over time, e.g. due to frequency drift, further limiting the maximum achievable resolution or resolving power.
However, the coherency of an ion packet or even its very existence cannot always be supported for a long time.
However, there exist obstacles to the improvement of resolving power for a given detection or acquisition time.
Technical solutions like, e.g., increase of the magnetic field in FT-ICR-MS or changes to the field geometry and voltages of an Orbitrap™ MS, may be difficult or prohibitively expensive.

Method used


Image

  • Method of generating a mass spectrum having improved resolving power
  • Method of generating a mass spectrum having improved resolving power
  • Method of generating a mass spectrum having improved resolving power

Examples


Embodiment Construction

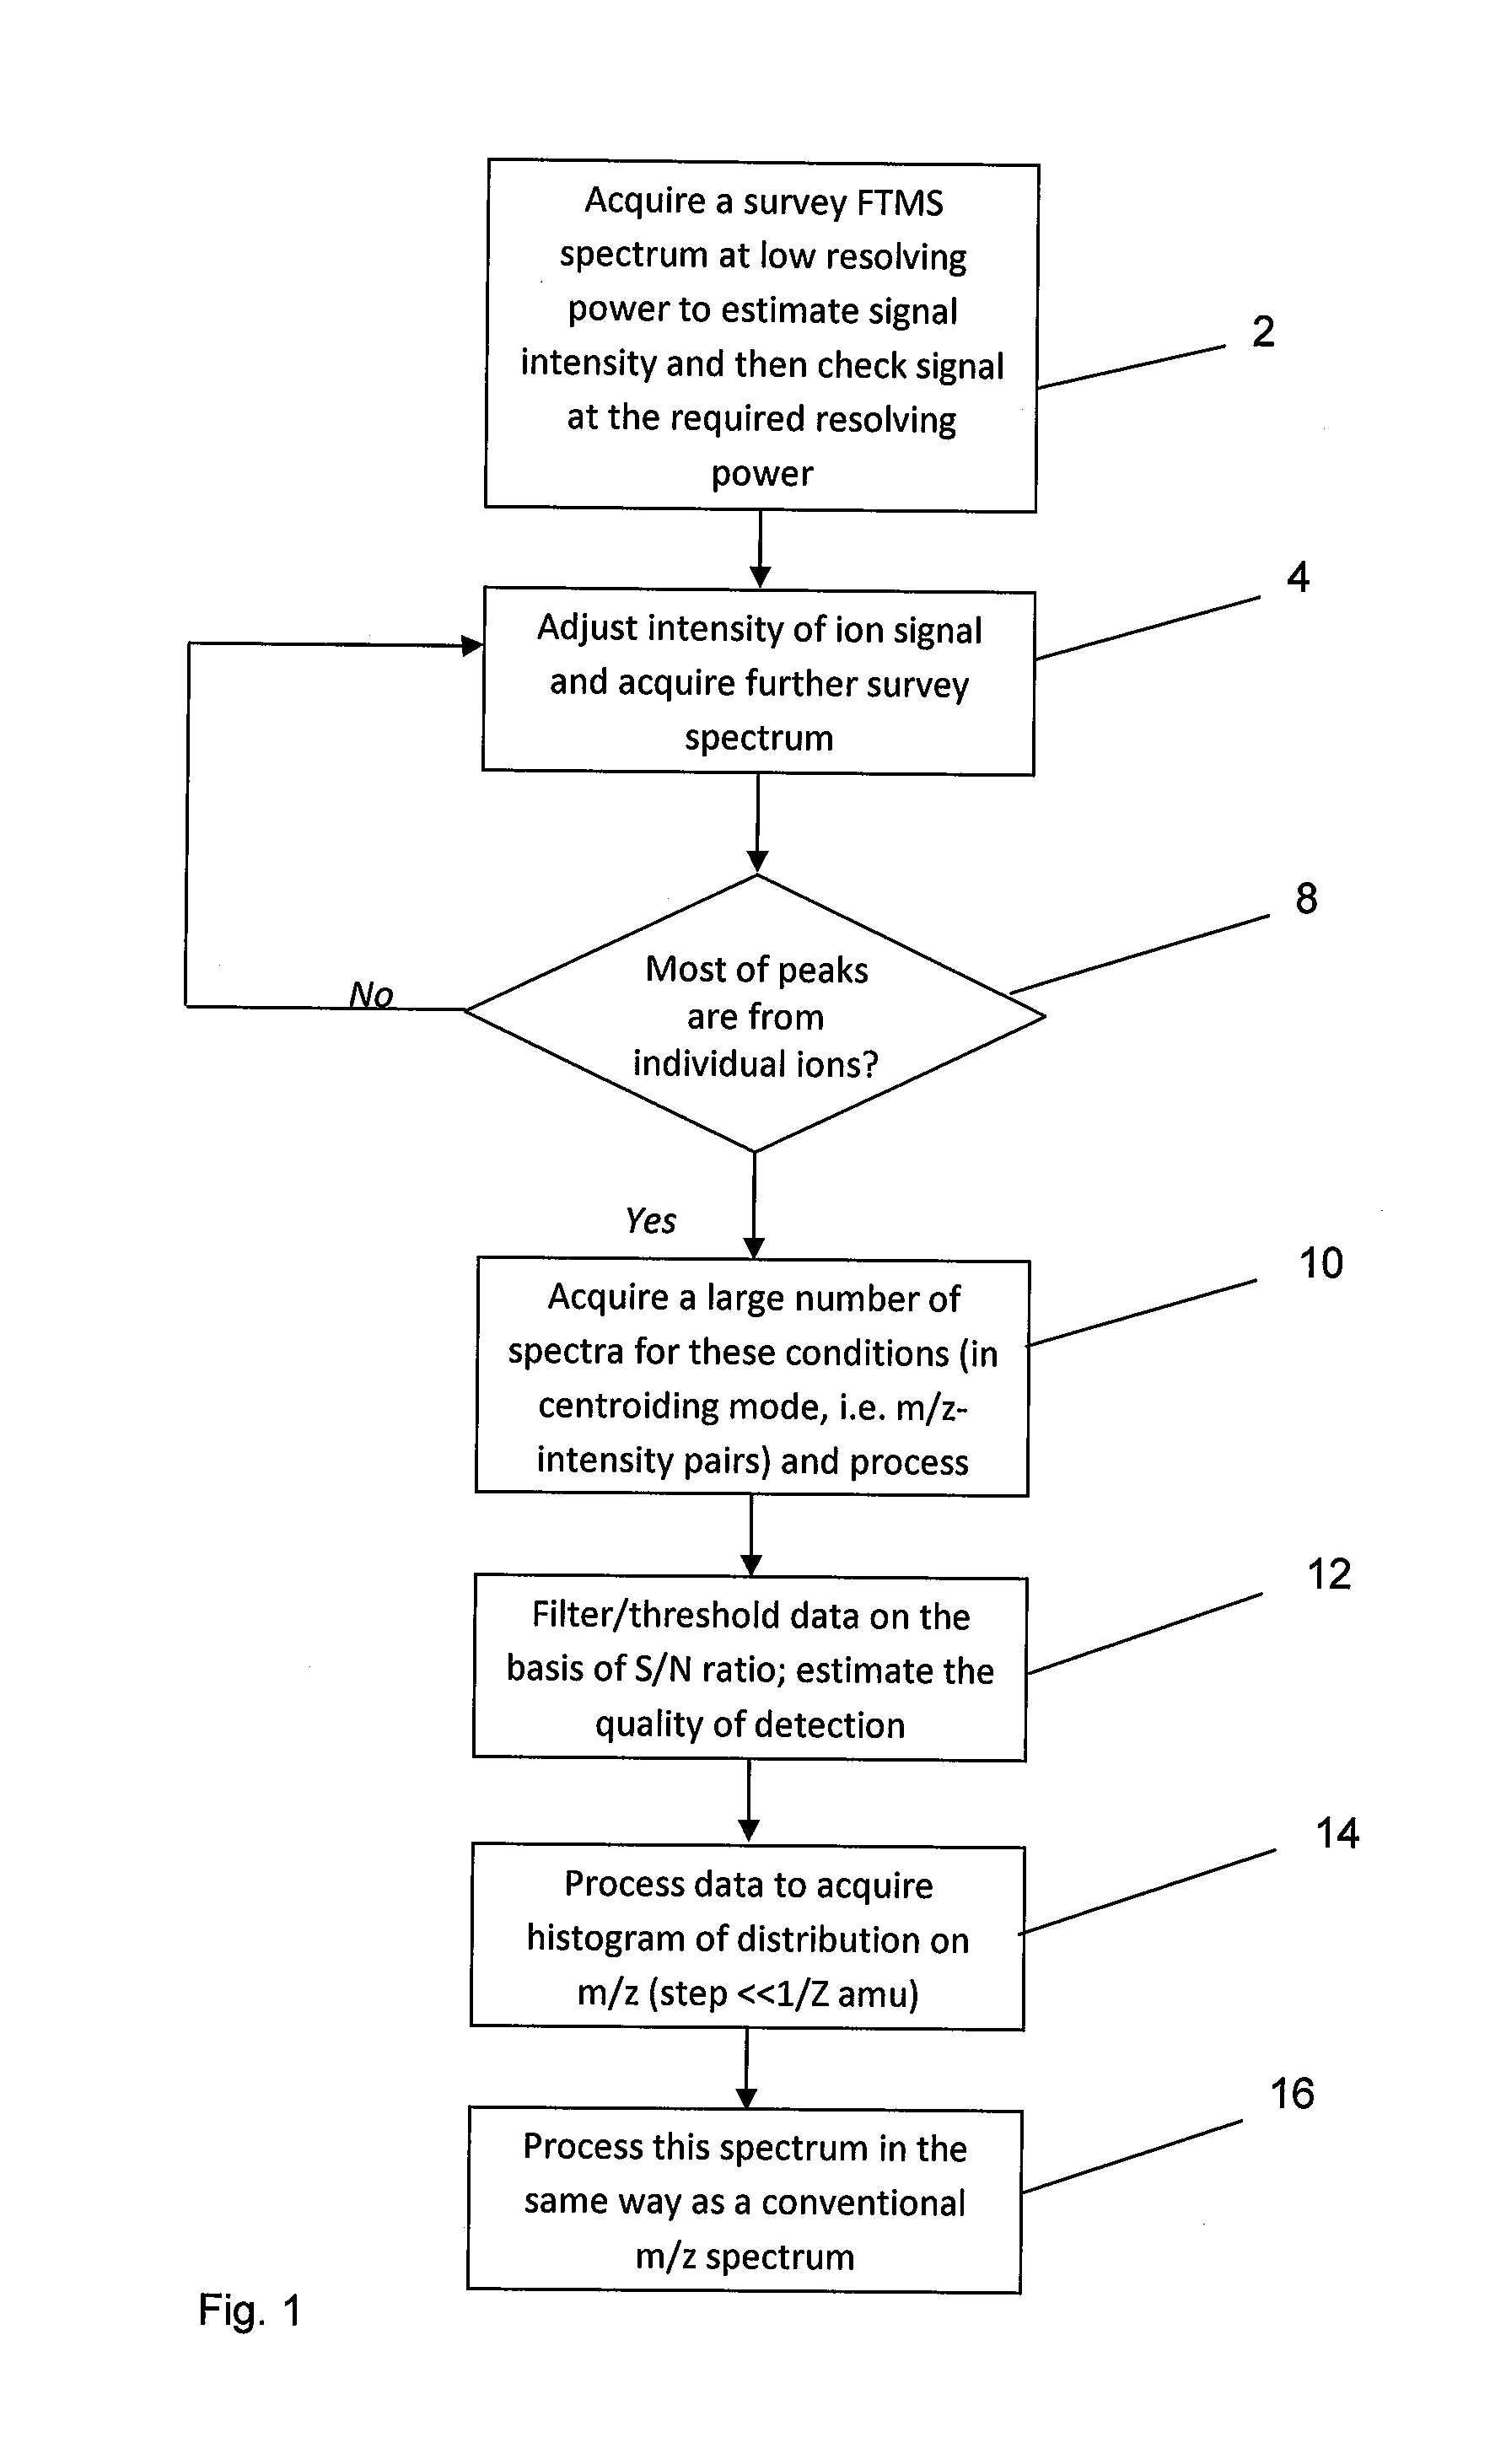
[0079]The method shown schematically in FIG. 1 comprises steps 2 to 8 which are steps for optimising the ion signal or peak intensity for carrying out the method according to the present invention. Referring to FIG. 1 in a preliminary step 2 a first mass spectrum is acquired from an FT mass spectrometer, such as an FT-ICR or Orbitrap™ spectrometer for example, using image current detection. The mass spectrum is a spectrum obtained after Fourier transformation of the transient generated from image current detection of the oscillating ions in the spectrometer. This first spectrum acts as a first survey spectrum and, for example, may possibly be acquired using normal acquisition parameters of the spectrometer, e.g. with relatively high ion load. Alternatively, if the acquisition parameters for running the method of the present invention are approximately known (e.g. from a previous experiment), it may save time to acquire the first survey spectrum with the approximately correct paramet...


PUM


Abstract

A method is disclosed for generating a mass spectrum, e.g. for Fourier transform mass spectrometry, having improved resolving power. The method includes steps of acquiring a plurality of mass spectra from a mass spectrometer using image current detection determining the centroids of at least some of the peaks which have a sufficient signal-to-noise (S / N) ratio so that the variation of the centroid of each such peak from the plurality of mass spectra is significantly lower than the full-width at half-maximum, dM, of the peak in the m / z domain; and generating a histogram of the centroids determined from the plurality of acquired mass spectra thereby forming a composite mass spectrum. The resultant composite mass spectrum comprises peaks having full-width at half-maximum, dMC, significantly narrower than the peak width, dM, of the corresponding peaks in the plurality of acquired mass spectra.

Description

CROSS-REFERENCE TO RELATED APPLICATION[0001]This application claims the priority benefit of European Patent Application No. 10189667.8, filed Nov. 2, 2010, which application is incorporated herein by reference in its entirety.FIELD OF THE INVENTION[0002]This invention relates to a method of generating a mass spectrum. The method is useful for a mass spectrometer employing image current detection of ions. The invention may be used for the production of high resolving power mass spectra and these spectra may be used for the identification and / or quantification of organic compounds, e.g. macromolecules and active pharmacological ingredients, metabolites, small peptides and / or proteins.BACKGROUND OF THE INVENTION[0003]Mass spectrometers are widely used to separate and analyse ions on the basis of their mass to charge ratio (m / z). For certain types of mass spectrometer which acquire data in the form of a transient, for example by detection of an induced oscillating image current, the use...

Claims


Application Information

Patent Timeline
Patent Type & Authority Applications(United States)
IPC IPC(8): G06F19/00G16C20/20
CPCH01J49/0036G16C99/00H01J49/027H01J49/38G16C20/20
Inventor MAKAROV, ALEXANDER ALEKSEEVICH
Owner THERMO FISHER SCI BREMEN
Why Eureka
Try Eureka