Agricultural management using biological signals

a biological signal and agricultural technology, applied in the field of agricultural management using biological signals, can solve the problems of less useful as a daily or weekly crop condition indicator, less helpful as a decision-making tool, and inability to determine plant health or condition as easy, so as to achieve the desired crop effect

Inactive Publication Date: 2012-05-17
SMARTFIELD
View PDF1 Cites 53 Cited by
  • Summary
  • Abstract
  • Description
  • Claims
  • Application Information

AI Technical Summary

Benefits of technology

0015]The present invention relates to a method, apparatus and system for monitoring, analyzing and responding to crop temperature fluctuations in a manner that maximizes desired crop outcome.

Problems solved by technology

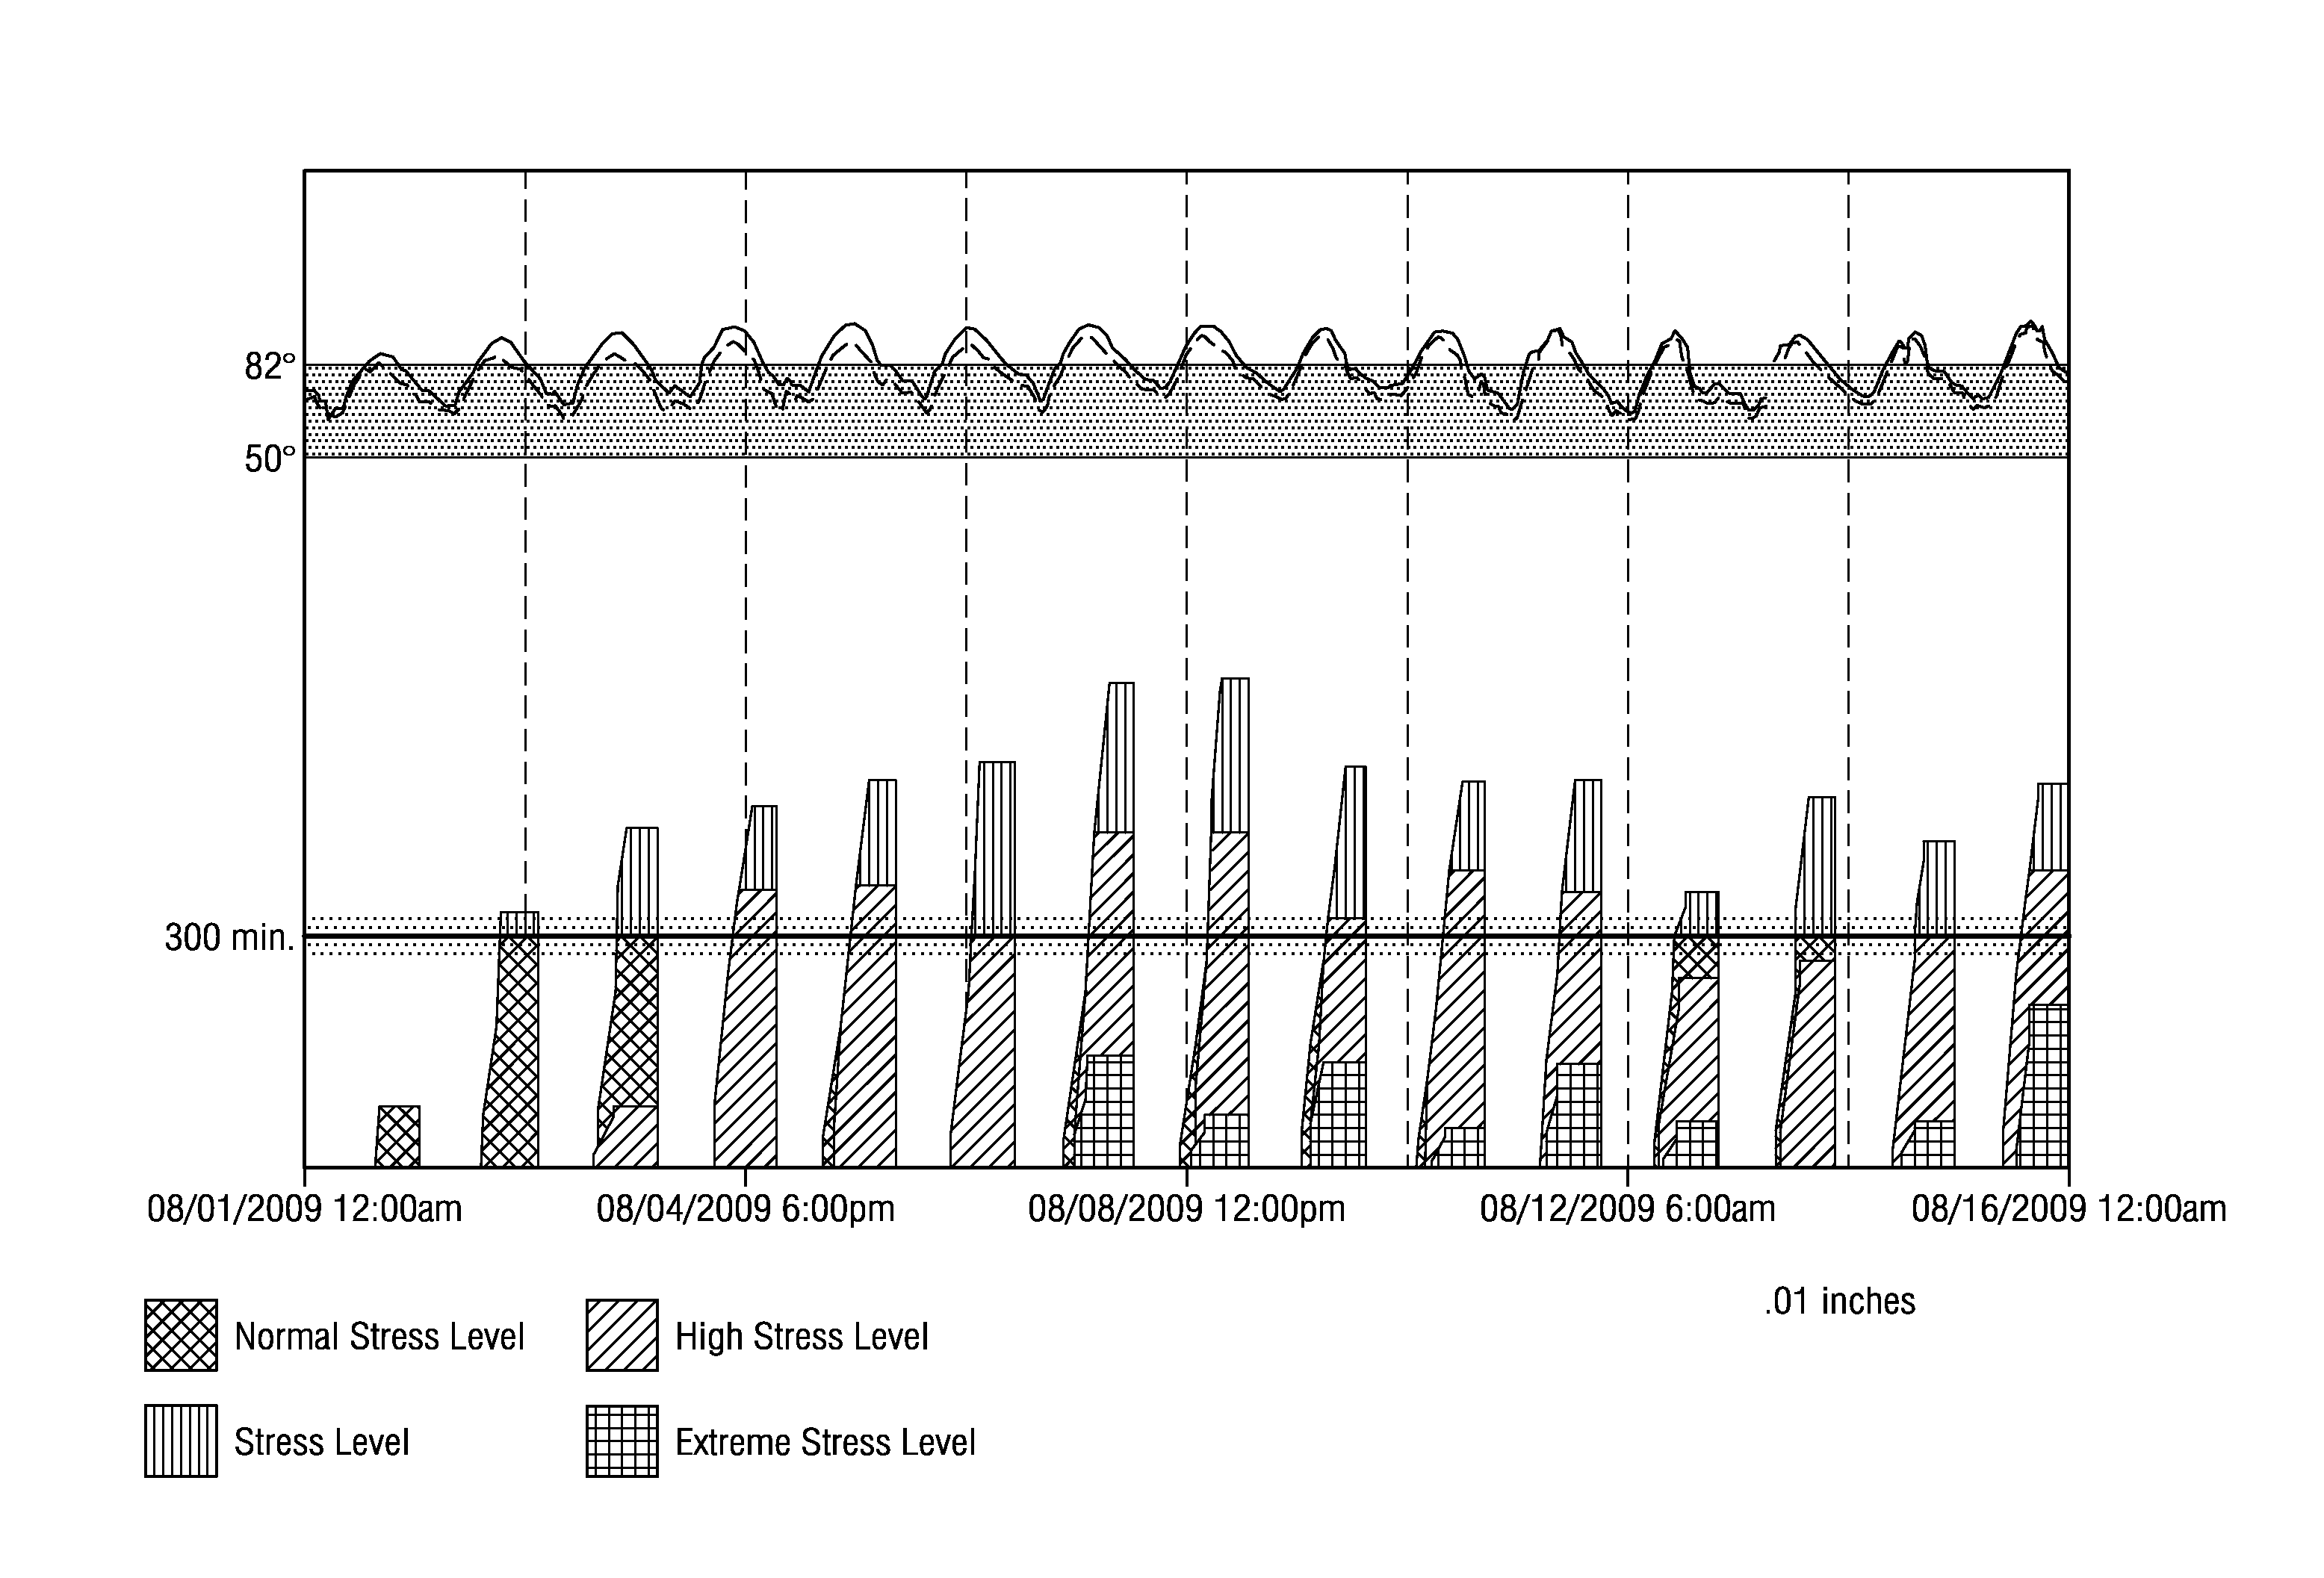
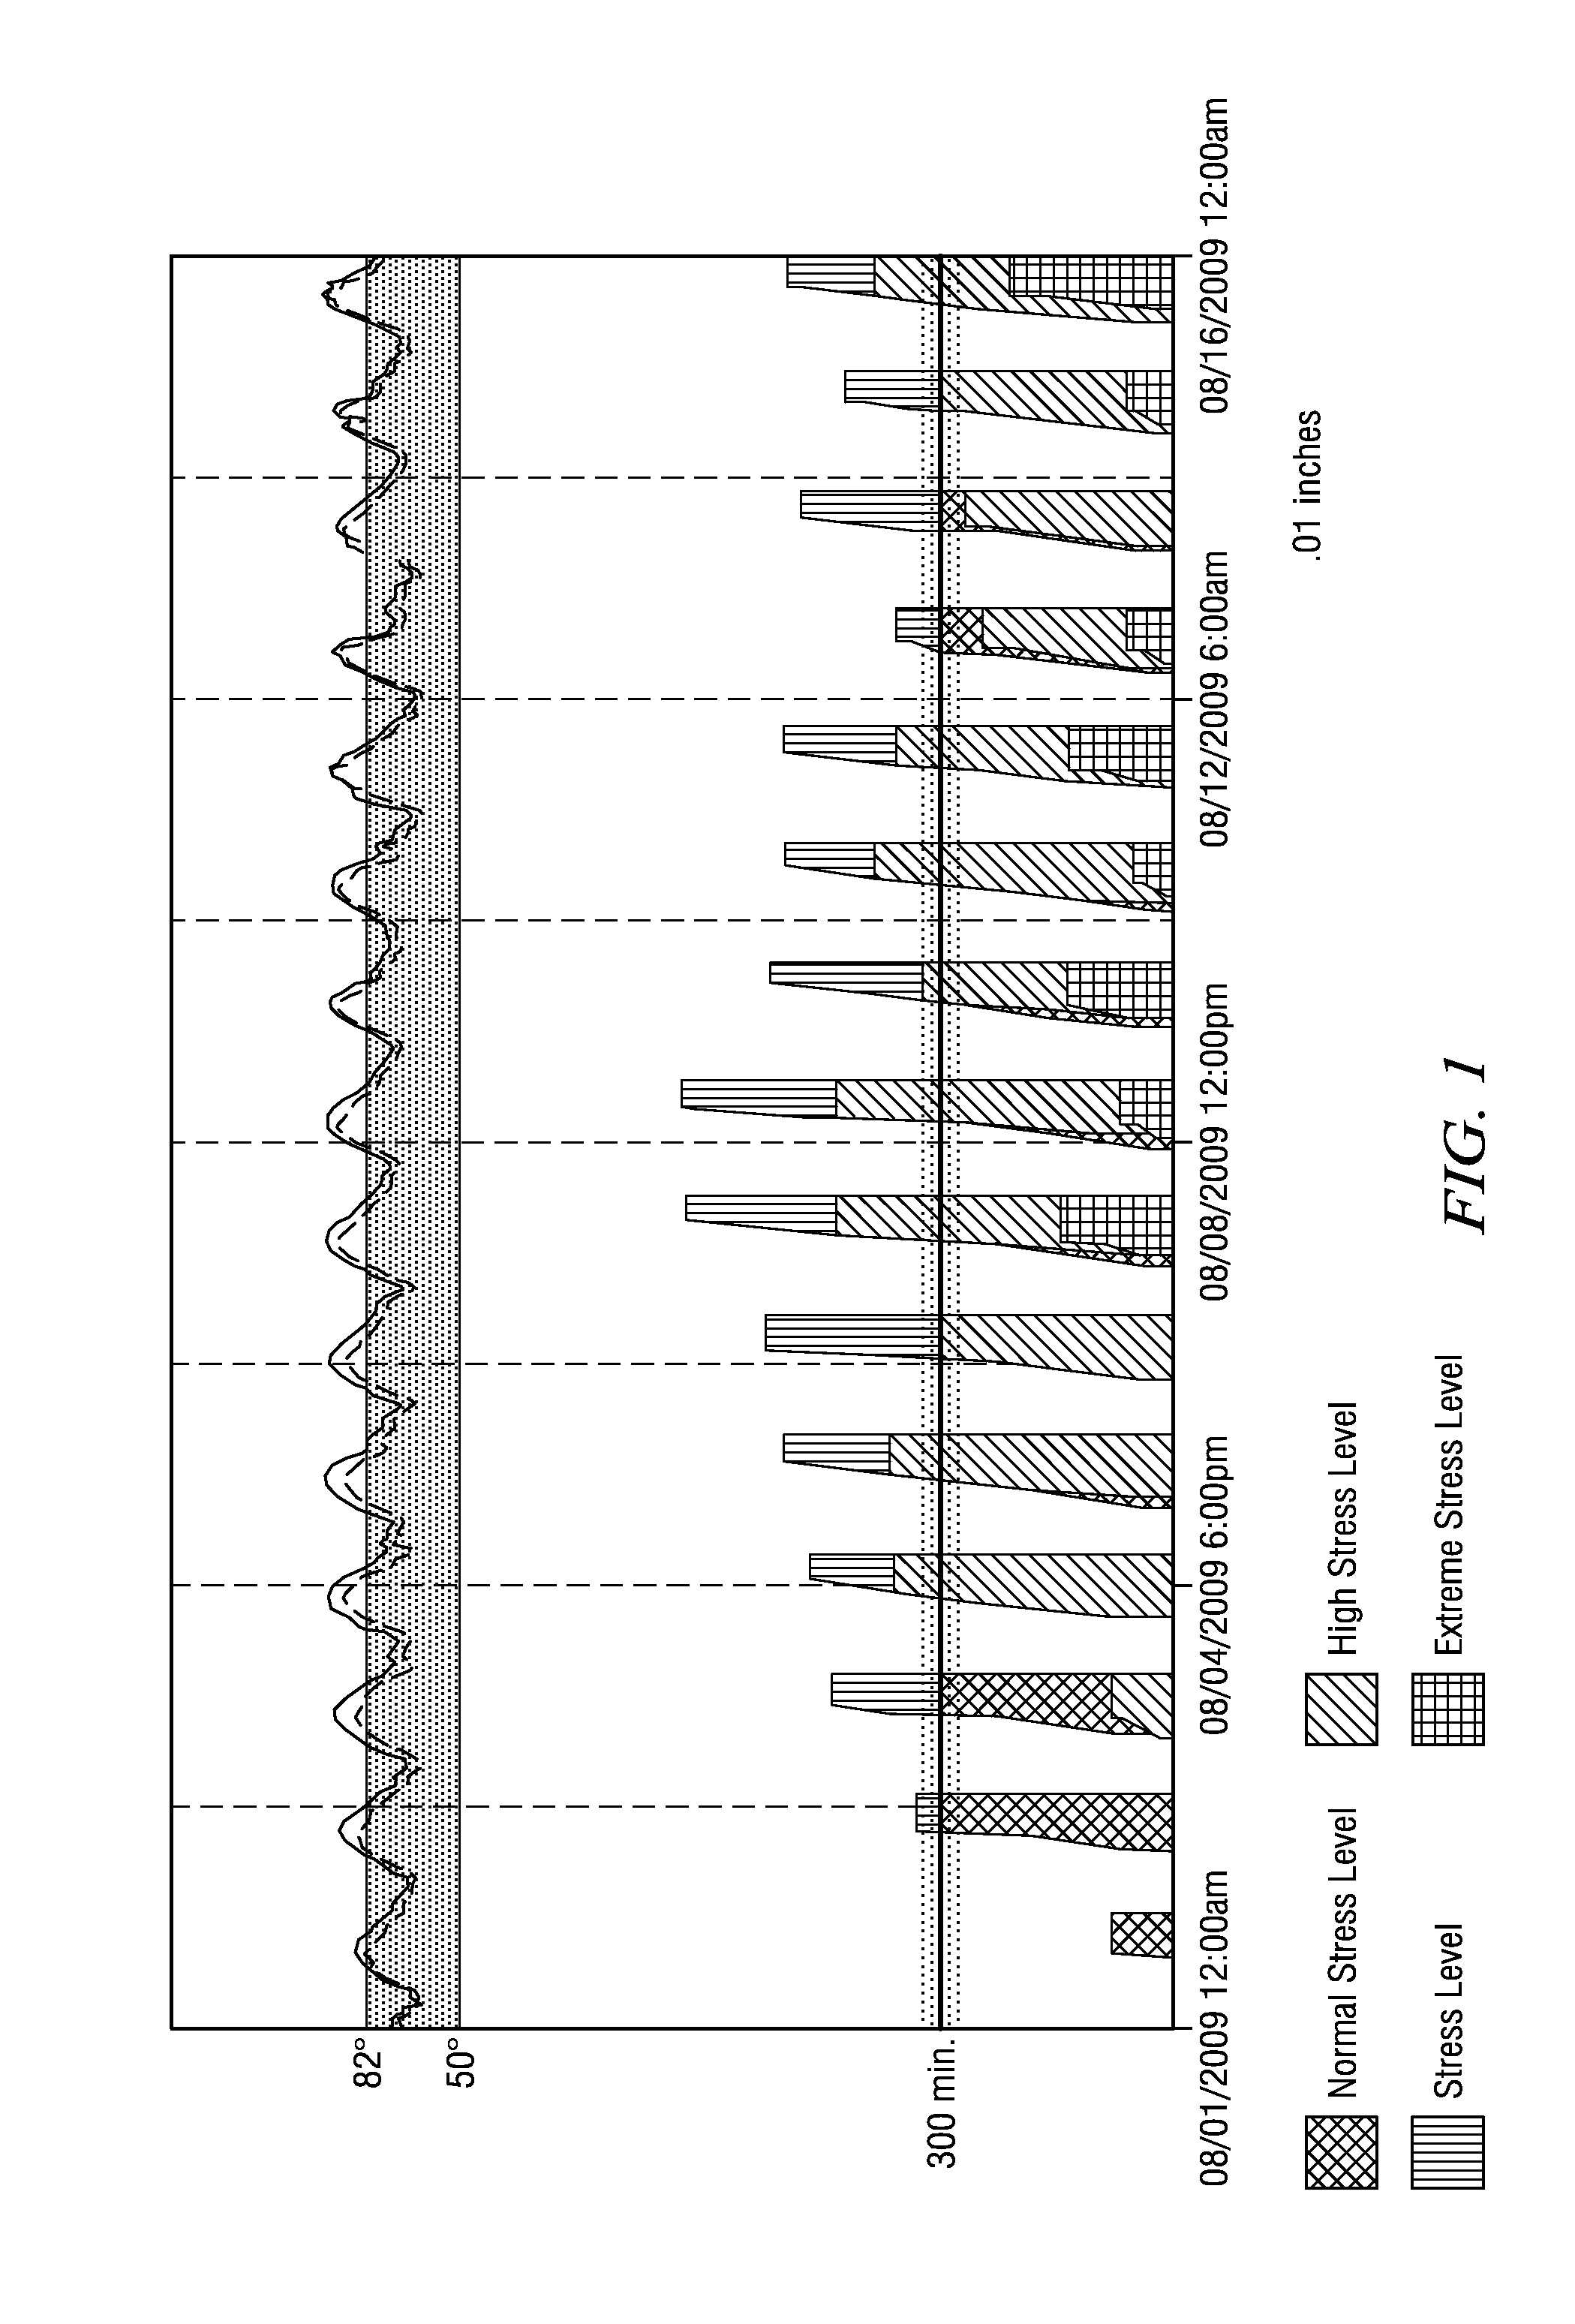
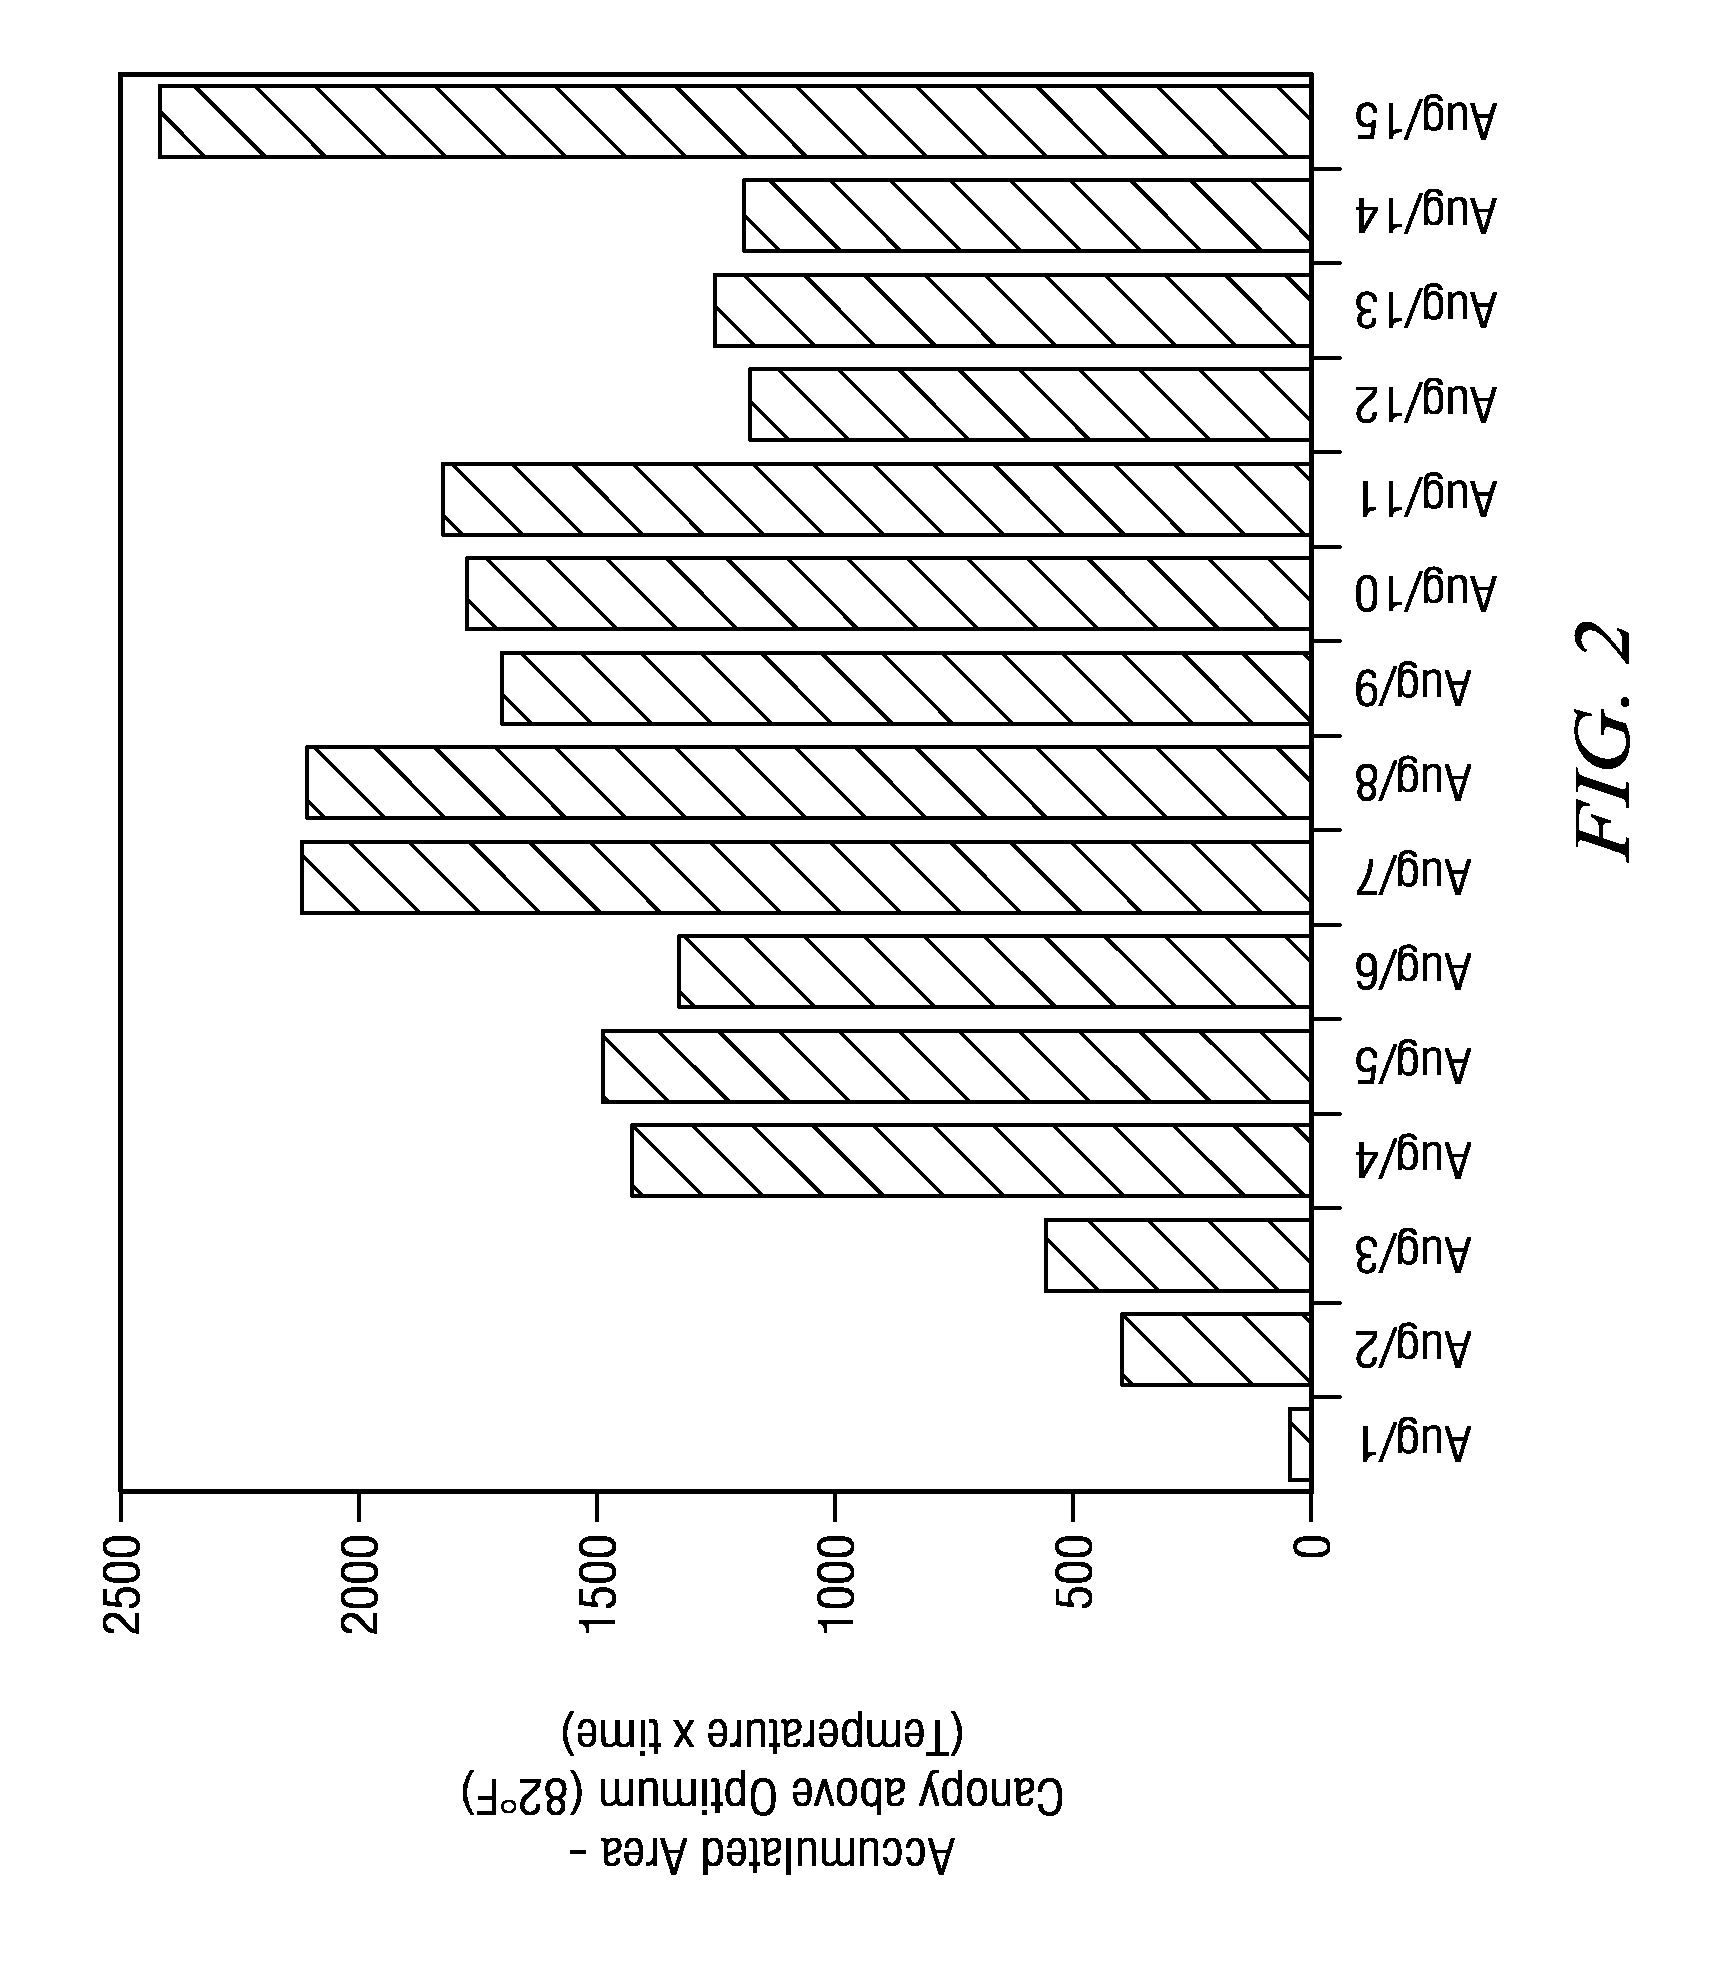
While GDD calculations recognize that daily temperatures above a certain level do not increase the speed at which the crops mature, the GDD methodology does not account for the negative impact of the crop's actual temperature (typically measured at the canopy) above its optimum.
Although knowing a crop's heat units is extremely helpful in determining crop maturity, it is less helpful as a daily or weekly crop condition indicator and, consequently, less helpful as a decision making tool.
Determining plant health or condition is not, however, as easy as simply assessing crop canopy temperature at a given time.
While crop canopy temperature can be used to determine if a crop is stressed, it can lead to over-intervention that is not cost effective based upon the crop health and yield.

Method used


Image

  • Agricultural management using biological signals
  • Agricultural management using biological signals
  • Agricultural management using biological signals

Examples


example 1

Water Management

[0211]The inventors partnered with Texas Tech University at the research farm location on Quaker Ave in Lubbock, TX in 2011 on a water regression trial. This trial consisted of twelve cotton varieties, which were grown under nine different irrigation regimes. This water regression trial consisted of a dryland check and eight different daily irrigation amounts, including 0.04, 0.06, 0.09, 0.13, 0.14, 0.16, 0.18, and 0.24 inches. The results showed the predicted percentage of optimum yield through out the season. The results demonstrated that variations in the amount of water can be tracked using the system and method disclosed. See FIG. 12 and FIG. 13.

example 2

[0212]The plant canopy temperature was collected using an infrared temperature sensor that was located in the field with the crop. The temperature was measured and reported every 15 minutes. In Example 1, IRT sensors were placed in each plot that has a unique irrigation schedule. Ambient temperature was captured every 15 minutes by a sensor located at the Base Station. Data from sensors including the IRT, Ambient, Rain Gauge, Soil Moisture Monitoring, Irrigation Flow and Pressure Monitoring, and other data are collected remotely by the Base Station and then sent to the Smartfield Servers for processing.

[0213]The USDA had developed a standard method for identifying Optimal Plant Canopy Temperature (OPCT) for several different types of crops. The inventors used a variant method from the standard OPCT to produce the findings in Example 1

example 3

[0214]The Base Station sent the collected data to the Server via wireless communication. In Example 2, a wireless modem was used to send the data to the server and also receive confirmation that it was successfully received. Once the server received the data it was stored in a database to be used in the Smartfield algorithms and analytics to create information to aide in irrigation management decisions, crop management decisions, or comparing irrigation treatments.


PUM


Abstract

A method and system for customizing agriculture management using biological signals and making decisions according to pre-programmed algorithms, including decisions related to irrigation, prediction of future yield, characterization of plant varieties, and administration of topical applications.

Description

CROSS REFERENCE TO RELATED APPLICATIONS[0001]This application claims the benefit of priority from U.S. provisional patent application Ser. No. 61 / 413,163, filed Nov. 12, 2010, which is incorporated herein by reference in its entirety.BACKGROUND OF THE INVENTION[0002]1. Field of the Invention[0003]The disclosed invention relates to a method and system for assisting a grower in making effective crop management decisions.[0004]2. Description of Related Art[0005]Several crop management techniques have evolved over the years to help growers increase yield, predict the crop maturity date, and predict the value of their crop product. For example, a traditional method of predicting the crop harvest date is the “Days to Maturity” method. For many generations, growers have used this method to predict the time required for their crops to reach maturity. The particular “Days to Maturity” calculation, however, was typically based upon the type of crop that was being grown, but did not take into ...

Claims


Application Information

Patent Timeline
Patent Type & Authority Applications(United States)
IPC IPC(8): G06Q10/00G06Q50/02
CPCG06Q10/0631
Inventor HOHENBERGER, JOELSNEED, DOUGMARTIN, TOMMY J.
Owner SMARTFIELD
Why Eureka
Try Eureka