Computer-Implemented Method For Simulating, In A Three-Dimensional Scene, The Evolution Of Biological Data

a computer and simulation technology, applied in the field of computer programs and systems, can solve the problems of loss of time perspective, difficult to compare experimental data or computed data with other experimental data or computed data in the context of biological interaction networks, and the software in the field of biological interaction networks does not offer the functionalities to easily compare experimental data or computed data with others, so as to achieve the effect of configurable number of displayed levels

Inactive Publication Date: 2014-06-05
DASSAULT SYSTEMES
View PDF2 Cites 2 Cited by
  • Summary
  • Abstract
  • Description
  • Claims
  • Application Information

AI Technical Summary

Benefits of technology

[0025]This is possible by the use a layout in a three-dimensional scene, which provides a new dimension to display a specific type of information to the user (like simulation data).
[0026]This method allows to avoid the use of graphical links (like the links used in Caleydo), and allows to keep track of the biological network structure while visualizing the data. Visualization through graphical shapes is intuitive for the user, and allows to easily navigate through the different behavior, or, in other words, at different period, in the biological interaction network.
[0028]Such a way, the user can easily analyze / study the time evolution of said biological interaction network entities through the evolution of their graphical representations.
[0041]Thus it is easy and instantaneous to compare this additional information to previous displayed information (like interactions between biological interaction network entities or experimental data).
[0047]Thus, it is easy and instantaneous to change the number of displayed levels or the first layouts.

Problems solved by technology

The main problem with the plot approach is that the biological interactions network authoring and visualization, and the visualization and comparison of experimental and simulation data are two separated experiences.
However, the main problem with the coloration approach is the loss of the time perspective.
Moreover the link between a data and its corresponding entity is not an immediate information: links need to be followed, which can become quite awkward in the case of large networks.
Thus, software in the field of biological interaction network do not offer functionalities to easily compared experimental data or computed data with others experimental data or computed data in the context of biological interaction networks.

Method used


Image

  • Computer-Implemented Method For Simulating, In A Three-Dimensional Scene, The Evolution Of Biological Data
  • Computer-Implemented Method For Simulating, In A Three-Dimensional Scene, The Evolution Of Biological Data
  • Computer-Implemented Method For Simulating, In A Three-Dimensional Scene, The Evolution Of Biological Data

Examples


Embodiment Construction

[0057]A description of example embodiments of the invention follows.

[0058]The teachings of all patents, published applications and references cited herein are incorporated by reference in their entirety.

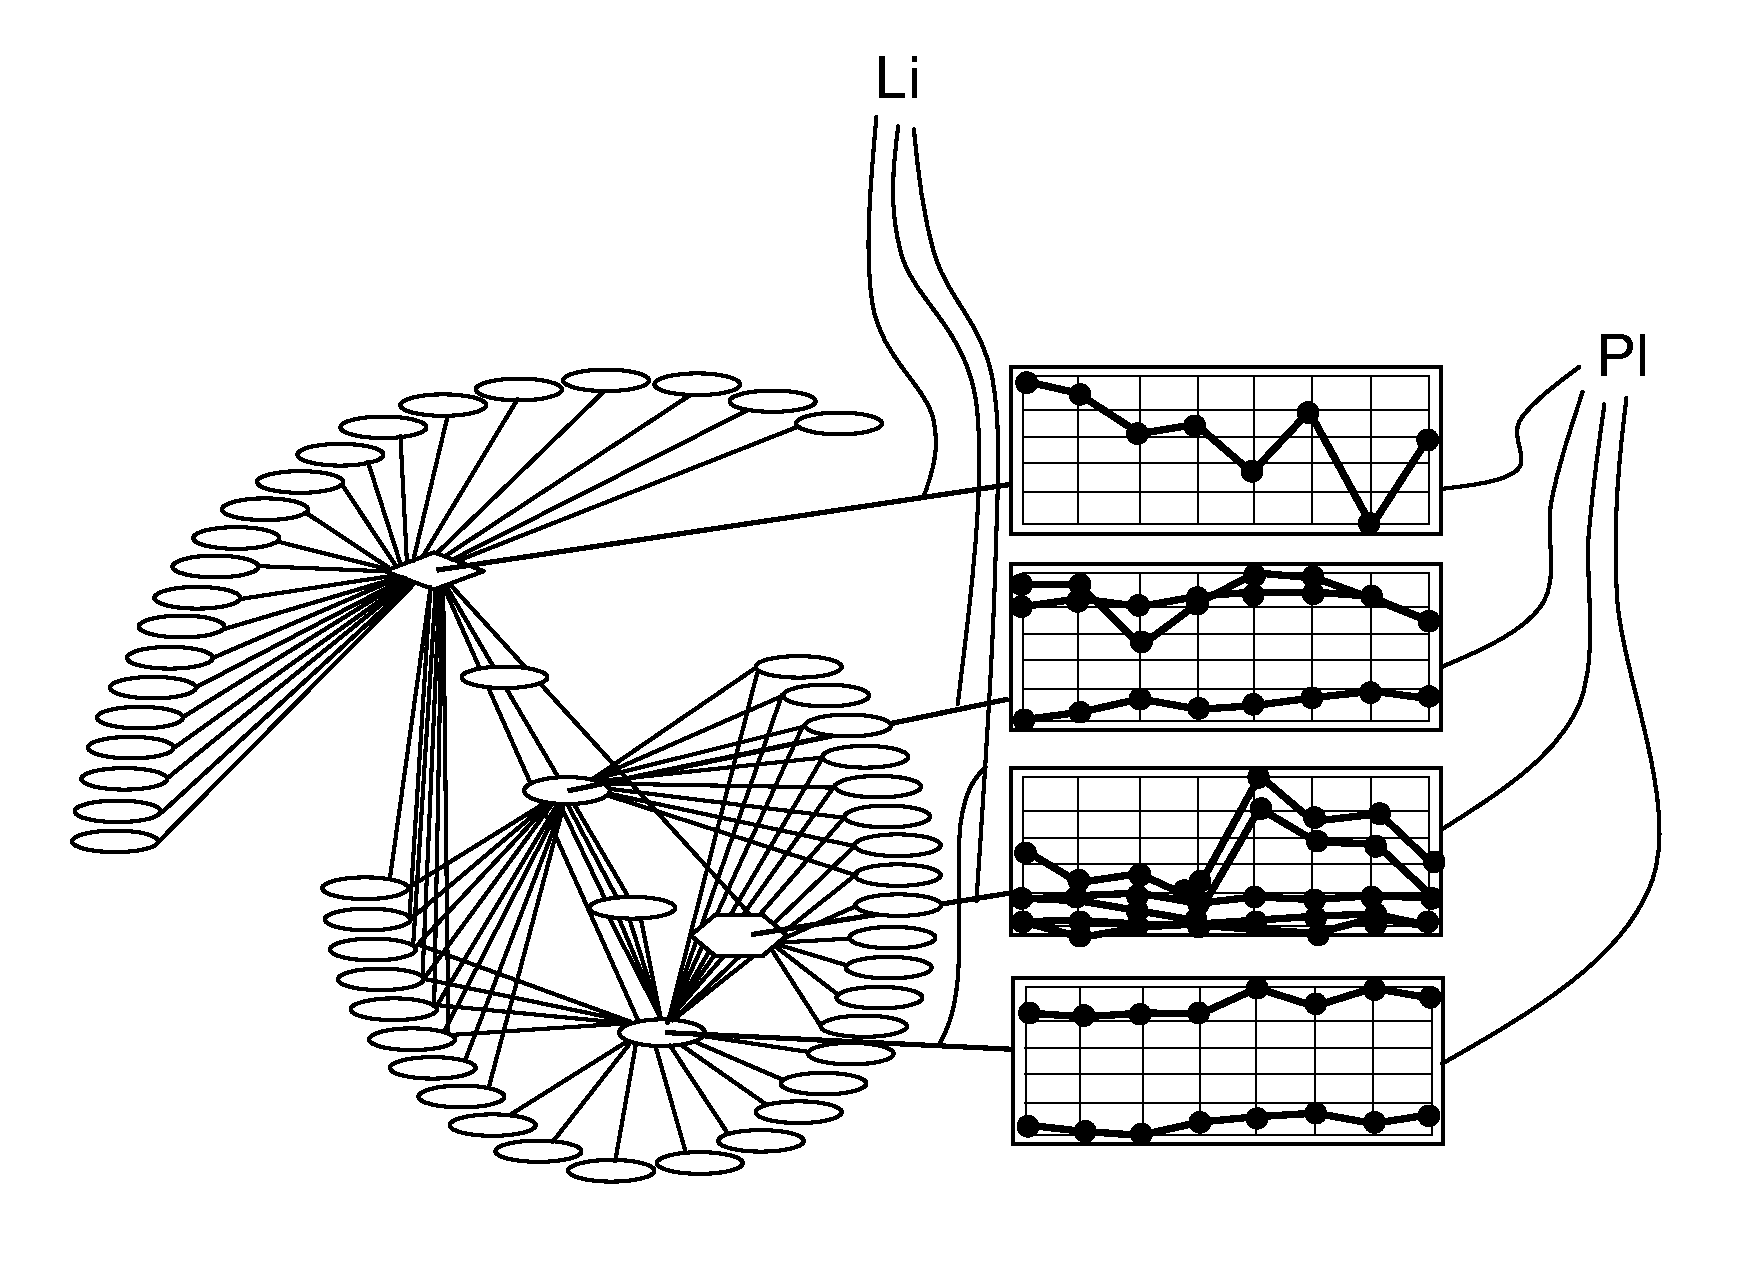
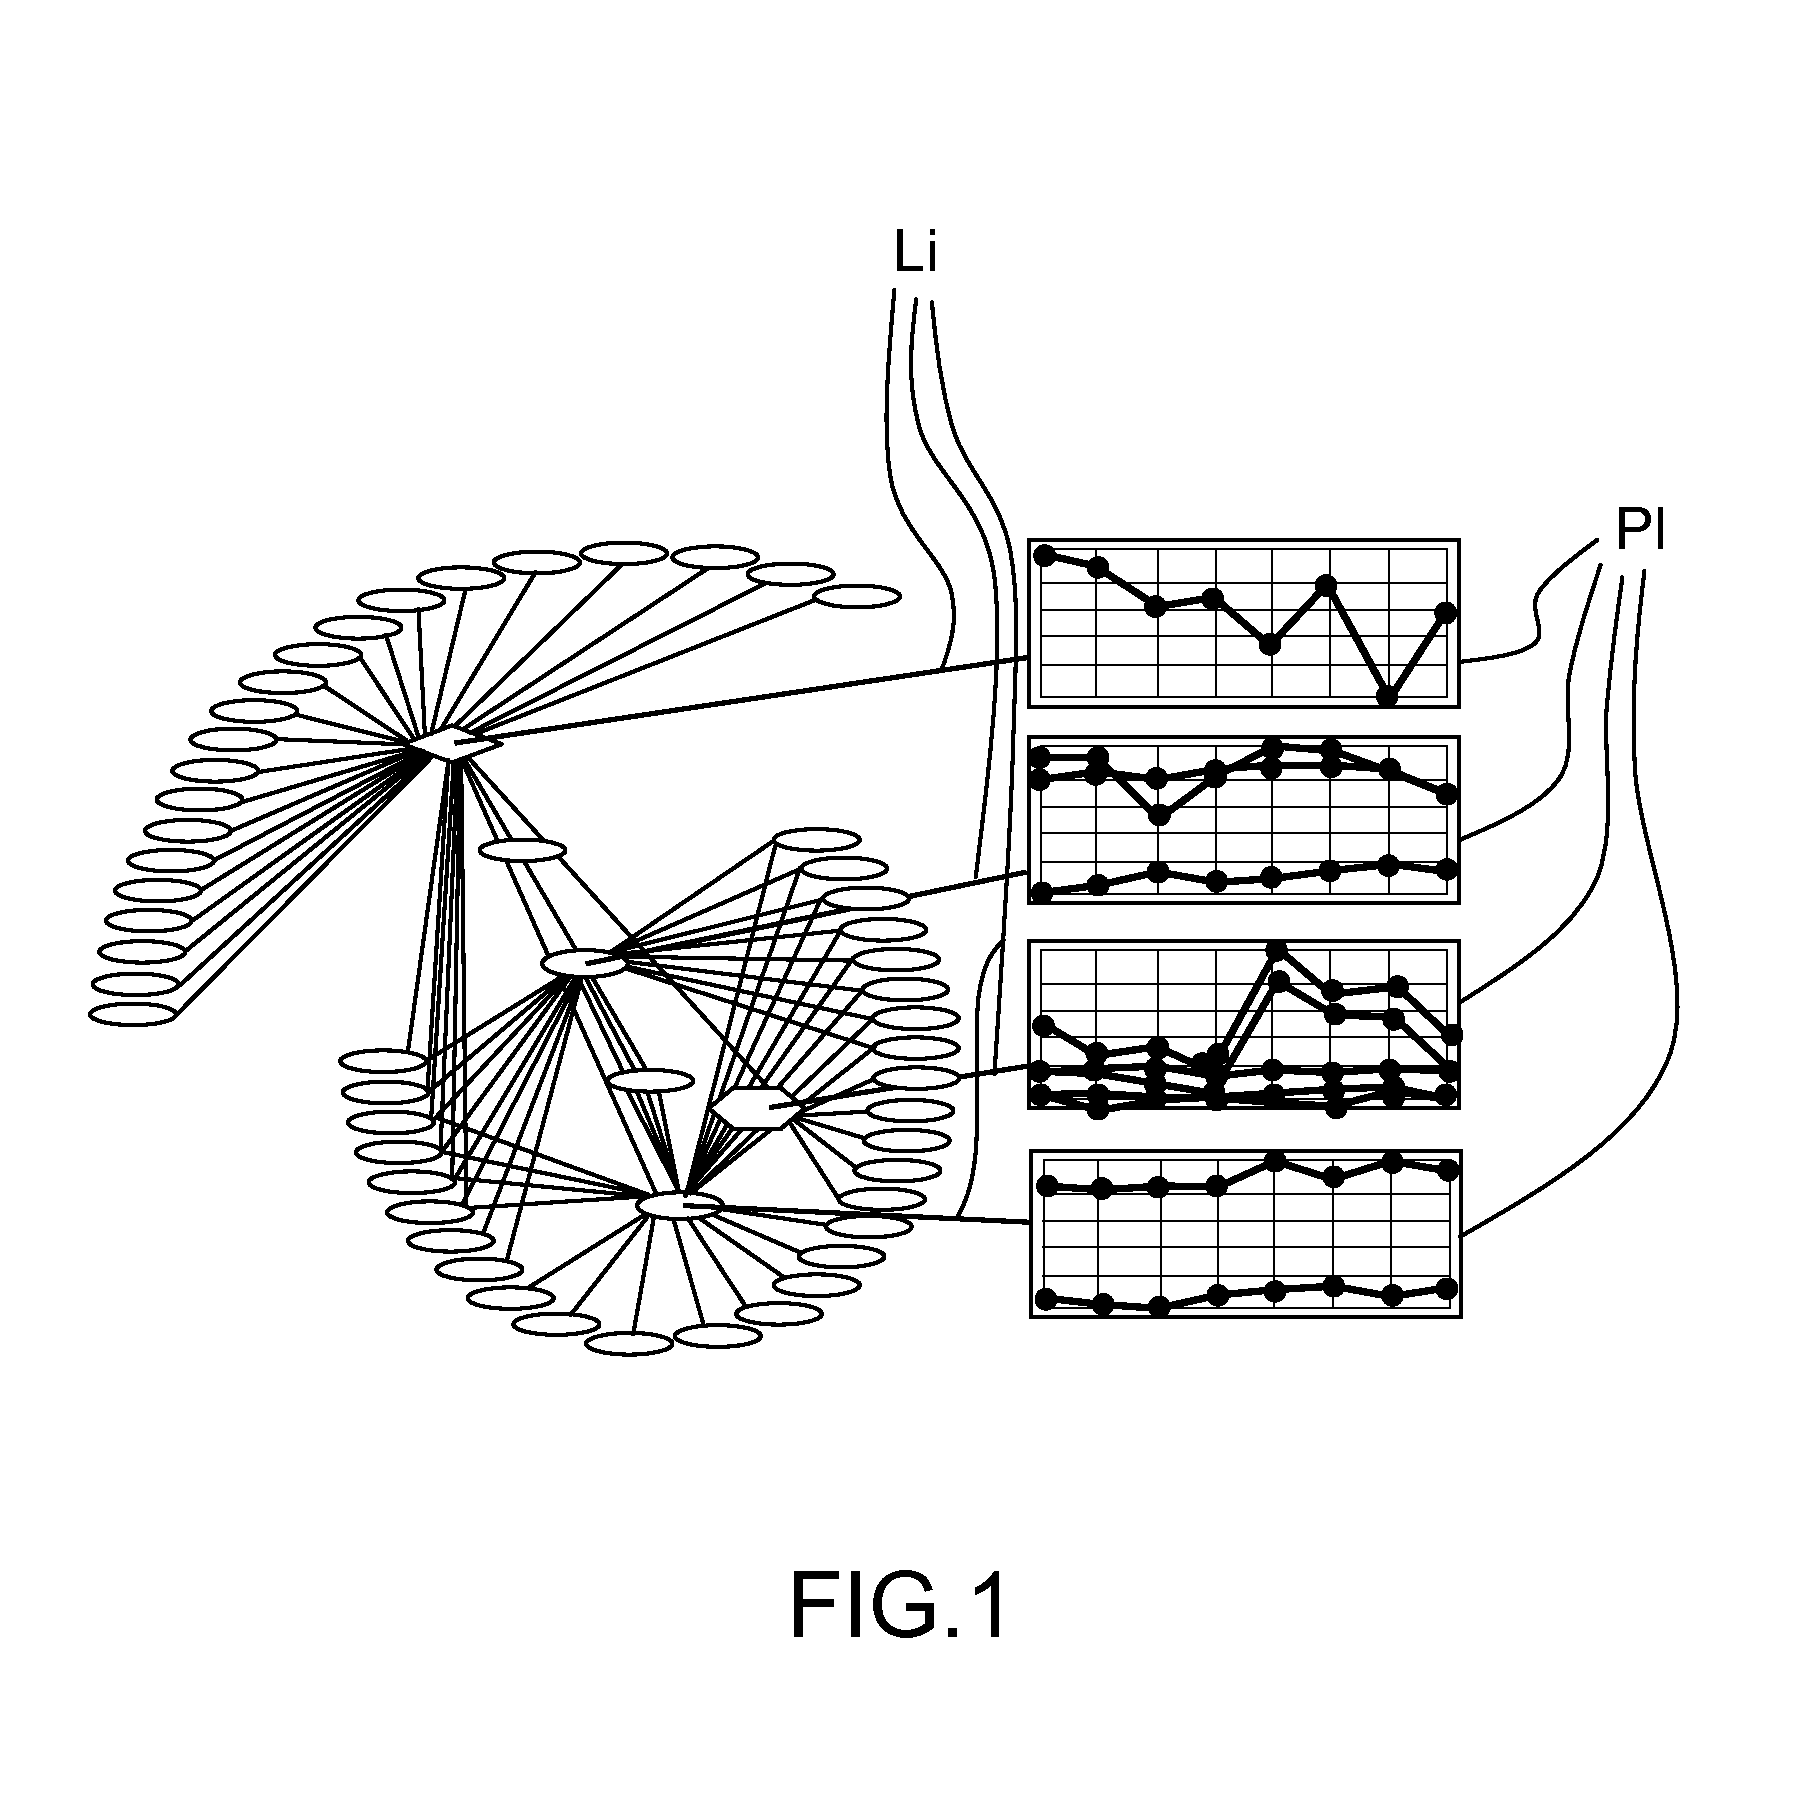
[0059]Following figures explain more in details the functioning of the present invention.

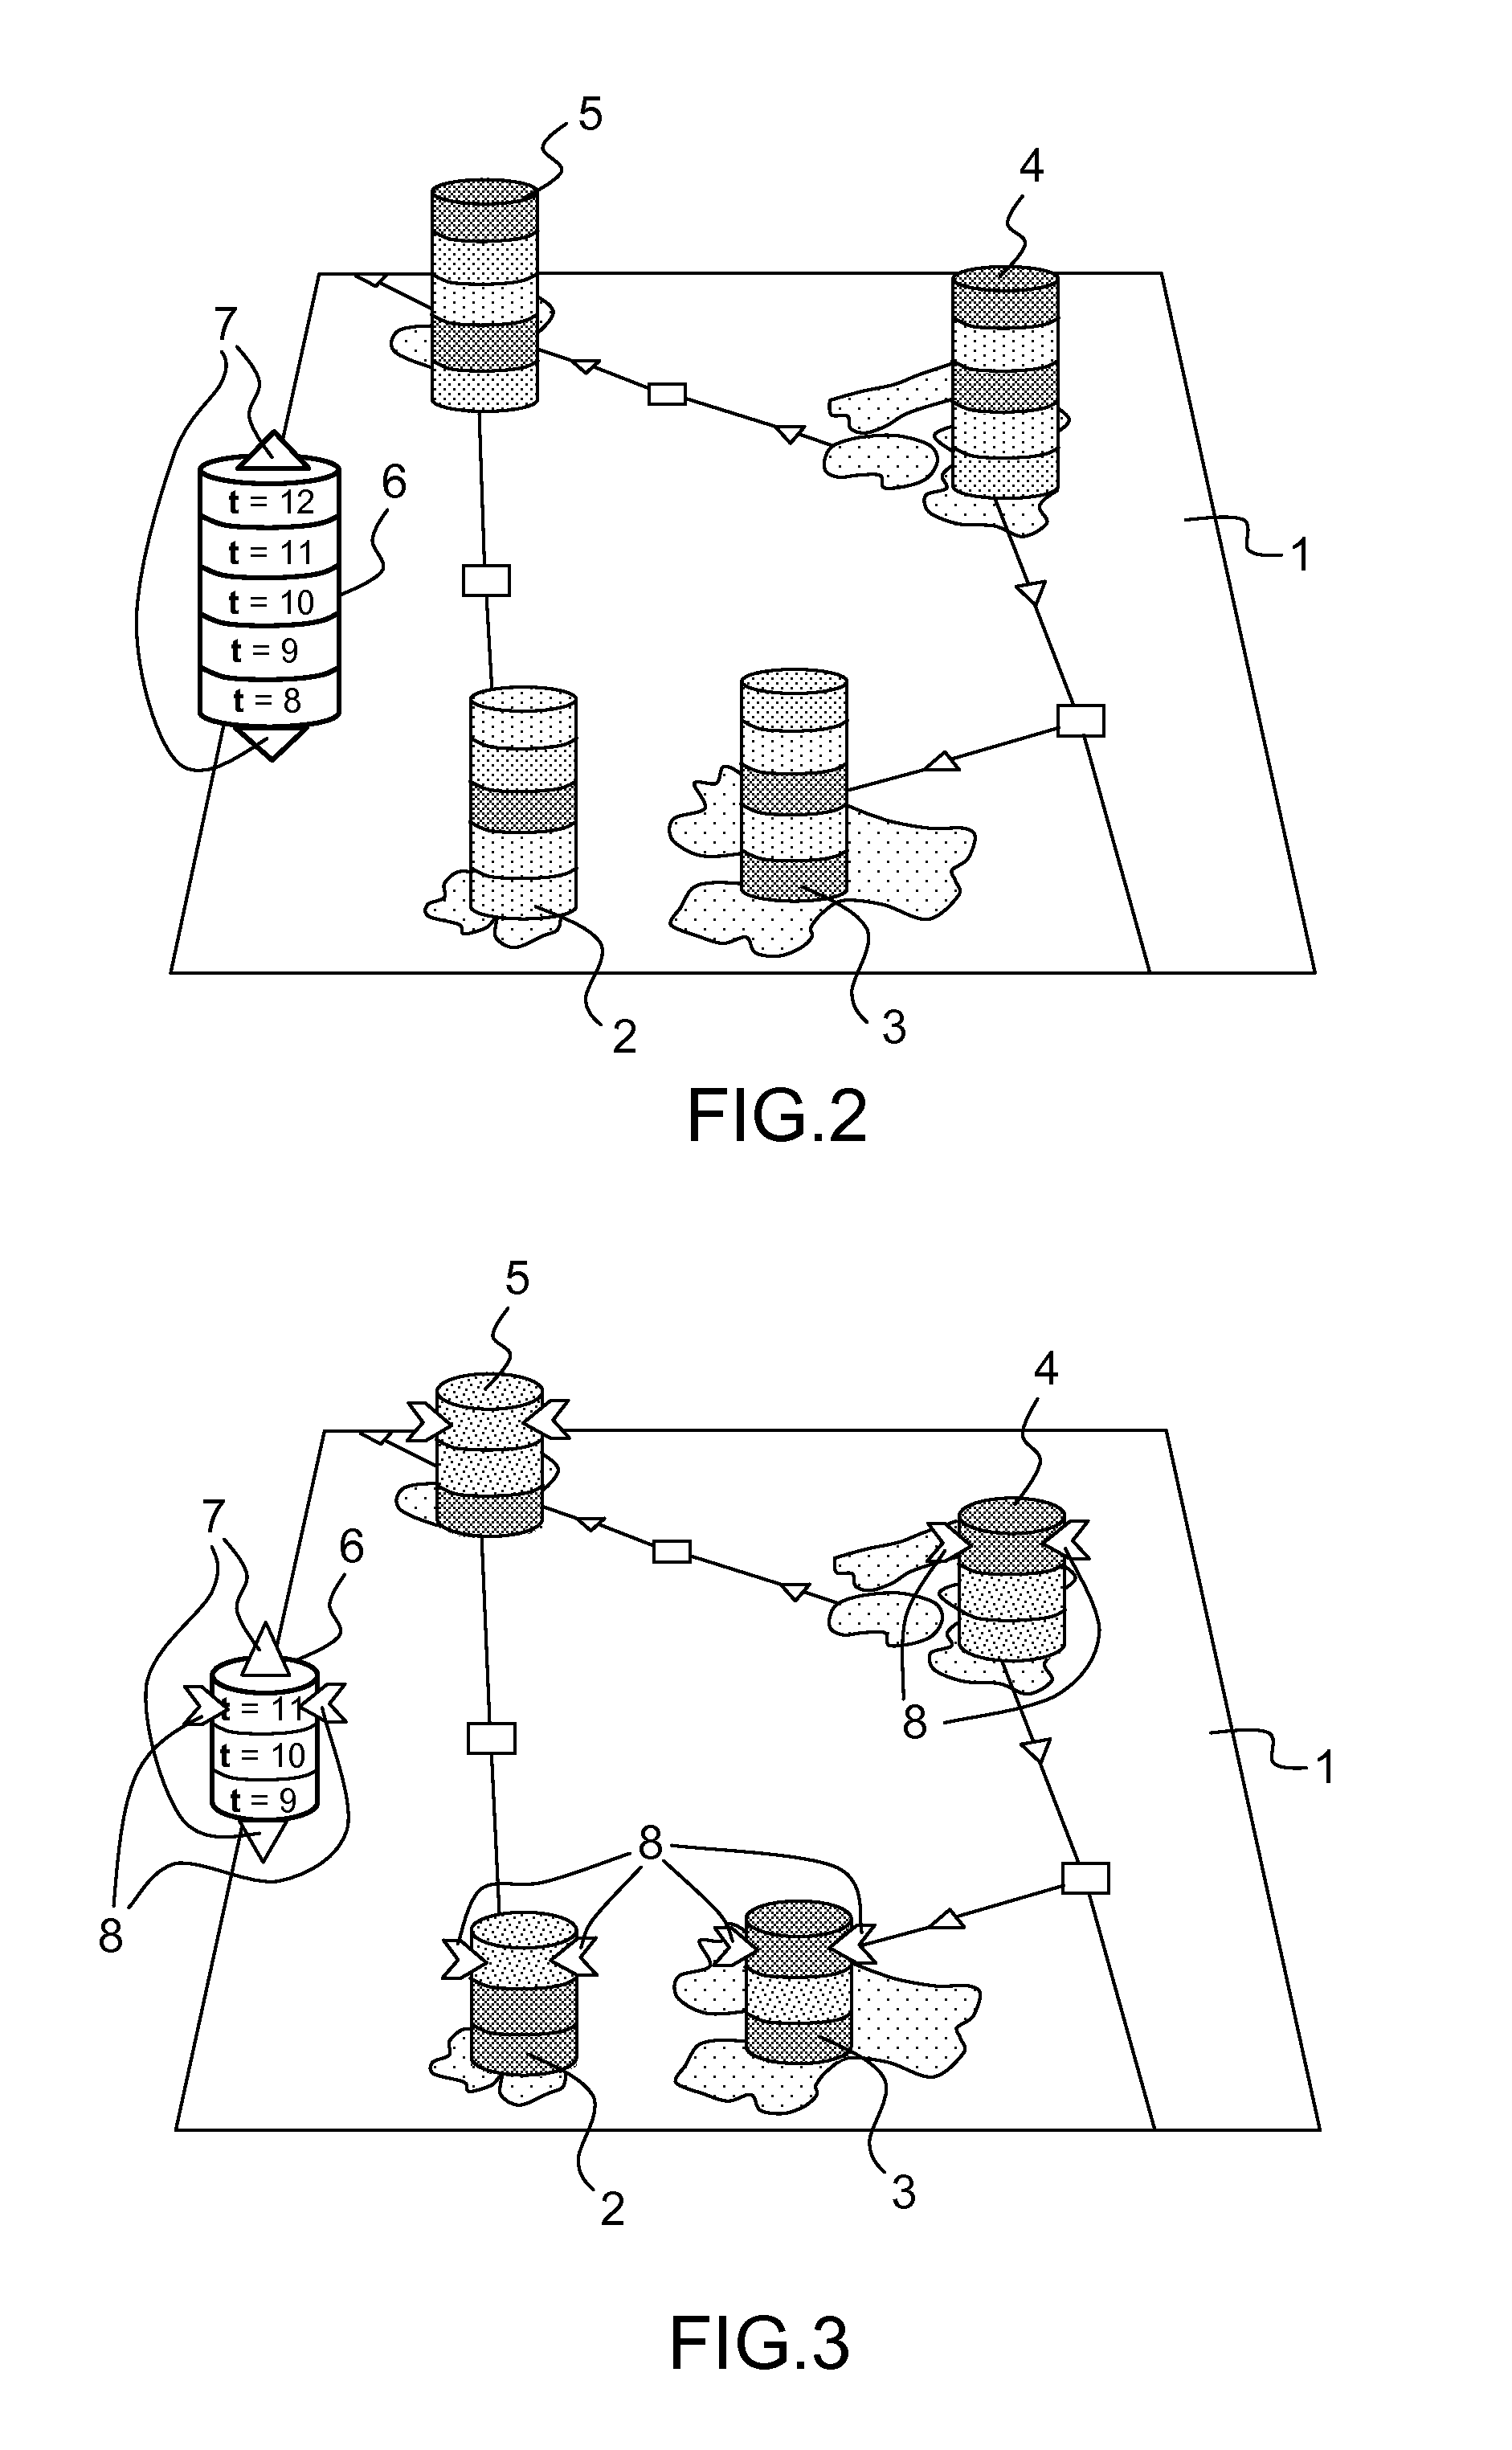
[0060]On FIG. 2, is represented, in a three dimensional scene, a biological interaction network or BIN of biological entities, according to an aspect of the invention.

[0061]The white plane 1 contains a subpart of the biological interaction network (in grey). Four layouts, for example four cylindrical columns 2, 3, 4 and 5 displaying biological data corresponding to each of four corresponding entities. Five levels are represented, corresponding at five successive time instants.

[0062]Here are represented five discrete levels, but, alternatively, the levels can be displayed in a continuous manner.

[0063]On the left side is also represented an adjusting layout 6 comprising means to scroll the displaye...


PUM


Abstract

A computer-implemented method for simulating, in a three-dimensional scene, the evolution of biological data comprising the steps of:displaying an initial biological interaction network (BIN) of biological entities; anddetermining biological data for said interaction network (BIN);characterized in that the method further comprises the step of:displaying, in a three-dimensional scene, a biological data of each entity in a first layout (2, 3, 4, 5), a first layout comprising several levels, a level corresponding to the value of the biological data at a time instant (t).

Description

RELATED APPLICATION(S)[0001]This application claims priority under 35 U.S.C. §119 or 365 to European Application No. 12306505.4, filed Dec. 3, 2012.[0002]The entire teachings of the above application(s) are incorporated herein by reference.TECHNICAL FIELD[0003]The invention relates to the field of computers programs and systems, and more specifically to the field of simulating of the evolution of biological data, that can be generated by simulating a biological interactions network, or can be derived from experiments.BACKGROUND OF THE INVENTION[0004]A biological interactions network or BIN describes some biological phenomenon and can be visualized as a graph, whose nodes represent the biological entities involved in the phenomenon to represent and whose edges represent the biological interactions between the entities.[0005]Biological data can be originated either from experiments performed by biologists or pharmacologists, or from computer simulation.[0006]Two main sorts of data can...

Claims


Application Information

Patent Timeline
Patent Type & Authority Applications(United States)
IPC IPC(8): G06F19/00G16B45/00G16H50/50
CPCG06F19/34G16B5/00G16B45/00G16H50/50
Inventor PRADALIER, SYLVAINKERVIZIC, GWENAEL
Owner DASSAULT SYSTEMES
Why Eureka
Try Eureka