Computer-related method, system, and program product for controlling data visualization in external dimension(s)

a data visualization and external dimension technology, applied in the field of computer graphics display, can solve the problems of ineffective sliding instruments, user blindness to any variation in data over external dimensions, and inability to observe changes in data visualization, so as to achieve the effect of observing changes in data visualization more easily and smoothly

Inactive Publication Date: 2002-11-12
RPX CORP
View PDF62 Cites 139 Cited by
  • Summary
  • Abstract
  • Description
  • Claims
  • Application Information

AI Technical Summary

Benefits of technology

An animation control panel controls an animated display of the data visualization along a navigation path. The animation control panel includes tape-drive-type controls, such as forward, reverse, and stop controls, for controlling data visualization during animation. The animation control panel further includes a path slider and a speed slider. The path slider allows a user to reset the position of the animation along the navigation path. The speed slider allows a user to adjust the speed of the animation along the path.
Any single data visualization or animation can be based on actual data points and/or interpolated data points. Known interpolation techniques can be used to obtain interpolated data points based on the actual data points. In this way, for example, an animation can proceed along a navigation path that includes actual and interpolated data point. This enables a user to observe changes in the data visualization more easily and smoothly.

Problems solved by technology

Such sliders, however, are ineffective navigation instruments.
Using sliders alone

Method used


Image

  • Computer-related method, system, and program product for controlling data visualization in external dimension(s)
  • Computer-related method, system, and program product for controlling data visualization in external dimension(s)
  • Computer-related method, system, and program product for controlling data visualization in external dimension(s)

Examples


Embodiment Construction

TABLE OF CONTENTS

1. Overview of the Invention

2. Terminology

3. Example Environment

4. Scatter Data Visualization Tool Embodiment

5. External Dimension Space

a. One External Dimension

b. Multiple External Dimensions

i. Data Queries

ii. Navigation

iii. Snap-On-Grid Mode

6. Example GUI Computer Environment

7. Example Network Environment

8. Generating a Configuration File

9. Scatter Data Visualization Display Tool Options

10. Filter Panel

11. Map Data Visualization Tool Embodiment

12. Example Map Data Visualizer Tool Implementation

a. Generating a Configuration File

b. Map Data Visualization Display Tool Options

13. Representation of Null Data

14. Conclusion

1. Overview of the Invention

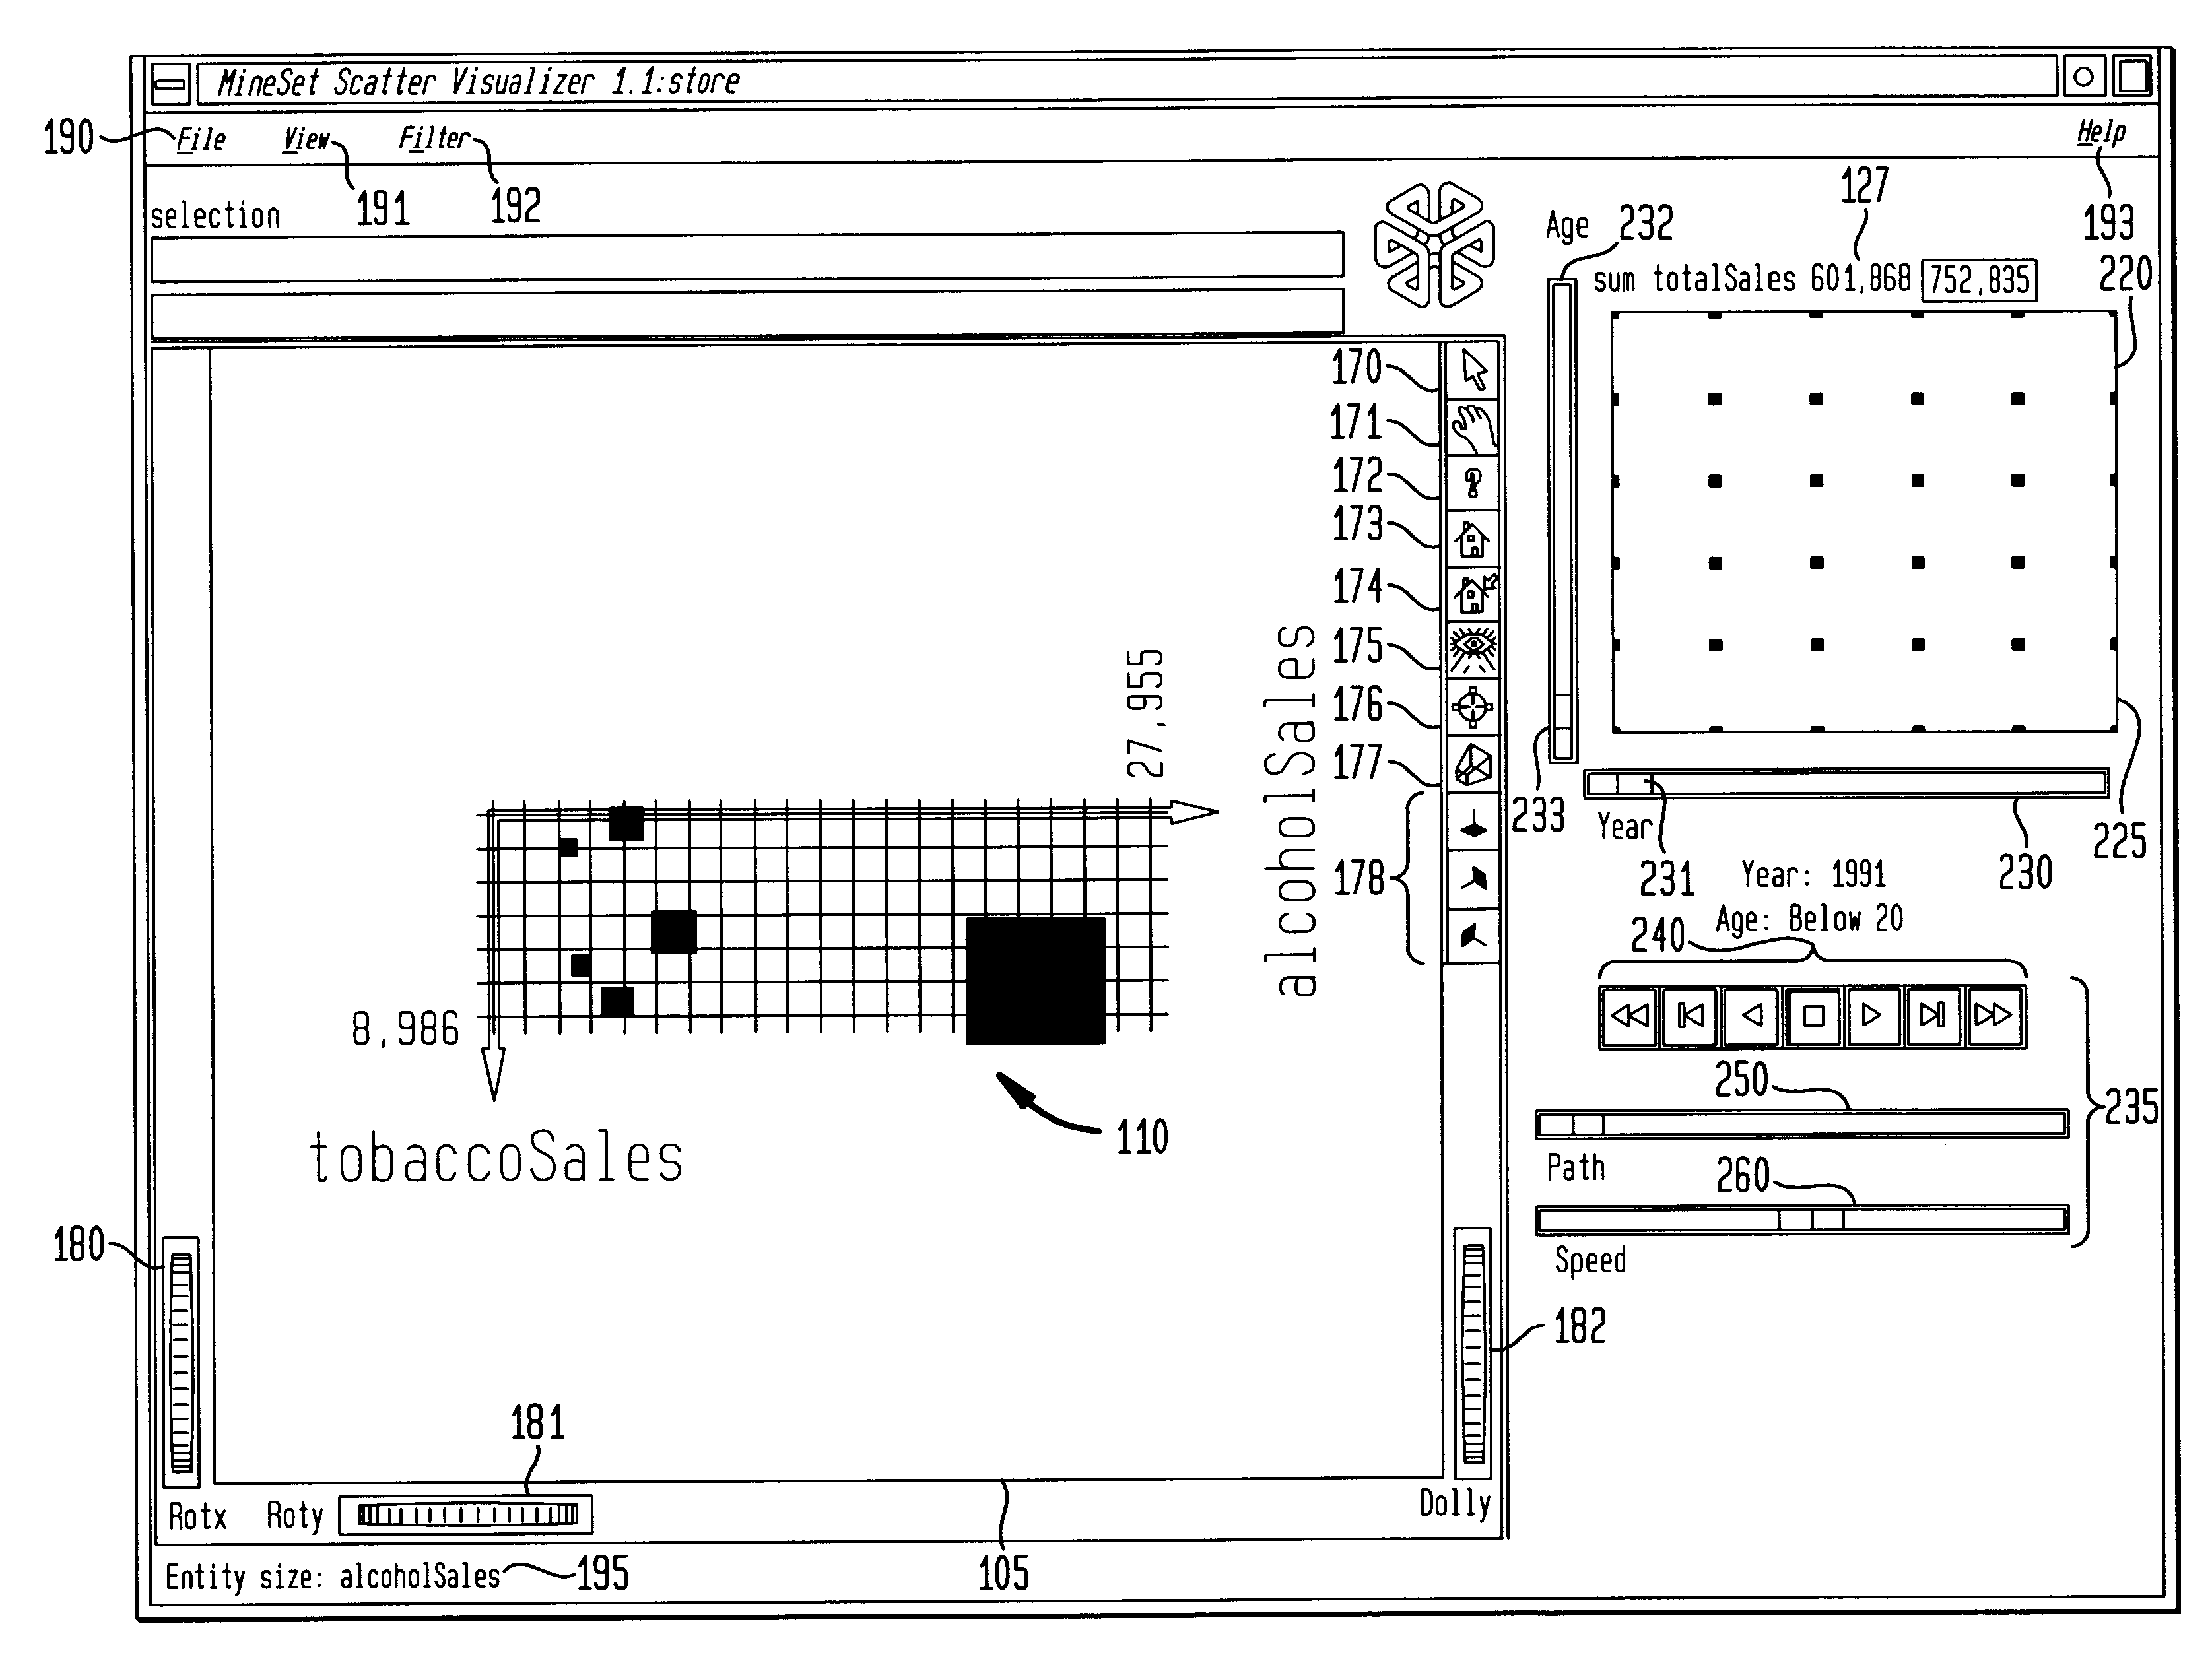
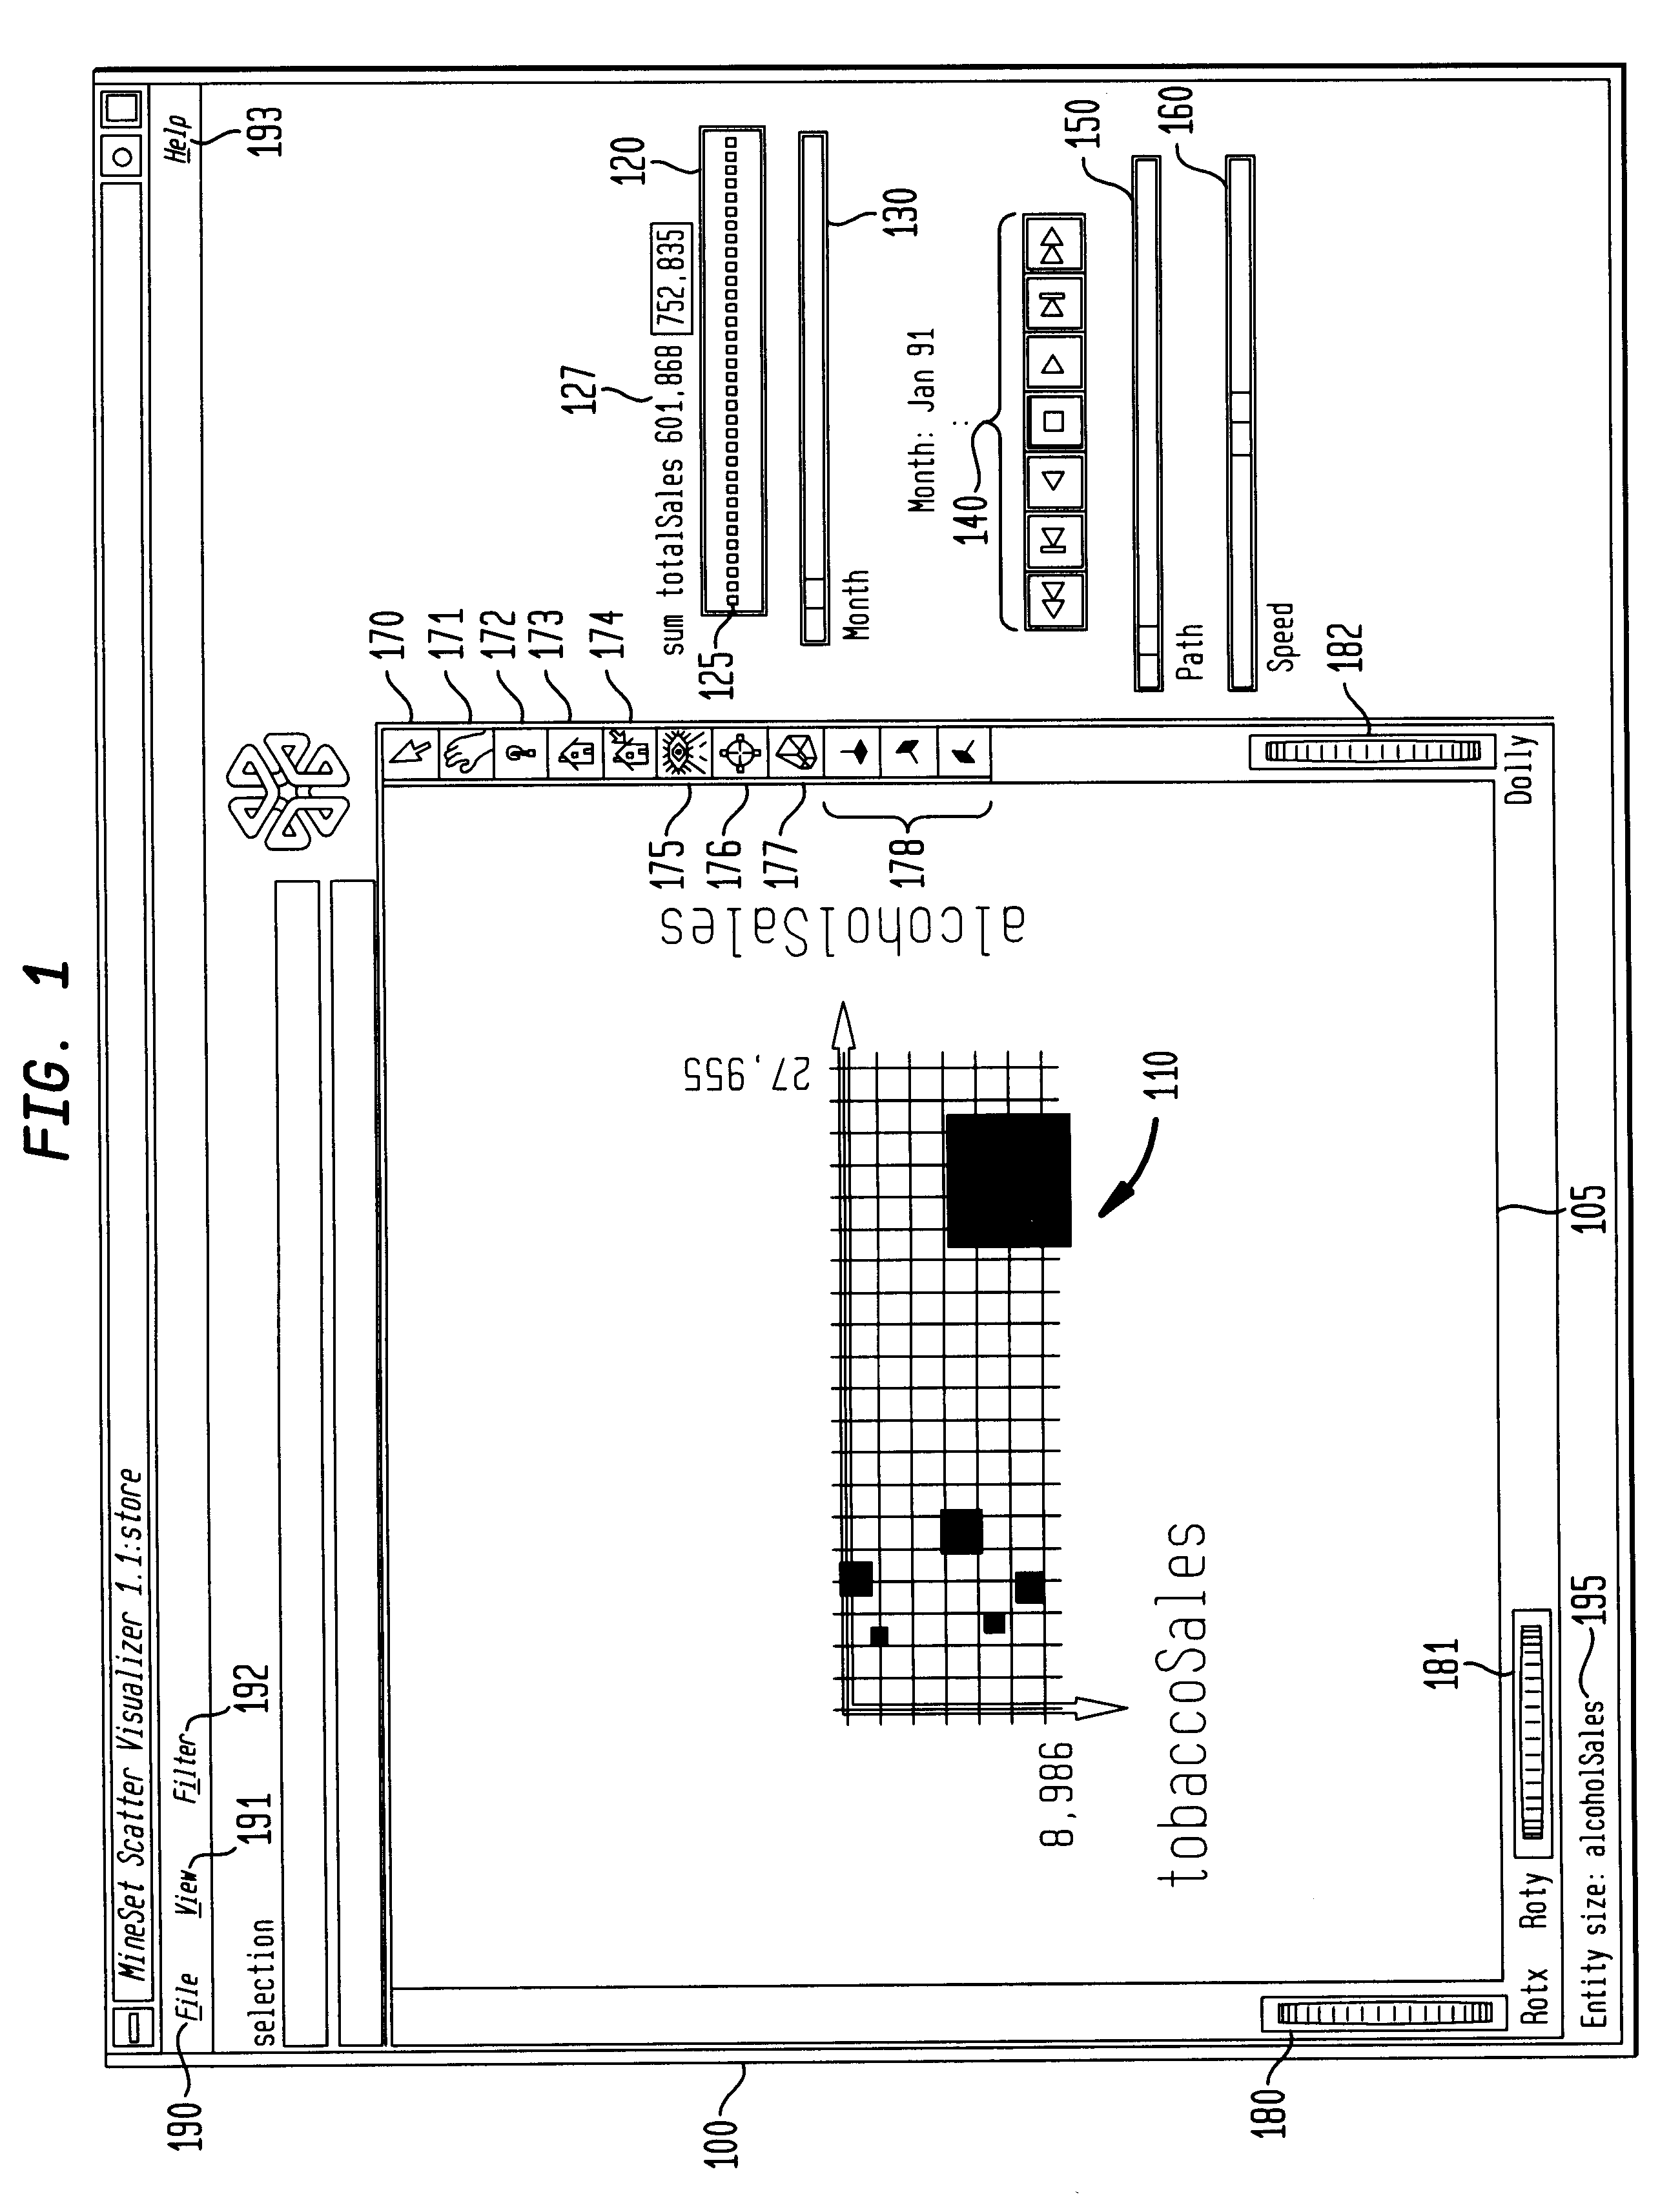
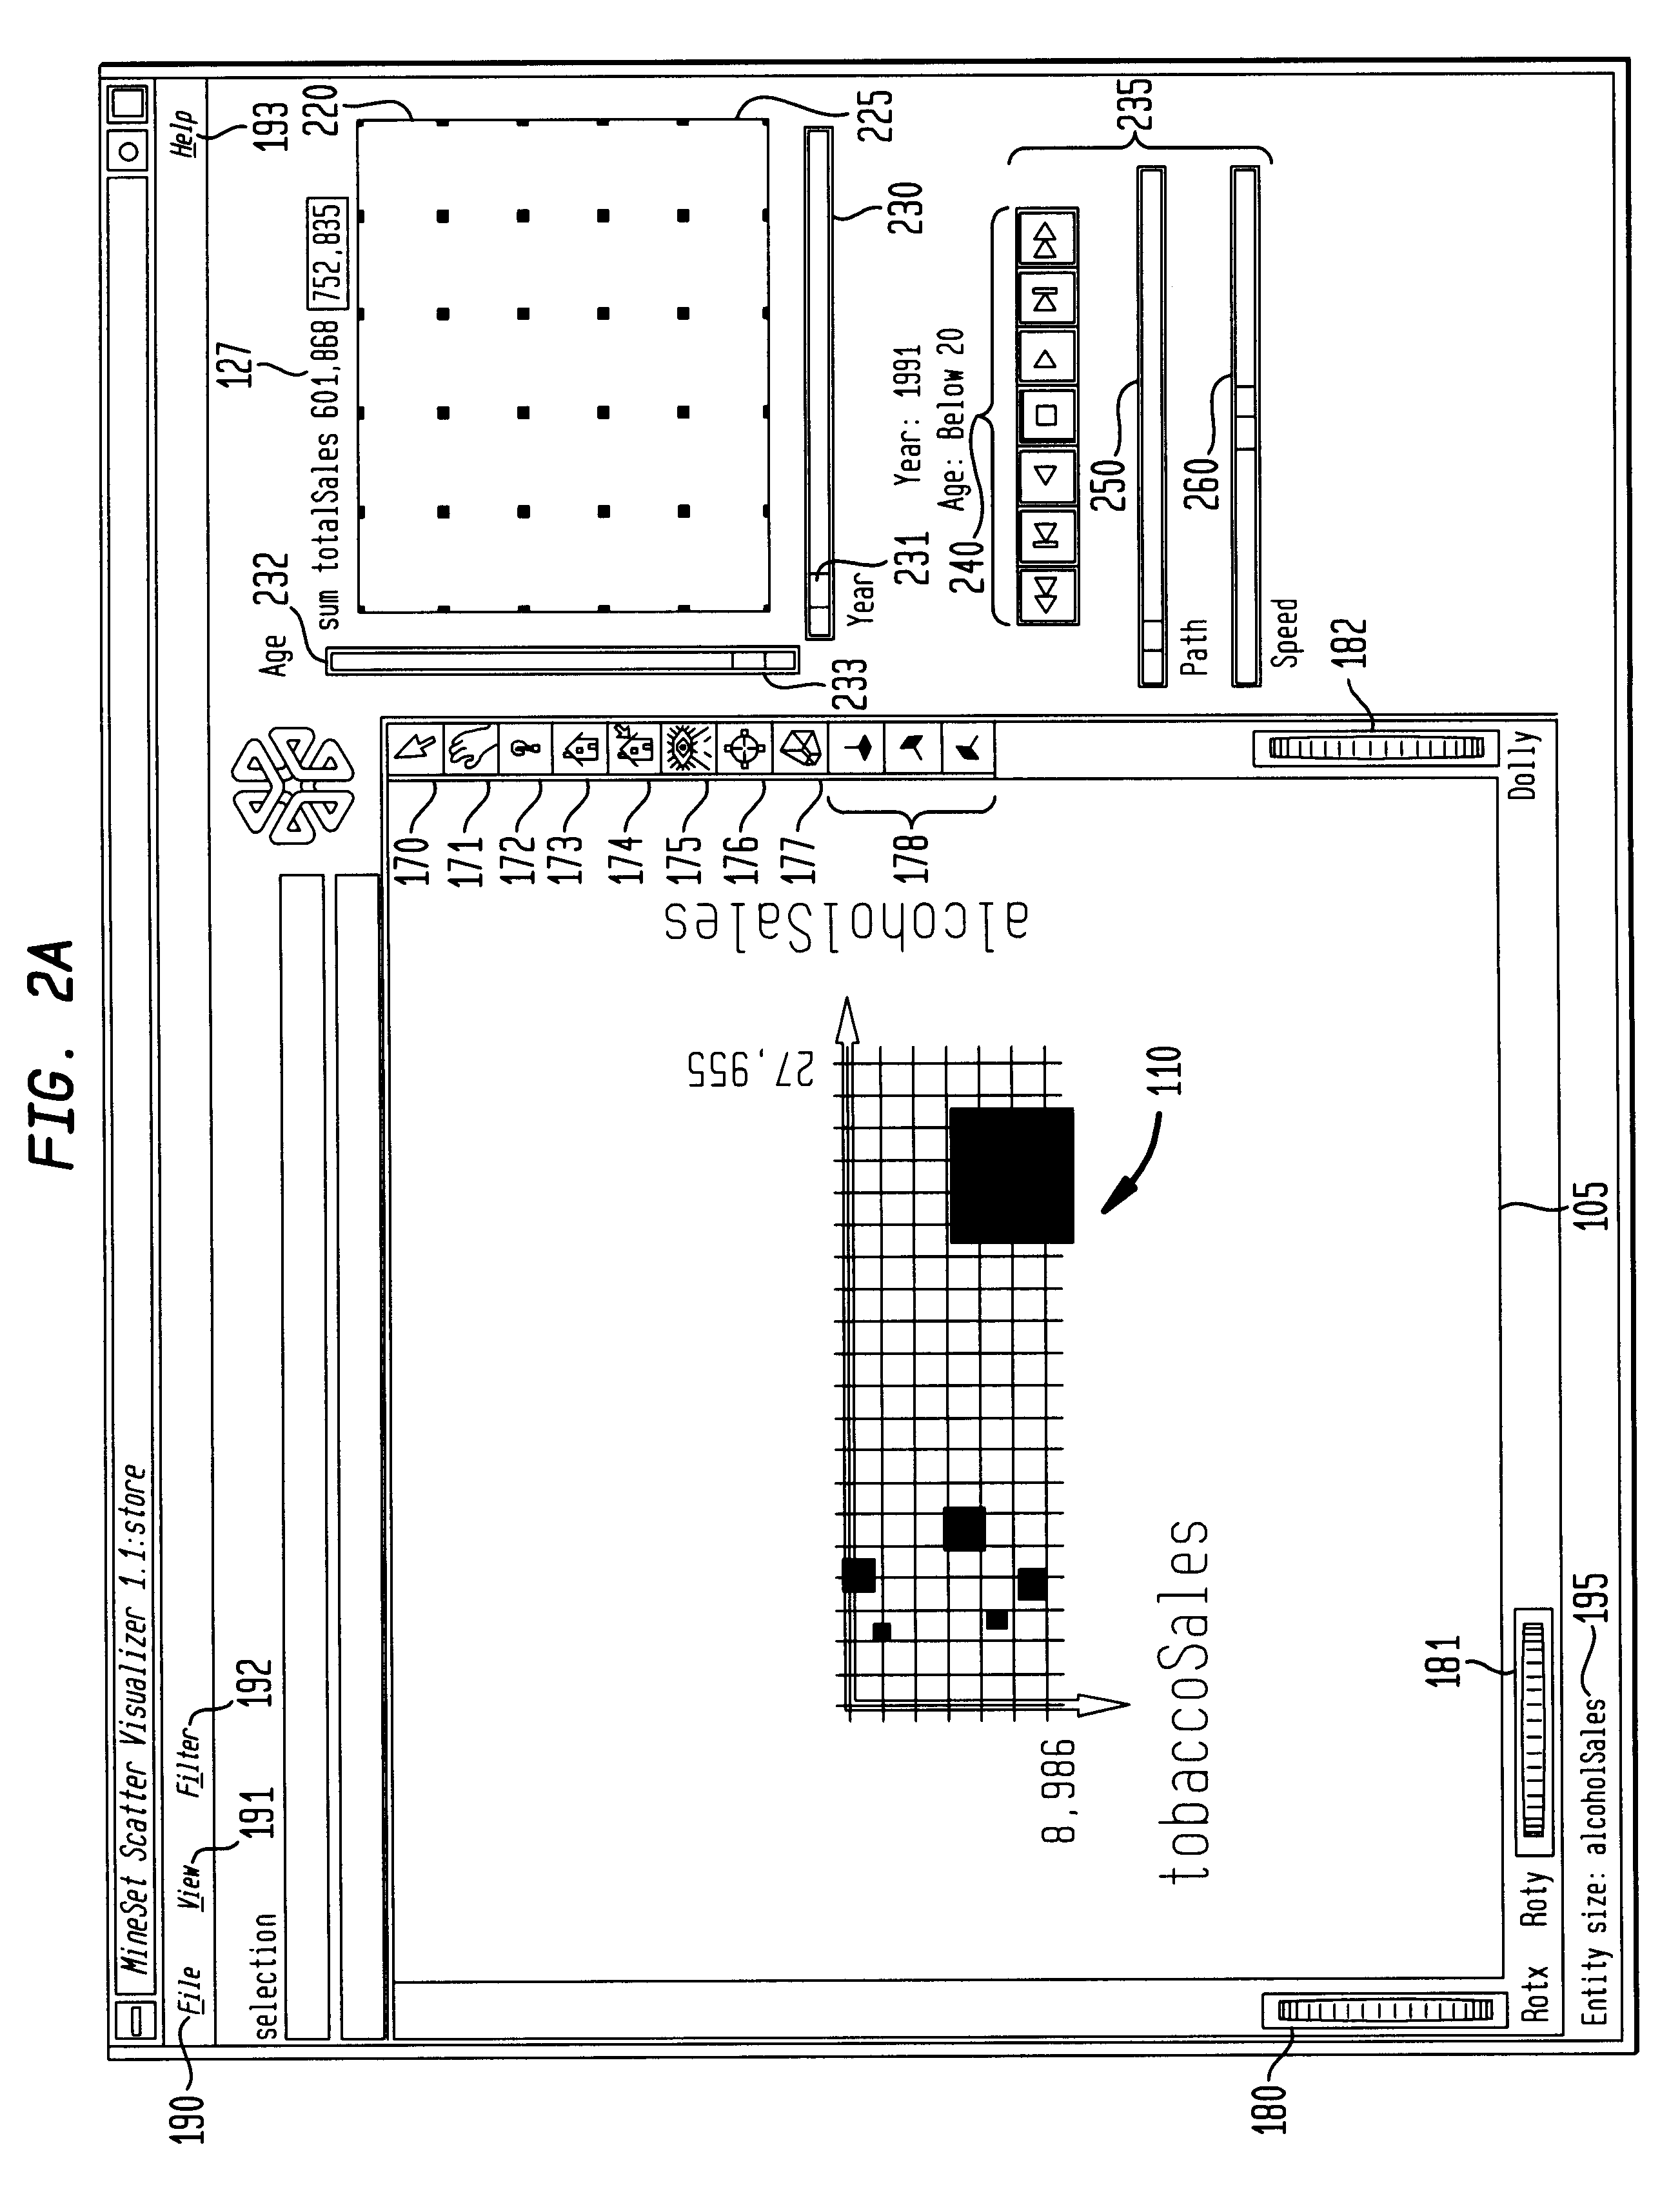
The present invention is directed to a data visualization tool for controlling or varying data visualization in at least one external dimension that allows better querying and navigation of data in external dimension space. Summary information highlighting how data varies with respect to one or more external dimensions is pr...


PUM


Abstract

A computer graphics display method and system for controlling data visualization in at least one external dimension is provided which allows better querying and navigation of data in external dimension space. A data visualization is displayed in a first display window. A summary window provides summary information on data for the data visualization across one or more external dimensions. First and second controllers are displayed for controlling the variation of the data visualization in respective first and second external dimensions. A user queries the data visualization in the first and second external dimensions by selecting a point in the summary window. A user navigates through the data visualization in the first and second external dimensions by defining a path in the summary window. Grid points are also displayed in the summary window to facilitate data queries and navigation based on actual data points. The first and second controllers can be first and second sliders, such as, slide buttons, dials, or any other type of input. An animation control panel, including tape-drive controls, a path control, and a speed control, controls an animation of the data visualization over a selected navigation path through external dimension space.

Description

1. Field of the InventionThe present invention relates generally to computer graphics display, and more specifically to a graphics display tool for controlling data visualization.2. Related ArtComputer graphics display systems have long been used to visualize data. Depending upon the type of data involved, a data visualization is displayed to identify data content, characteristics, properties, relationships, trends, and any other aspect of the data. For example, business and scientific data is often visualized through charts, graphs, histograms, and figures. Virtual reality (VR) data visualizations represent data using display models, such as, information landscapes, hierarchies, cones, walls, and trees.A data visualization, however, represents a snapshot of data that is fixed with respect to external dimension(s) not represented in the data visualization itself. For example, consider a company's annual sales data reported in a simple bar chart. A bar can be provided for each retail...

Claims


Application Information

Patent Timeline
IPC IPC(8): G06F3/033G06F17/30G06F3/048
CPCG06F3/0481G06F3/04845G06F17/30973G06F2203/04806G06F16/90328
Inventor SANG'UDI, GERALD P.BOTT, ROSS A.TESLER, JOEL D.HAWKES, JOHN R.XIONG, REBECCA W.SCHKOLNICK, MARIO
Owner RPX CORP
Why Eureka
Try Eureka