System and method for comparing pharmaceutical prices and medication utilization

a technology of drug utilization and price comparison, applied in the field of pharmaceutical item pricing and utilization patterns, can solve the problems of purchasers at a competitive disadvantage, lack of transparency, and ongoing challenges of healthcare providers and administrators in shrinking reimbursement, and achieve the effect of rapid identification and measurement of the impact of programmatic changes in drug utilization and pricing

Inactive Publication Date: 2014-12-04
AMERICAN PHARMACOTHERAPY
View PDF5 Cites 26 Cited by
  • Summary
  • Abstract
  • Description
  • Claims
  • Application Information

AI Technical Summary

Benefits of technology

[0037]The invention includes a method for tracking and trending changes in drug utilization over time. The frequency of reporting enables the user to rapidly identify potential changes in utilization and target specific drugs or therapies for future trending. The longitudinal tracking can be used for routine monitoring of utilization and / or to measure the impact of programmatic changes in drug utilization and pricing.
[0038]The invention provides the ability of users to identify utilization trends for new drugs or therapies as they enter the market.

Problems solved by technology

Rising costs and shrinking reimbursement is an ongoing challenge for healthcare providers and administrators.
Pharmaceutical costs represent approximately 10% of healthcare costs and are frequently a source of scrutiny from consumers, healthcare administrators and government agencies.
This lack of transparency places purchasers at a competitive disadvantage when purchasing or negotiating contracts for pharmaceuticals.
All of the price metrics named above have significant flaws in that they are an artificially established value from the suppliers; there is a significant delay between the date when the price was available and the published price and / or the impact of rebates is not included in the prices.
Therefore, none of the available metrics are able to accurately calculate the net cost of a pharmaceutical product to a health care organization.
Because of these flaws, none of the available price metrics provides a timely and accurate source of pharmaceutical pricing data.
The end result of these flaws is that it is not possible for hospitals or other health care providers to know the range of market competitive prices and thus they are unable to effectively negotiate with suppliers for lower prices.
According to the Robinson-Patman Price Discrimination Act, it is illegal for a vendor to charge similarly situated, competing buyers different prices for like commodities where the price difference may negatively affect competition.
Determining and communicating classes of trade is a common source of errors in when determining prices of pharmaceutical products.
These discounts are not readily available to non-DSH facilities and thus should not be used for price comparisons between DSH and non-DSH facilities.
Pricing errors for pharmaceuticals contribute to added costs and work for pharmacies and other health care providers.
However, all stakeholders in the pharmaceutical supply chain incur expense associated with the actual error but also workload costs associated with identifying and correcting pricing errors.
However, a hospital with annual purchases of $20M could have $150,000 in billing errors each year.
While some of these products are assigned NDC numbers by the supplier, other products either do not have an NDC or the NDC is not available in standard pharmaceutical compendia.
The lack of readily available NDC data for products purchased outside the pharmaceutical wholesaler supply chain make price comparisons for end users very challenging if not impossible.
Unfortunately, there are inherent conflicts of interest for each of these groups because their revenues are directly proportional to pharmaceutical purchases.
There are currently no products or services that provide unbiased price comparisons that reflect actual costs paid by purchasers in a timely manner.
Because of this delay, the impact of these rebates is not reflected in pricing data provided by the wholesalers or other suppliers.
Therefore, the price data provided by these sources does not represent accurate net price data leaving purchasing staff with incomplete information.
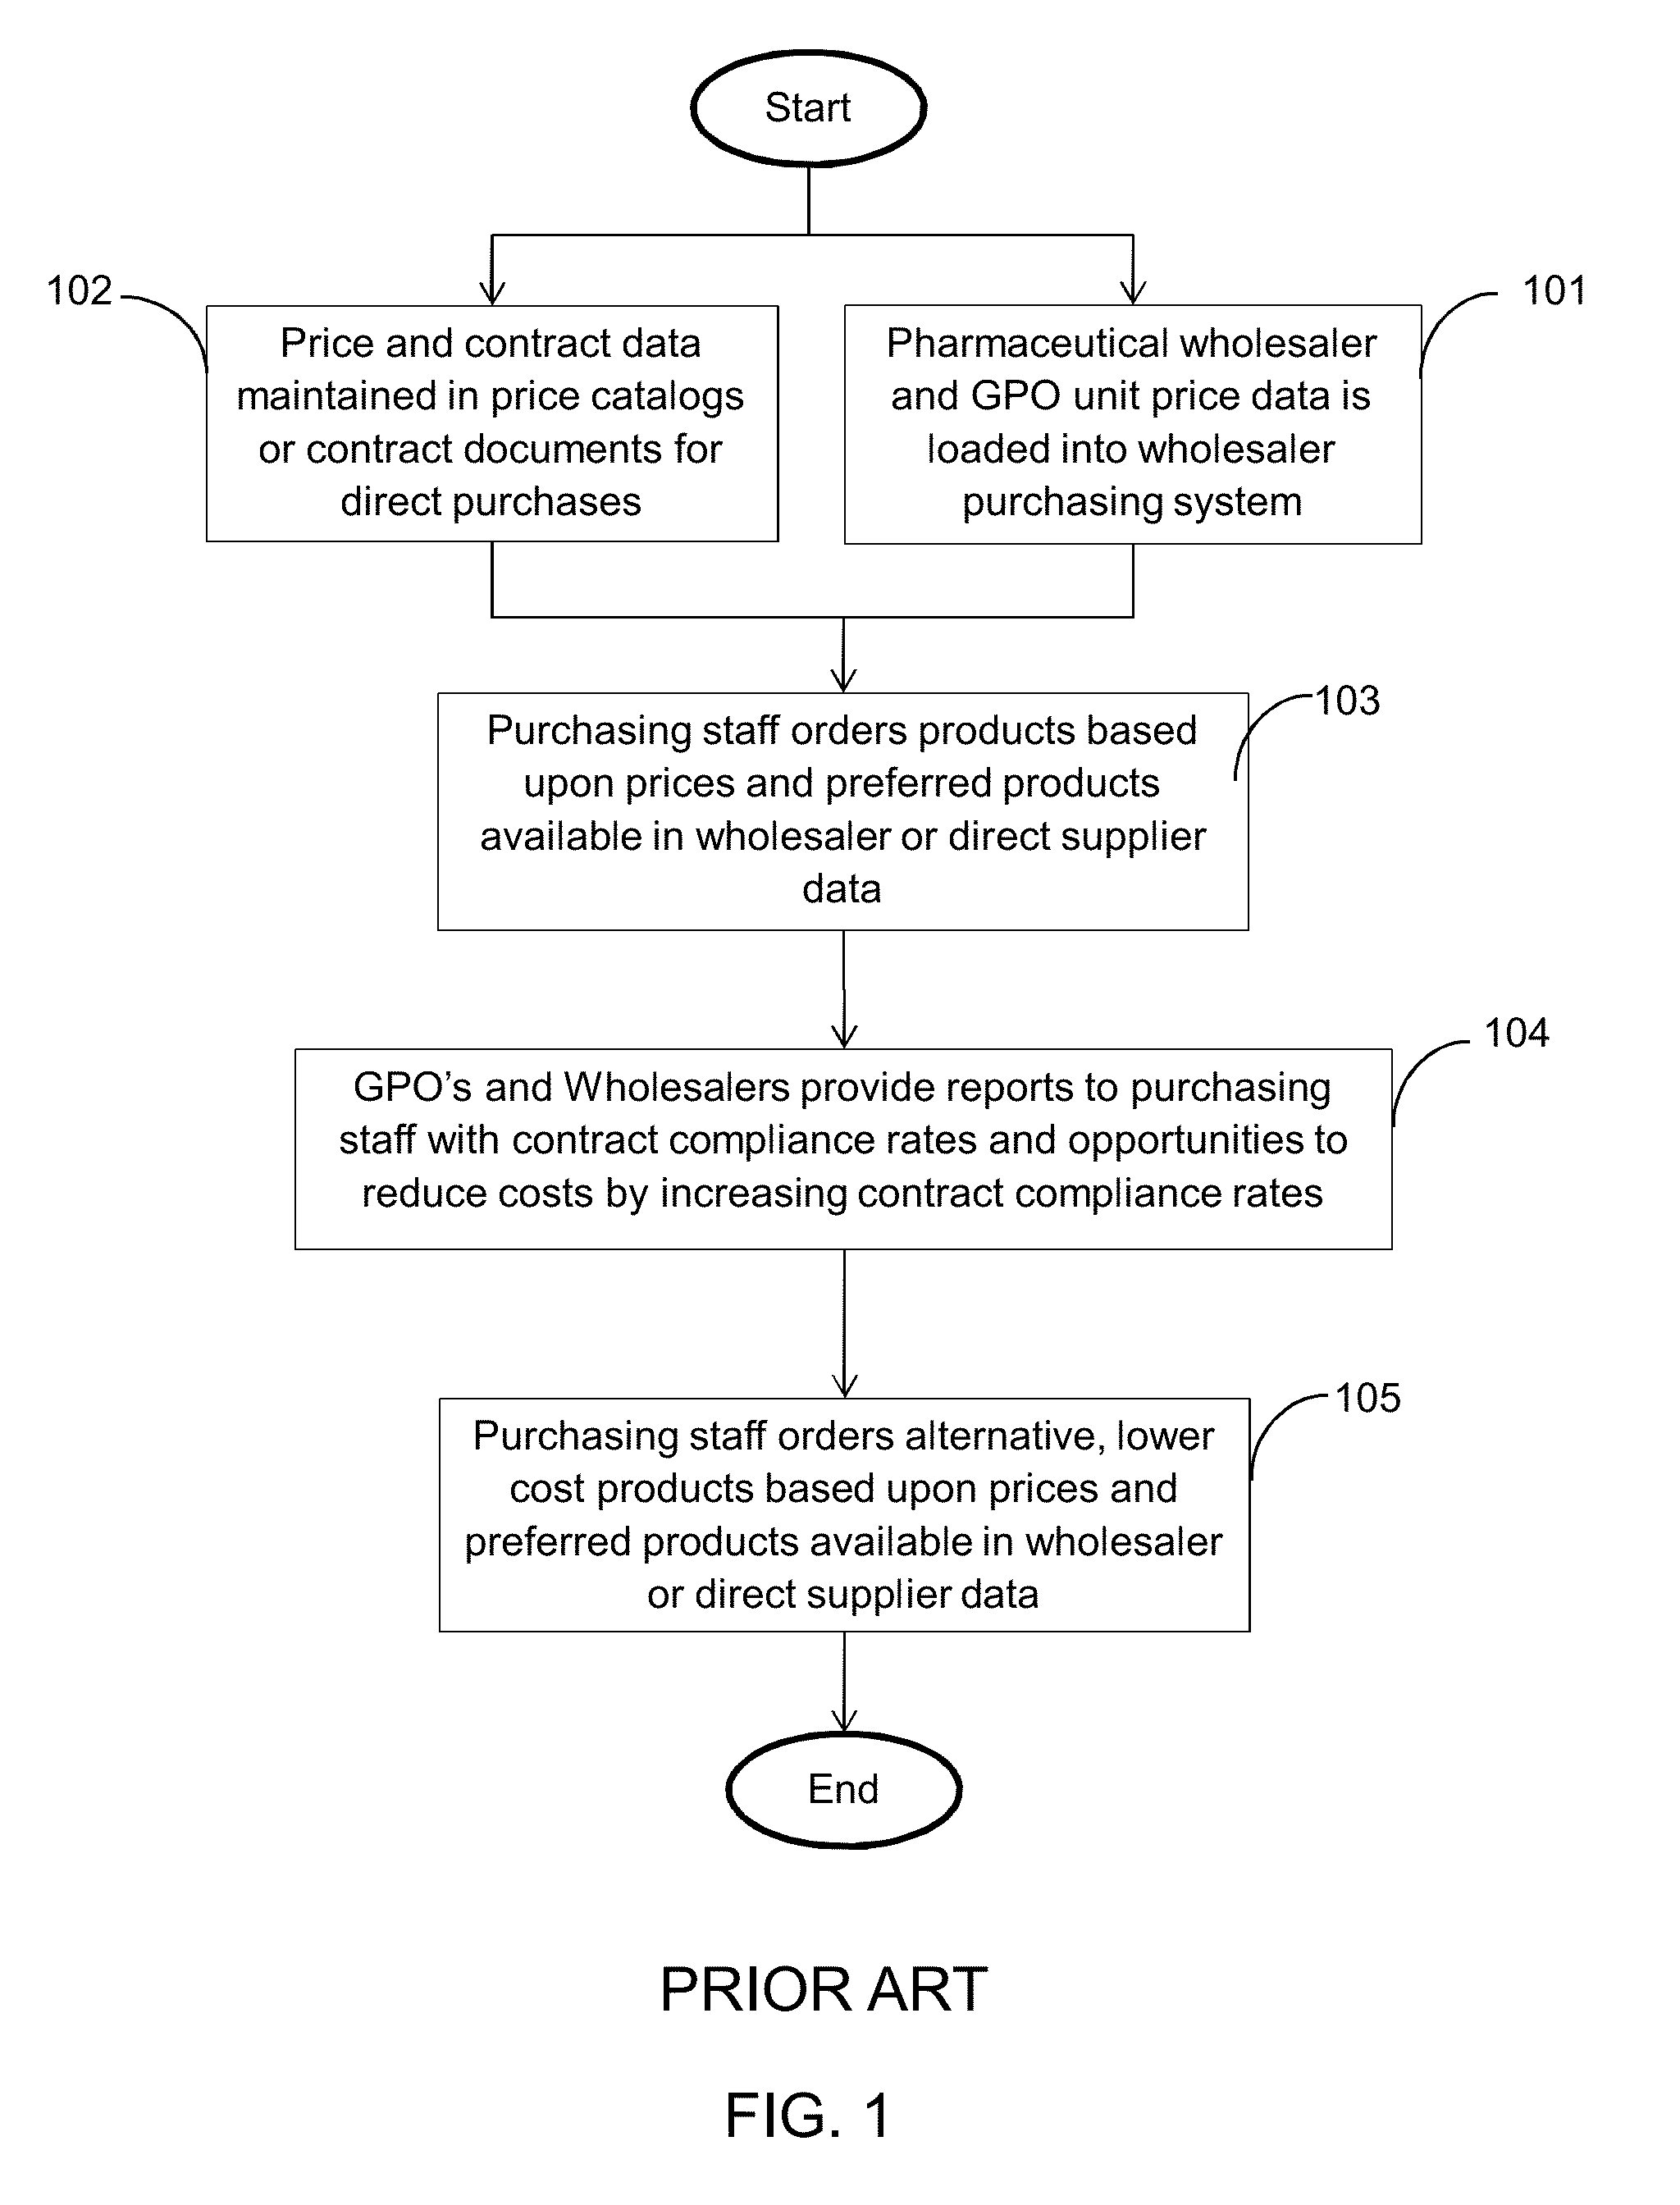
Another problem with the current process is that pharmacy purchasing staff is often unaware whether they are on-track to achieve market share tiers and discounts and thus may not take full advantage of the available discounts.
Representatives from some suppliers occasionally may inform purchasing staff of their purchase history relative to market share tiers but this process is not consistent among suppliers or representatives.
There is no standard approach to measuring and / or comparing utilization of pharmaceuticals.
A flaw with this approach is that charging formulas among hospitals vary significantly.
While this may provide some guidance regarding drug utilization, the data is generally difficult to extract and there are significant delays in its availability relative to the event.
This lack of timeliness limits the usefulness in making meaningful changes.
In addition, measuring utilization data does not account for drug product waste, expiration, or other factors that result in product loss.
In summary, flaws with existing programs that estimate drug utilization include: the fact that inpatient and outpatient purchases are often merged in the same data file; the volume adjustments do not include account for patient acuity or volume of some procedures that significantly increase the utilization of specific pharmaceuticals (e.g. Percutaneous Coronary Interventions (“PCI”)); and the fact that the calculation of Adjusted Patient Days does not accurately reflect the inpatient / outpatient ratio of most products purchased by hospitals.

Method used


Image

  • System and method for comparing pharmaceutical prices and medication utilization
  • System and method for comparing pharmaceutical prices and medication utilization
  • System and method for comparing pharmaceutical prices and medication utilization

Examples


Embodiment Construction

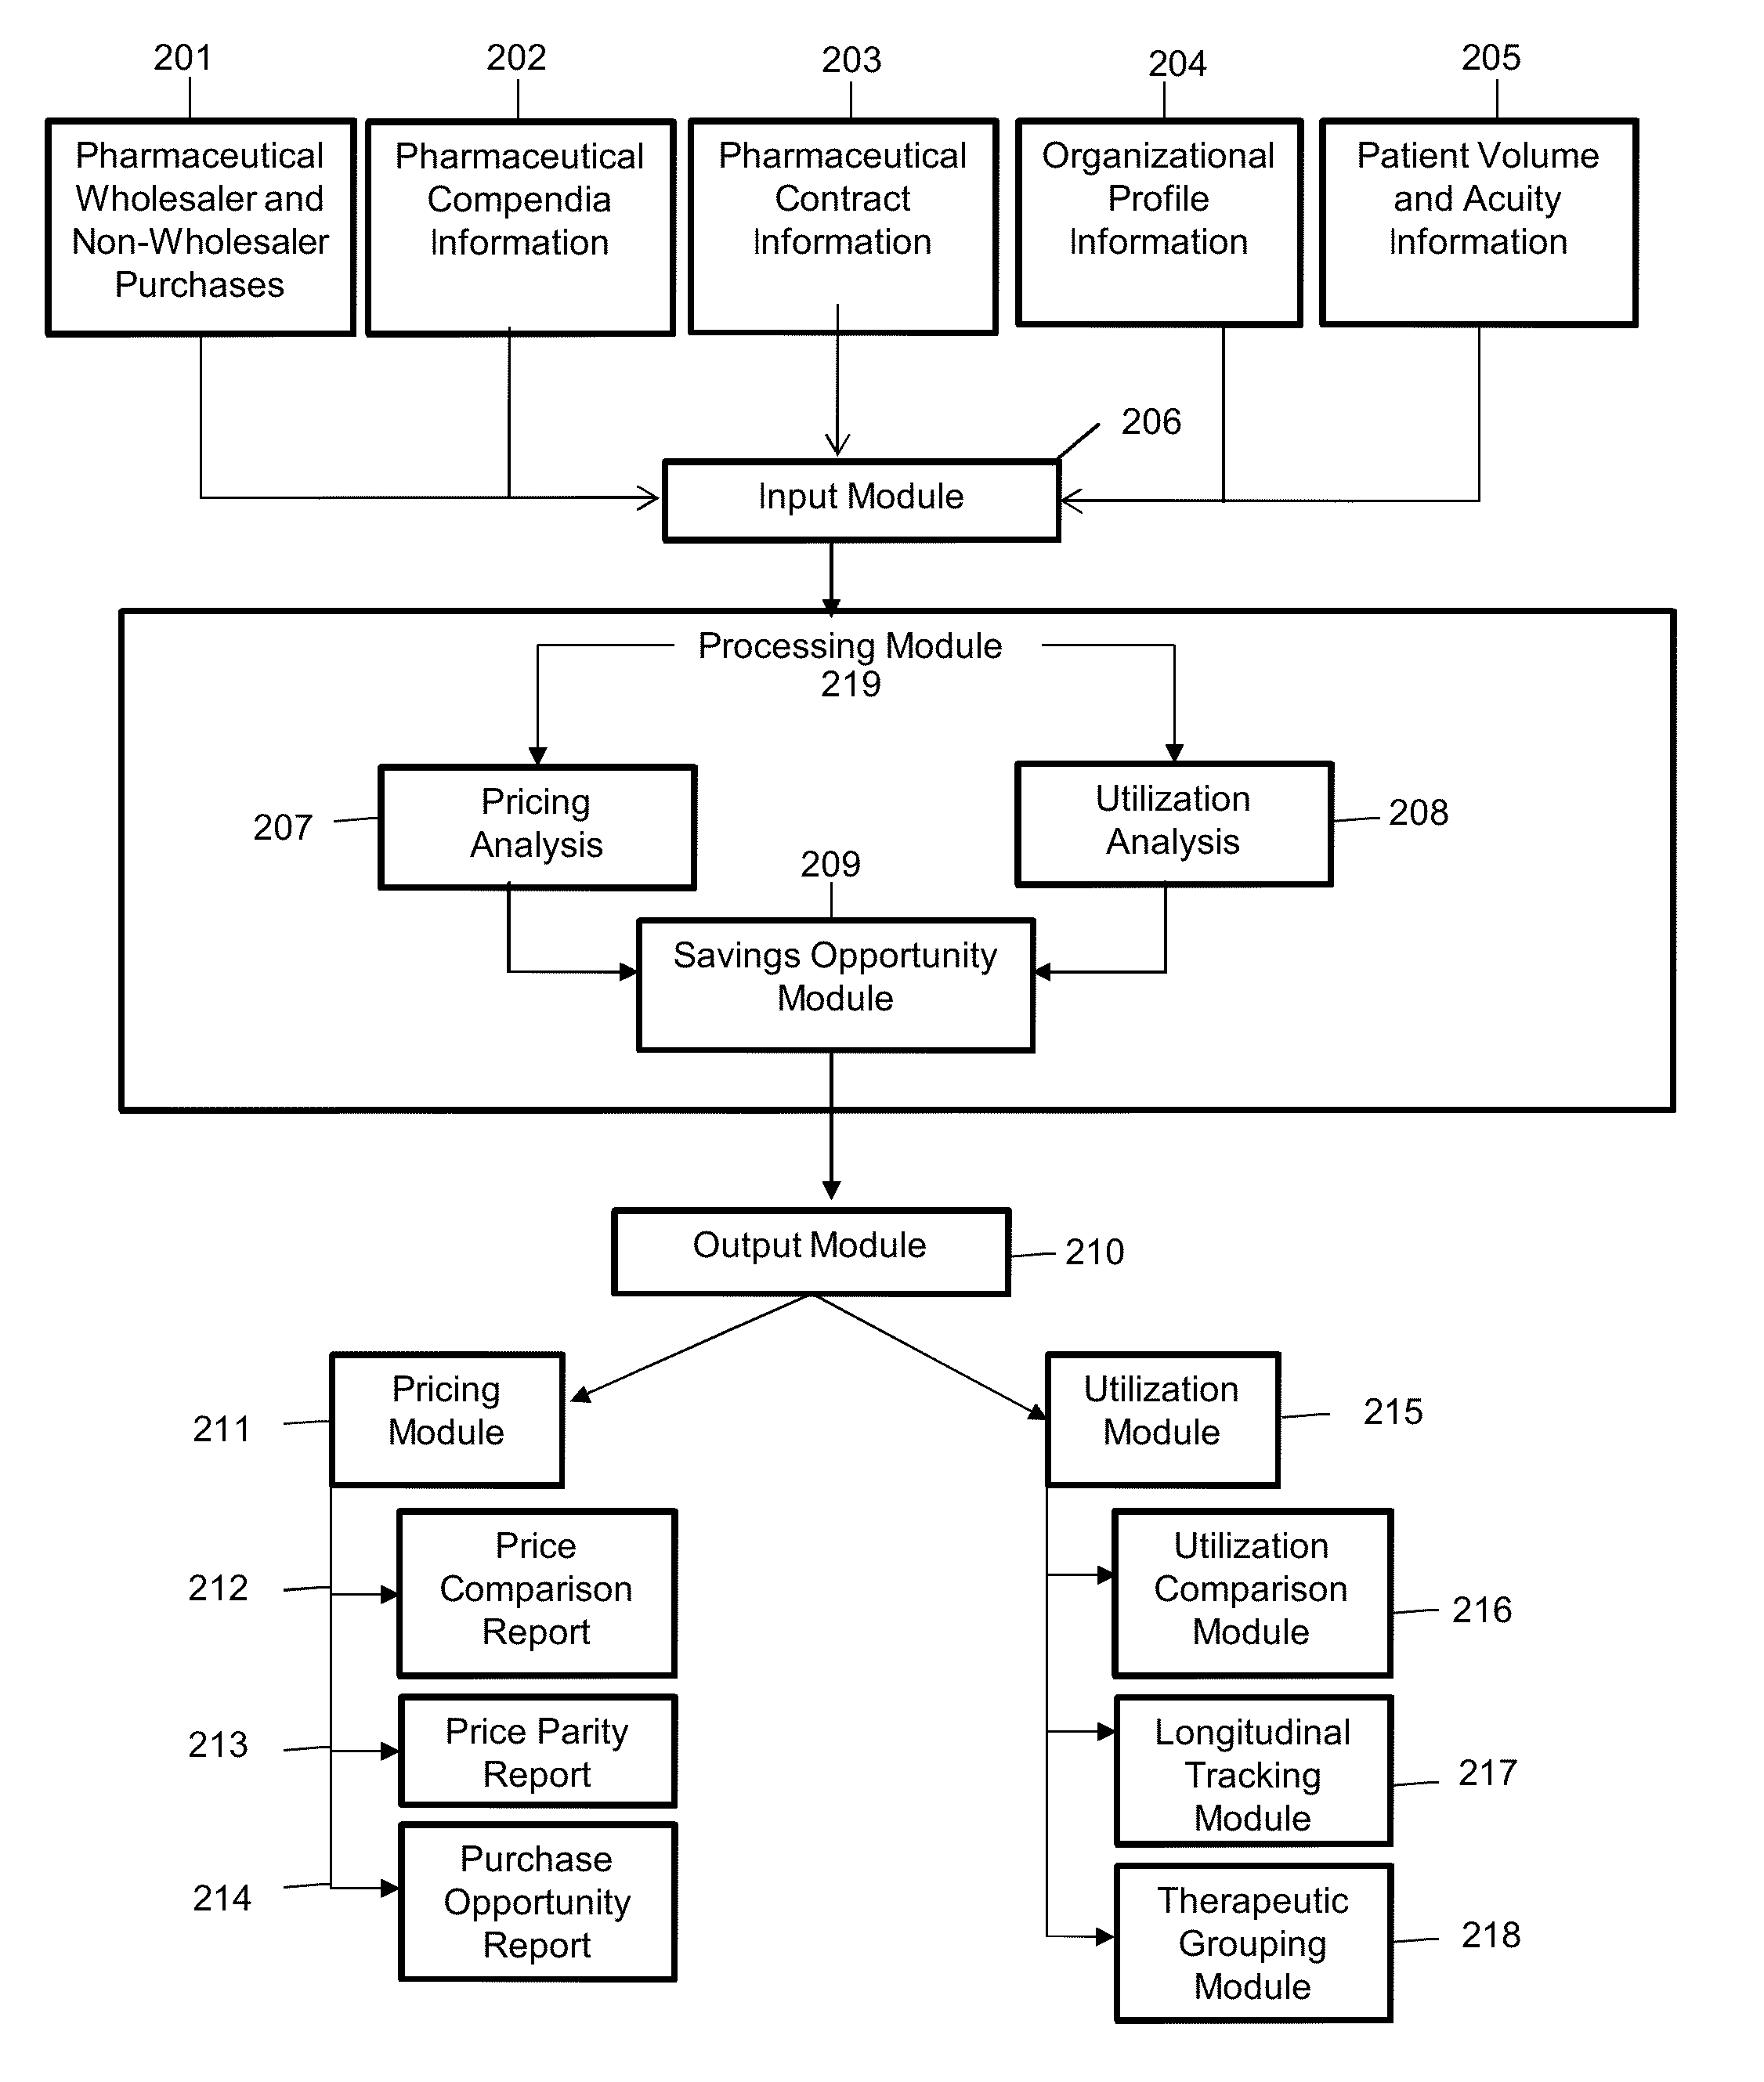
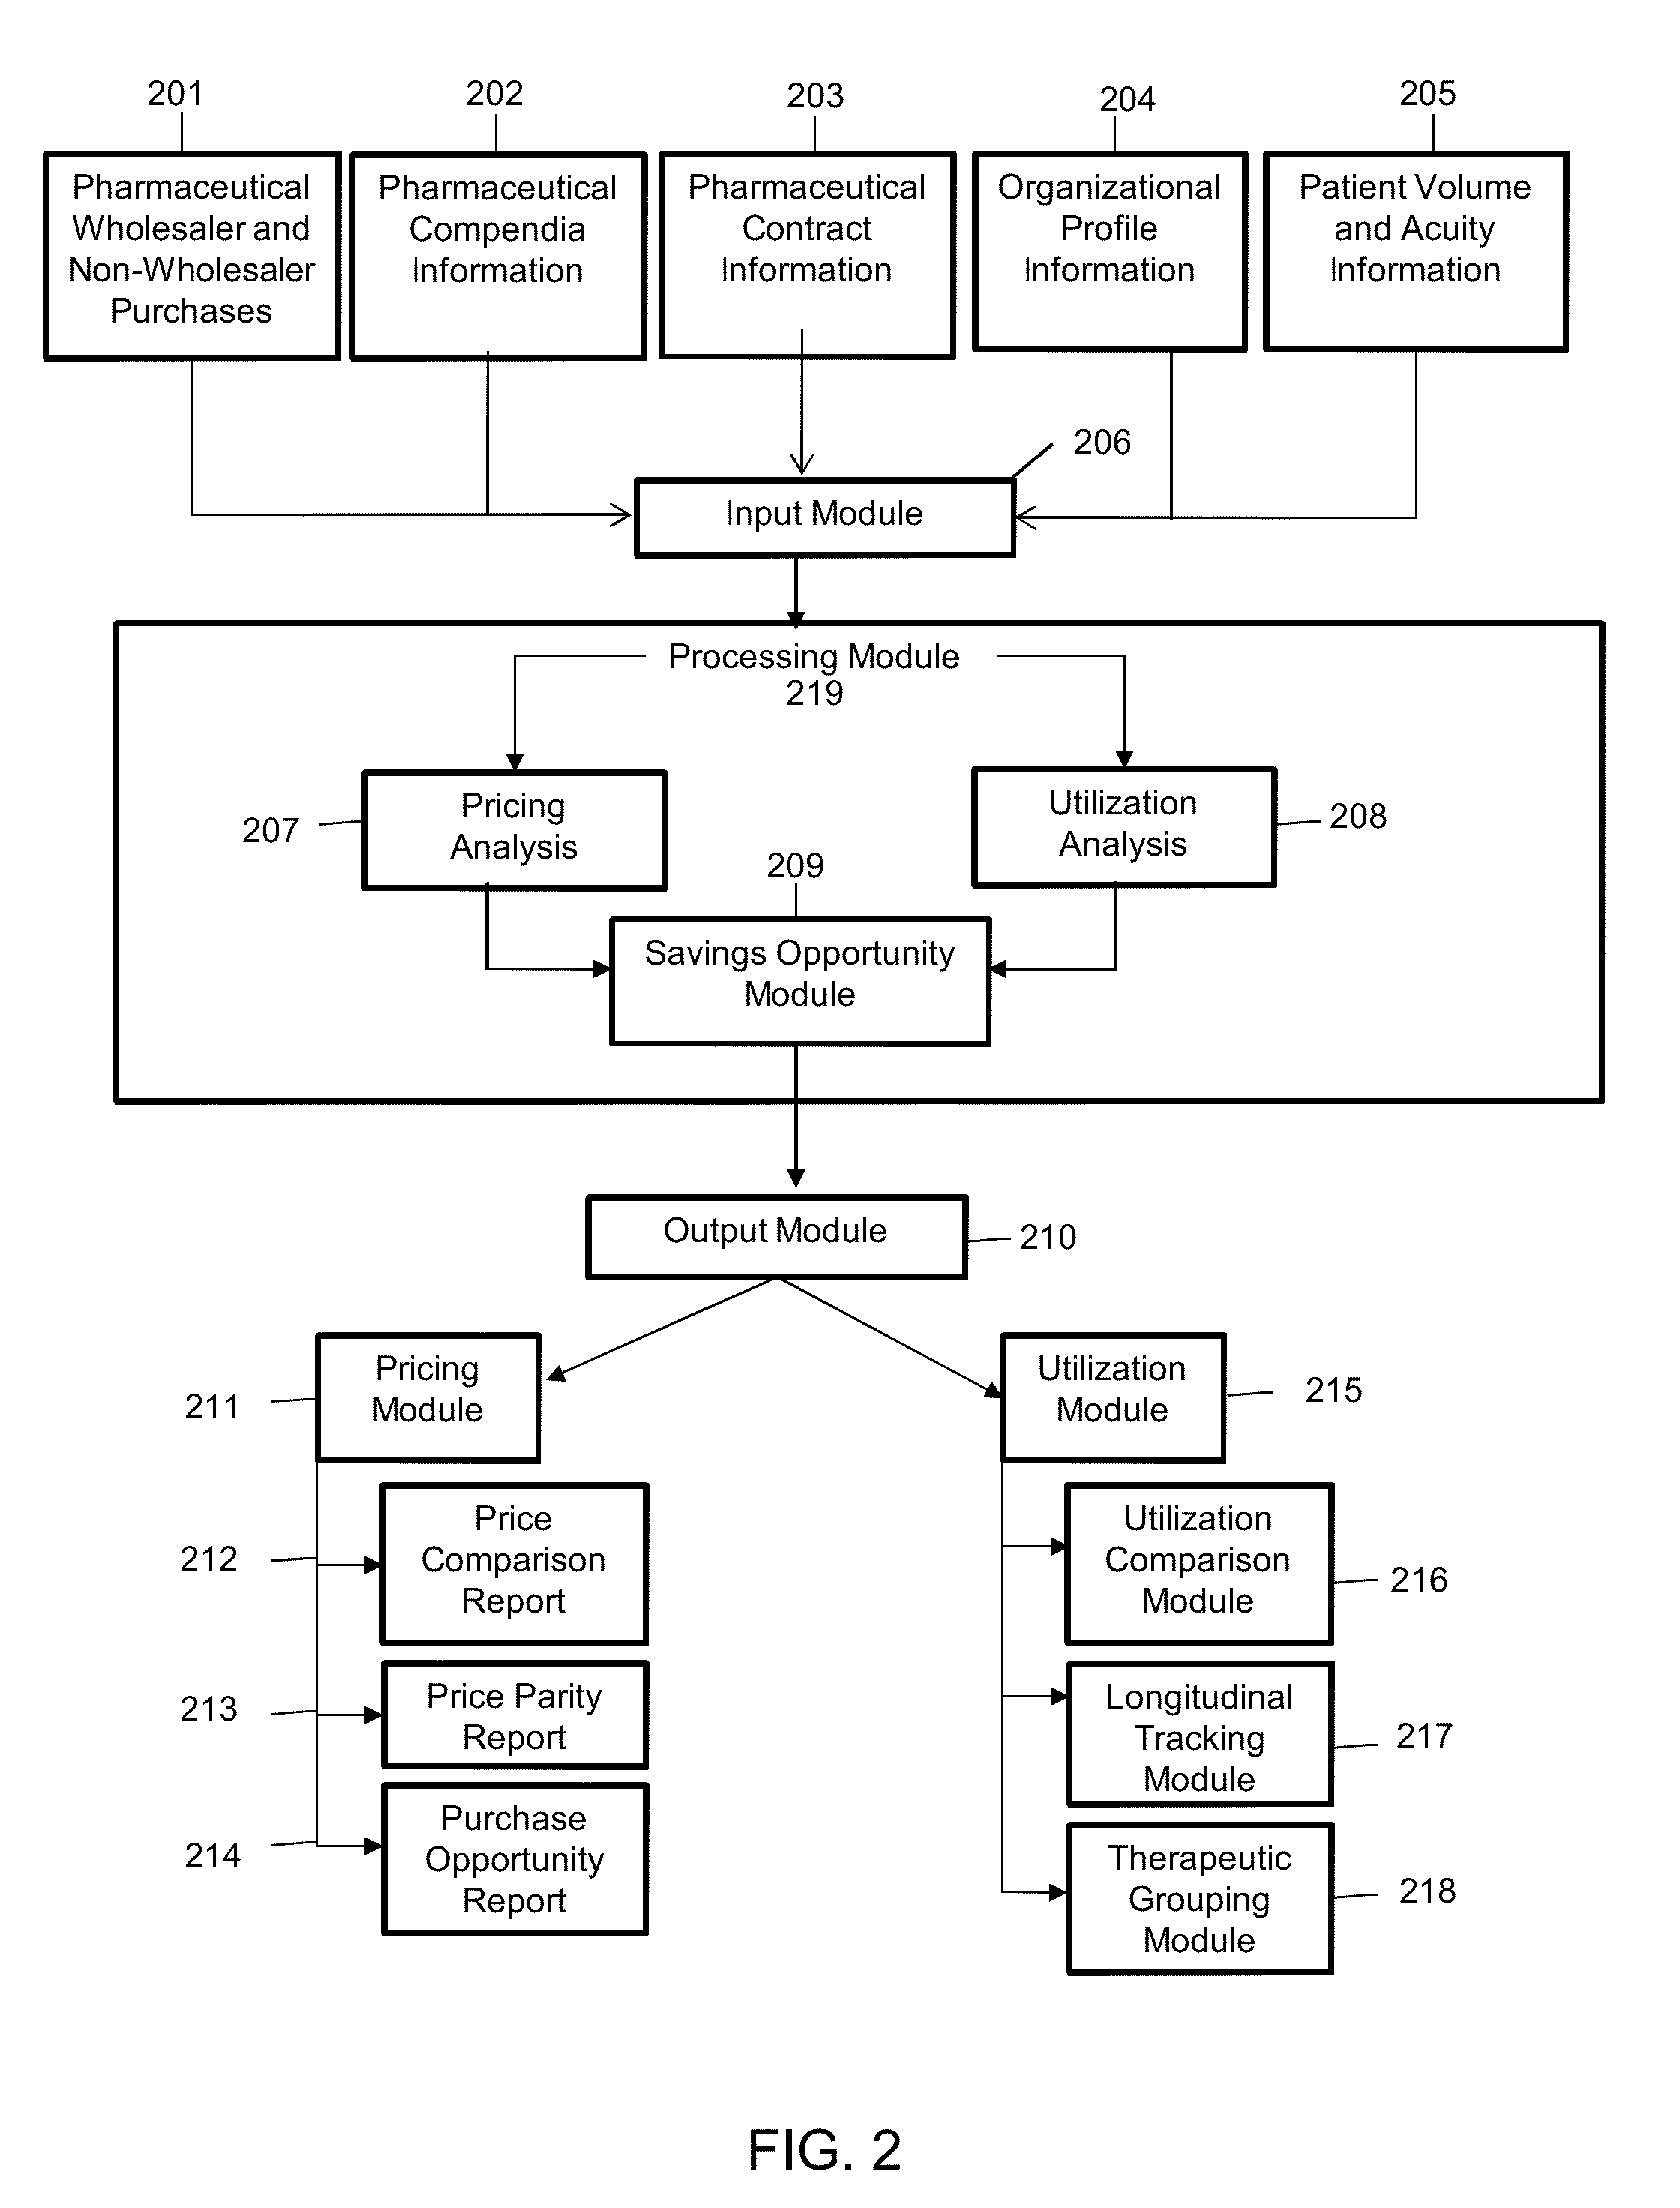
[0052]The present invention describes a process to collect, standardize, organize, analyze, compare and report pharmaceutical purchase data in a consistent, unbiased way while maintaining confidentiality of contract terms and provisions of individual suppliers and organizations involved in the purchasing, contracting and supplying of pharmaceutical products.

[0053]Definition of terms used herein are as follows:

[0054]Adjusted patient days: An aggregate figure reflecting the number of days of inpatient care, plus an estimate of the volume of outpatient services, expressed in units equivalent to an inpatient day in terms of level of effort. The figure is derived by first multiplying the number of outpatient visits by the ratio of outpatient revenue per outpatient visit to inpatient revenue per inpatient day. The product (which represents the number of patient days attributable to outpatient services) is then added to the number of inpatient days. Originally, the purpose of this calculat...


PUM


Abstract

A system and method for comparing pharmaceutical prices and mediation utilization that provides separate databases containing (i) client pharmaceutical wholesaler and non-wholesaler purchase data, (ii) pharmaceutical compendia information, (iii) client pharmaceutical contract information, (iv) client organizational profile information, and (v) client patient volume and acuity data; and a processor in communication with the databases that (i) uploads the data and information from the databases into an input module that standardizes, validates and merges the data and information, (ii) processes the data and information from the input module by performing pricing and utilization analyses on the information and generating savings opportunities information, and (iii) formats the savings opportunities information and generates and pricing and utilization reports. A database interface for customized reporting and research analytics is also provided.

Description

CROSS-REFERENCE TO RELATED APPLICATIONS[0001]This application claims priority to U.S. Provisional Application Ser. No. 61 / 829,677, titled SYSTEM AND METHOD OF PHARMACEUTICAL NET PRICE AND UTILIZATION BENCHMARKING AND MONITORING, filed May 31, 2013, incorporated by reference herein in its entirety.FIELD OF THE INVENTION[0002]The present invention relates to the pricing and utilization patterns of pharmaceutical items. More specifically, it relates to the calculation of the net per unit price for pharmaceutical products, and the comparison of the net per unit price for identical or nearly identical products between similarly situated organizations. In addition, the invention specifically relates to the calculation of metrics that provide markers for drug utilization by a health care organization. The metrics for utilization include purchases, doses, days of therapy or treatment courses for pharmaceutical products, classes of pharmaceutical products or similarly grouped pharmaceutical ...

Claims


Application Information

Patent Timeline
Patent Type & Authority Applications(United States)
IPC IPC(8): G06Q50/22G06Q30/06G16H20/10G16H70/40
CPCG06Q30/0629G06Q50/22G06Q30/0201G16H70/40G06Q10/10G16H20/10
Inventor PTACHCINSKI, RICHARD JUDE
Owner AMERICAN PHARMACOTHERAPY
Why Eureka
Try Eureka