
Method of identifying the spatial distribution of areas in a sensory area of brain, program, and recording medium therefor

a technology of brain activity and spatial distribution, applied in the field of method of identifying the spatial distribution of areas in a sensory area of brain, a program, and a recording medium therefor, can solve the problem of limiting the amount of brain activity information to be analyzed

Inactive Publication Date: 2014-12-18
CANON KK
View PDF6 Cites 12 Cited by
  • Summary
  • Abstract
  • Description
  • Claims
  • Application Information

AI Technical Summary

Benefits of technology

The present invention provides a method for identifying the spatial distribution of areas in a sensory area of brain using a sensory stimulus. This method can identify more types of sensory stimuli than in the past and does not require considerable experience. The method involves determining a rough spatial distribution of an area in the brain, applying a sensory stimulus to the area, measuring brain activity in a region that includes the area while the stimulus is being applied, and using the brain activity information to calculate a coefficient of cross-correlation and coherence between brain activity information of areas in the left and right hemispheres. The method can also change the spatial distribution of the areas in the brain to increase the cross-correlation and coherence between them. This invention provides a useful tool for studying brain activity and its relationship to different sensory stimuli.

Problems solved by technology

However, existing methods of identifying the spatial distribution of areas have the following problems.
Only a limited few types of sensory stimuli are used in the identification of the spatial distribution of areas, thereby limiting the amount of brain activity information to be analyzed for the identification of the spatial distribution of areas as well.
In addition, there are no quantitative criteria at the stage where the obtained brain activity information is analyzed and areas are identified, thus necessitating manual determination by those who have considerable experience.

Method used


Image

  • Method of identifying the spatial distribution of areas in a sensory area of brain, program, and recording medium therefor
  • Method of identifying the spatial distribution of areas in a sensory area of brain, program, and recording medium therefor
  • Method of identifying the spatial distribution of areas in a sensory area of brain, program, and recording medium therefor

Examples


example 1

[0225]A configuration example of a method of identifying the spatial distribution of areas in a sensory area of brain to which the present invention is applied is described as Example 1.

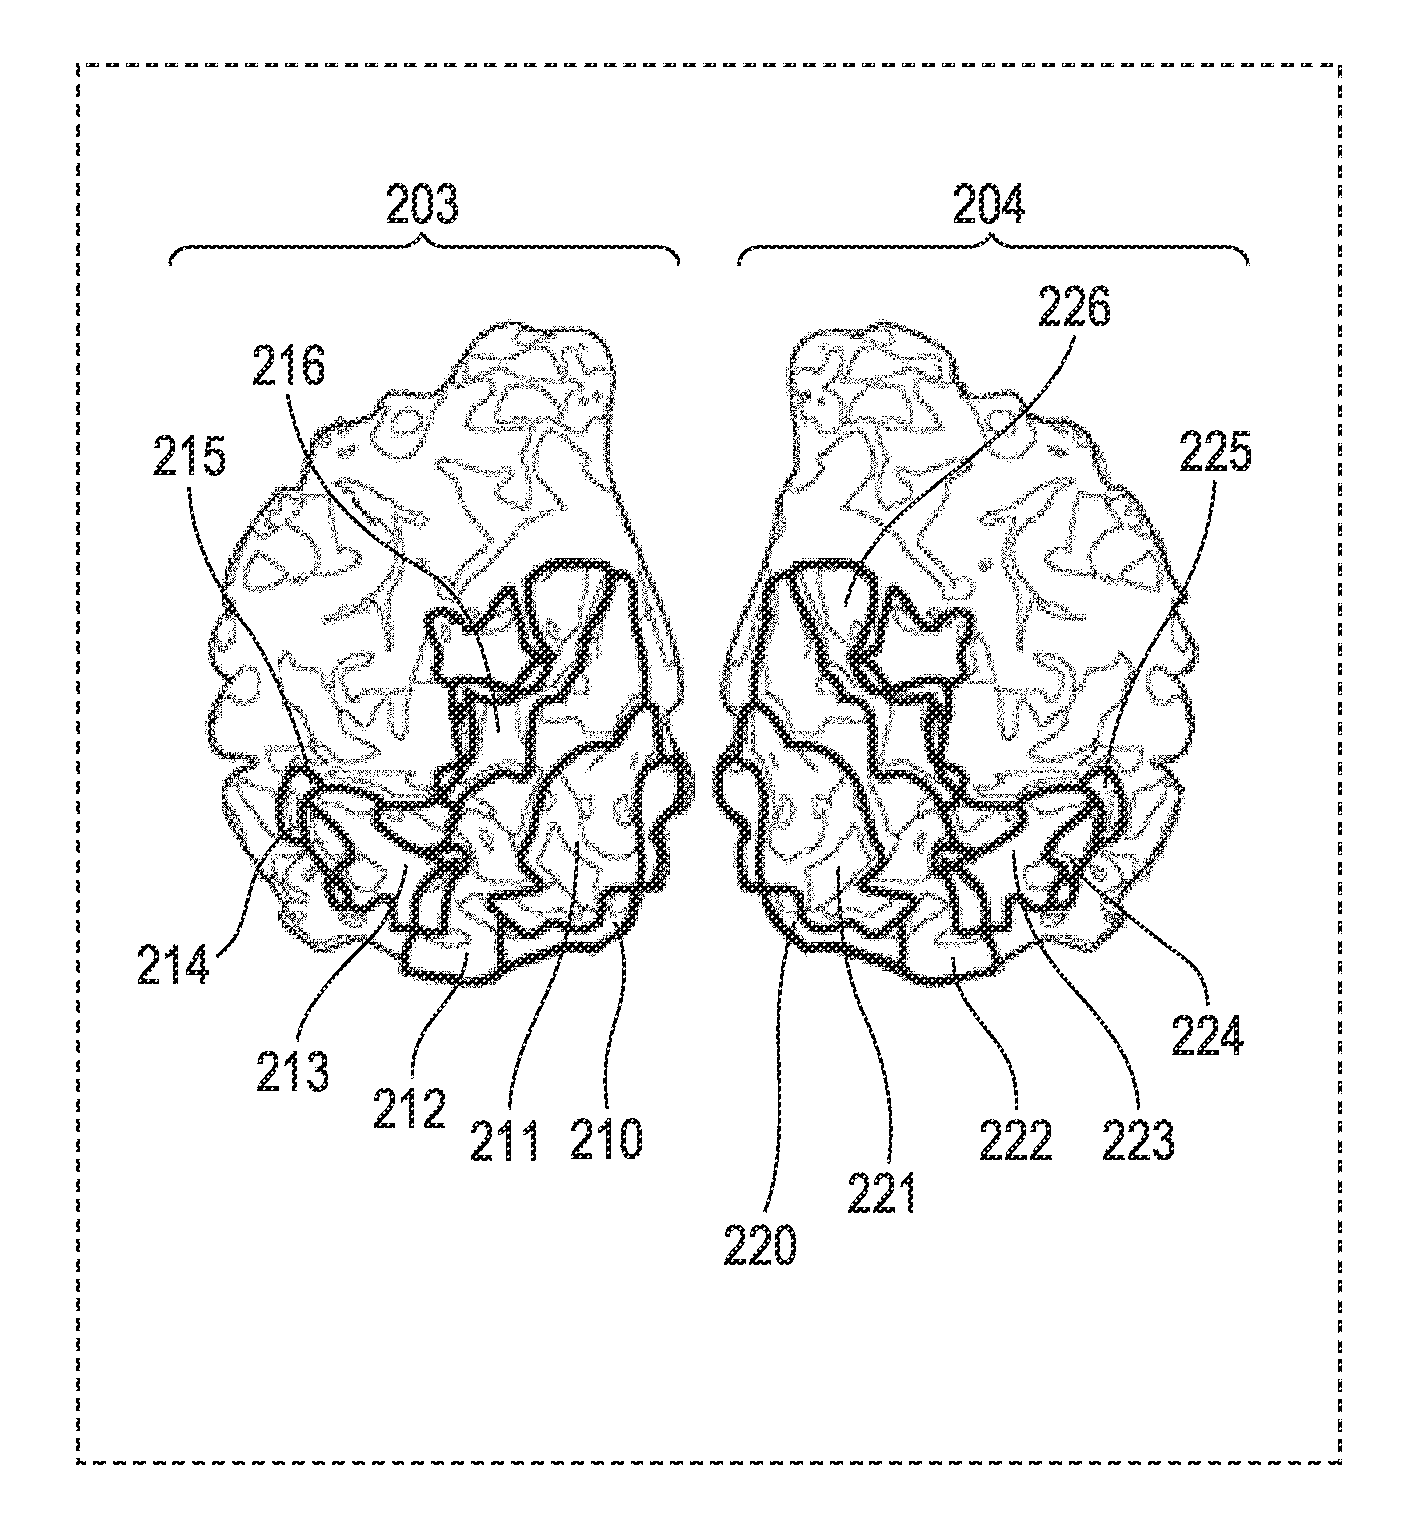
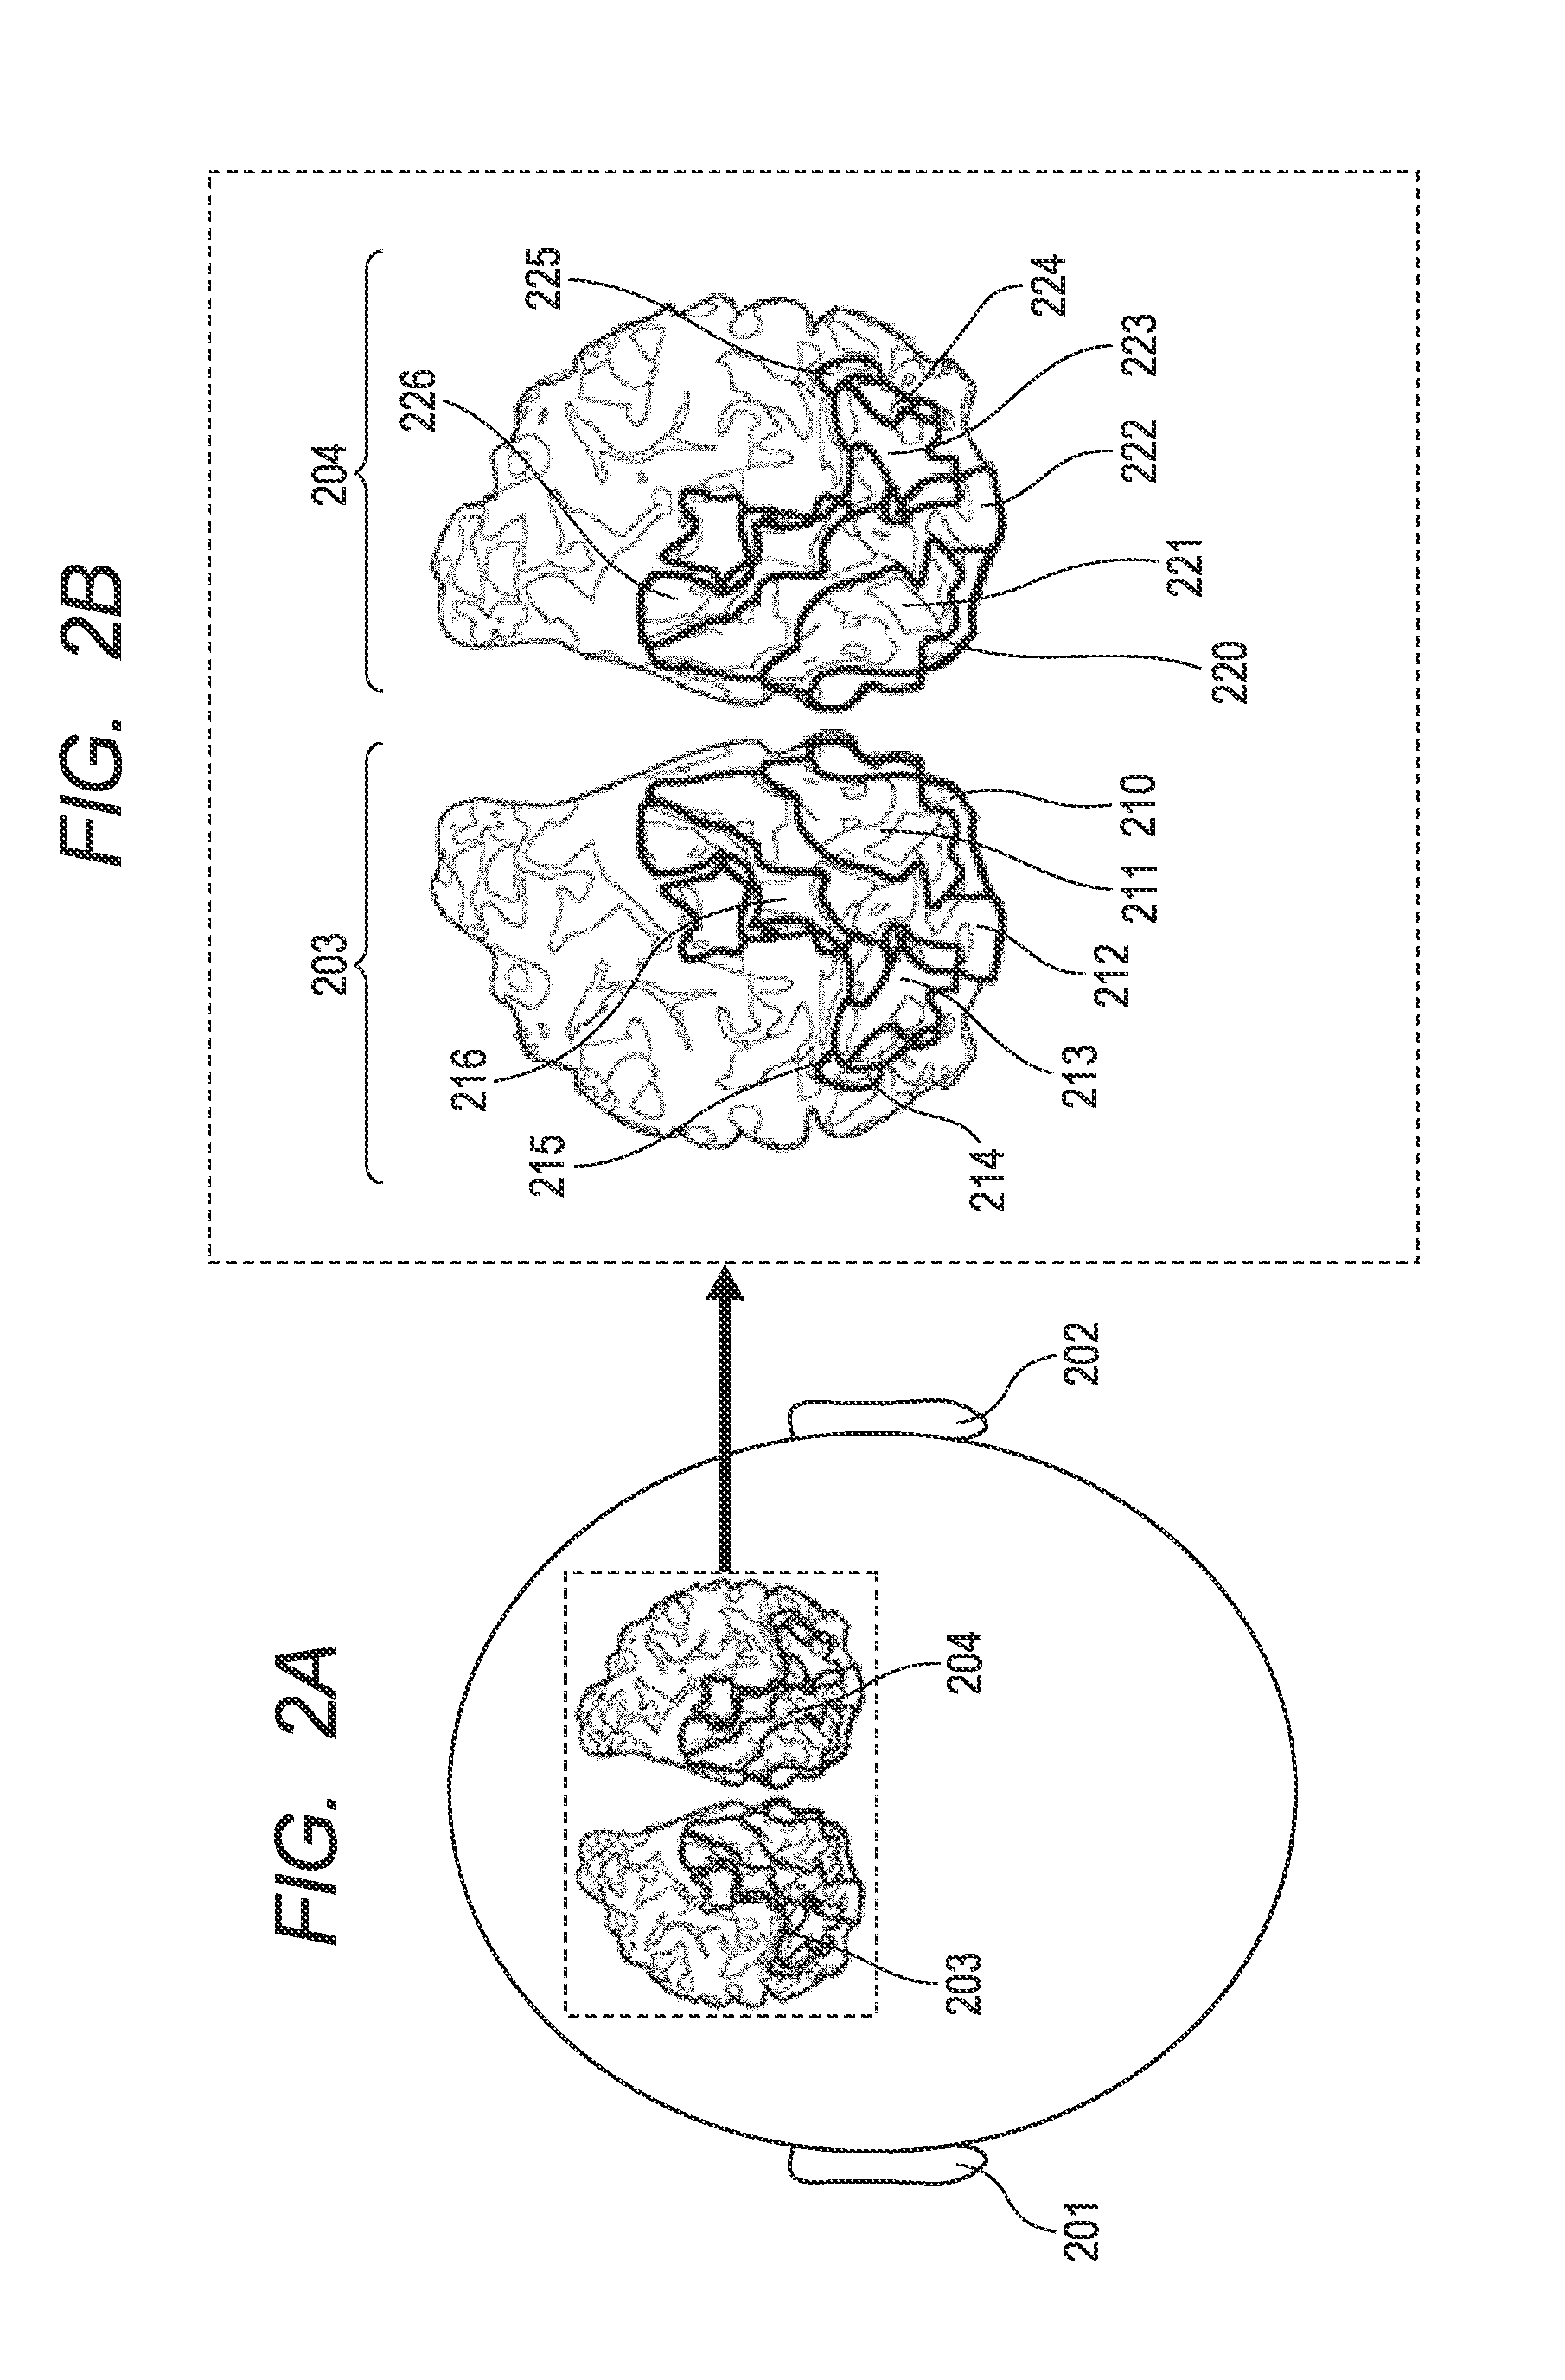
[0226]Specifically, an example is described in which the spatial distribution of V8 in the visual cortex which is the target area is identified by measuring brain activity with an fMRI machine and using an image as a sensory stimulus.

[0227]In this example, V8 which is located roughly in a fusiform gyrus in the ventral region of the occipital of the brain is the area to be identified.

[0228]The first step in the present invention described above is executed by determining the rough spatial distribution of V8 based on a subject's MRI anatomical image (T1 image) which is taken in advance and the anatomical findings described above.

[0229]The brain activity measuring machine used in this example is an fMRI machine.

[0230]A display device has a screen which is provided in a tubular measurement part of the fM...

example 2

[0245]A configuration example in which the spatial distribution of a target area that is a combined area of the MT area and the MST area (hereinafter referred to as MT+ area) is identified by measuring brain activity with an electroencephalograph and using an image as a sensory stimulus is described as Example 2.

[0246]Specifically, this example discusses an example in which the MT+ area located roughly in an inferior temporal sulcus in the dorsal region of the occipital of the brain is an area to be identified.

[0247]In this example, the first step in the present invention is executed by determining the rough spatial distribution of the MT+ area based on brain activity information that is measured with the use of the visual stimulus “eccentricity” and “angle” described above and an fMRI machine, and based on anatomical information (findings).

[0248]The brain activity measuring machine used in this example is an electroencephalograph. The spatial distribution of the MT+ area determined...

example 3

[0257]A configuration example in which the spatial distribution of a target area that is the MT+ area and the LOc area is identified by measuring brain activity with an fMRI machine and using an image as a sensory stimulus is described as Example 3.

[0258]The area to be identified in this example is the MT+ area, which is located roughly in an inferior temporal sulcus in the dorsal region of the occipital of the brain, and the LOc area, which is further at the back of the occipital and abuts on the MT+ area. The first step is executed by determining rough spatial distribution of the MT+ area and the LOc area based on brain activity information that is measured with the use of the visual stimuli “eccentricity” and “angle” described above and an fMRI machine.

[0259]In the same system as in Example 1, time-series data of brain activity is measured with the fMRI machine.

[0260]The time-series data of the brain activity measured with the fMRI machine is analyzed on a computer with the use o...


PUM


Abstract

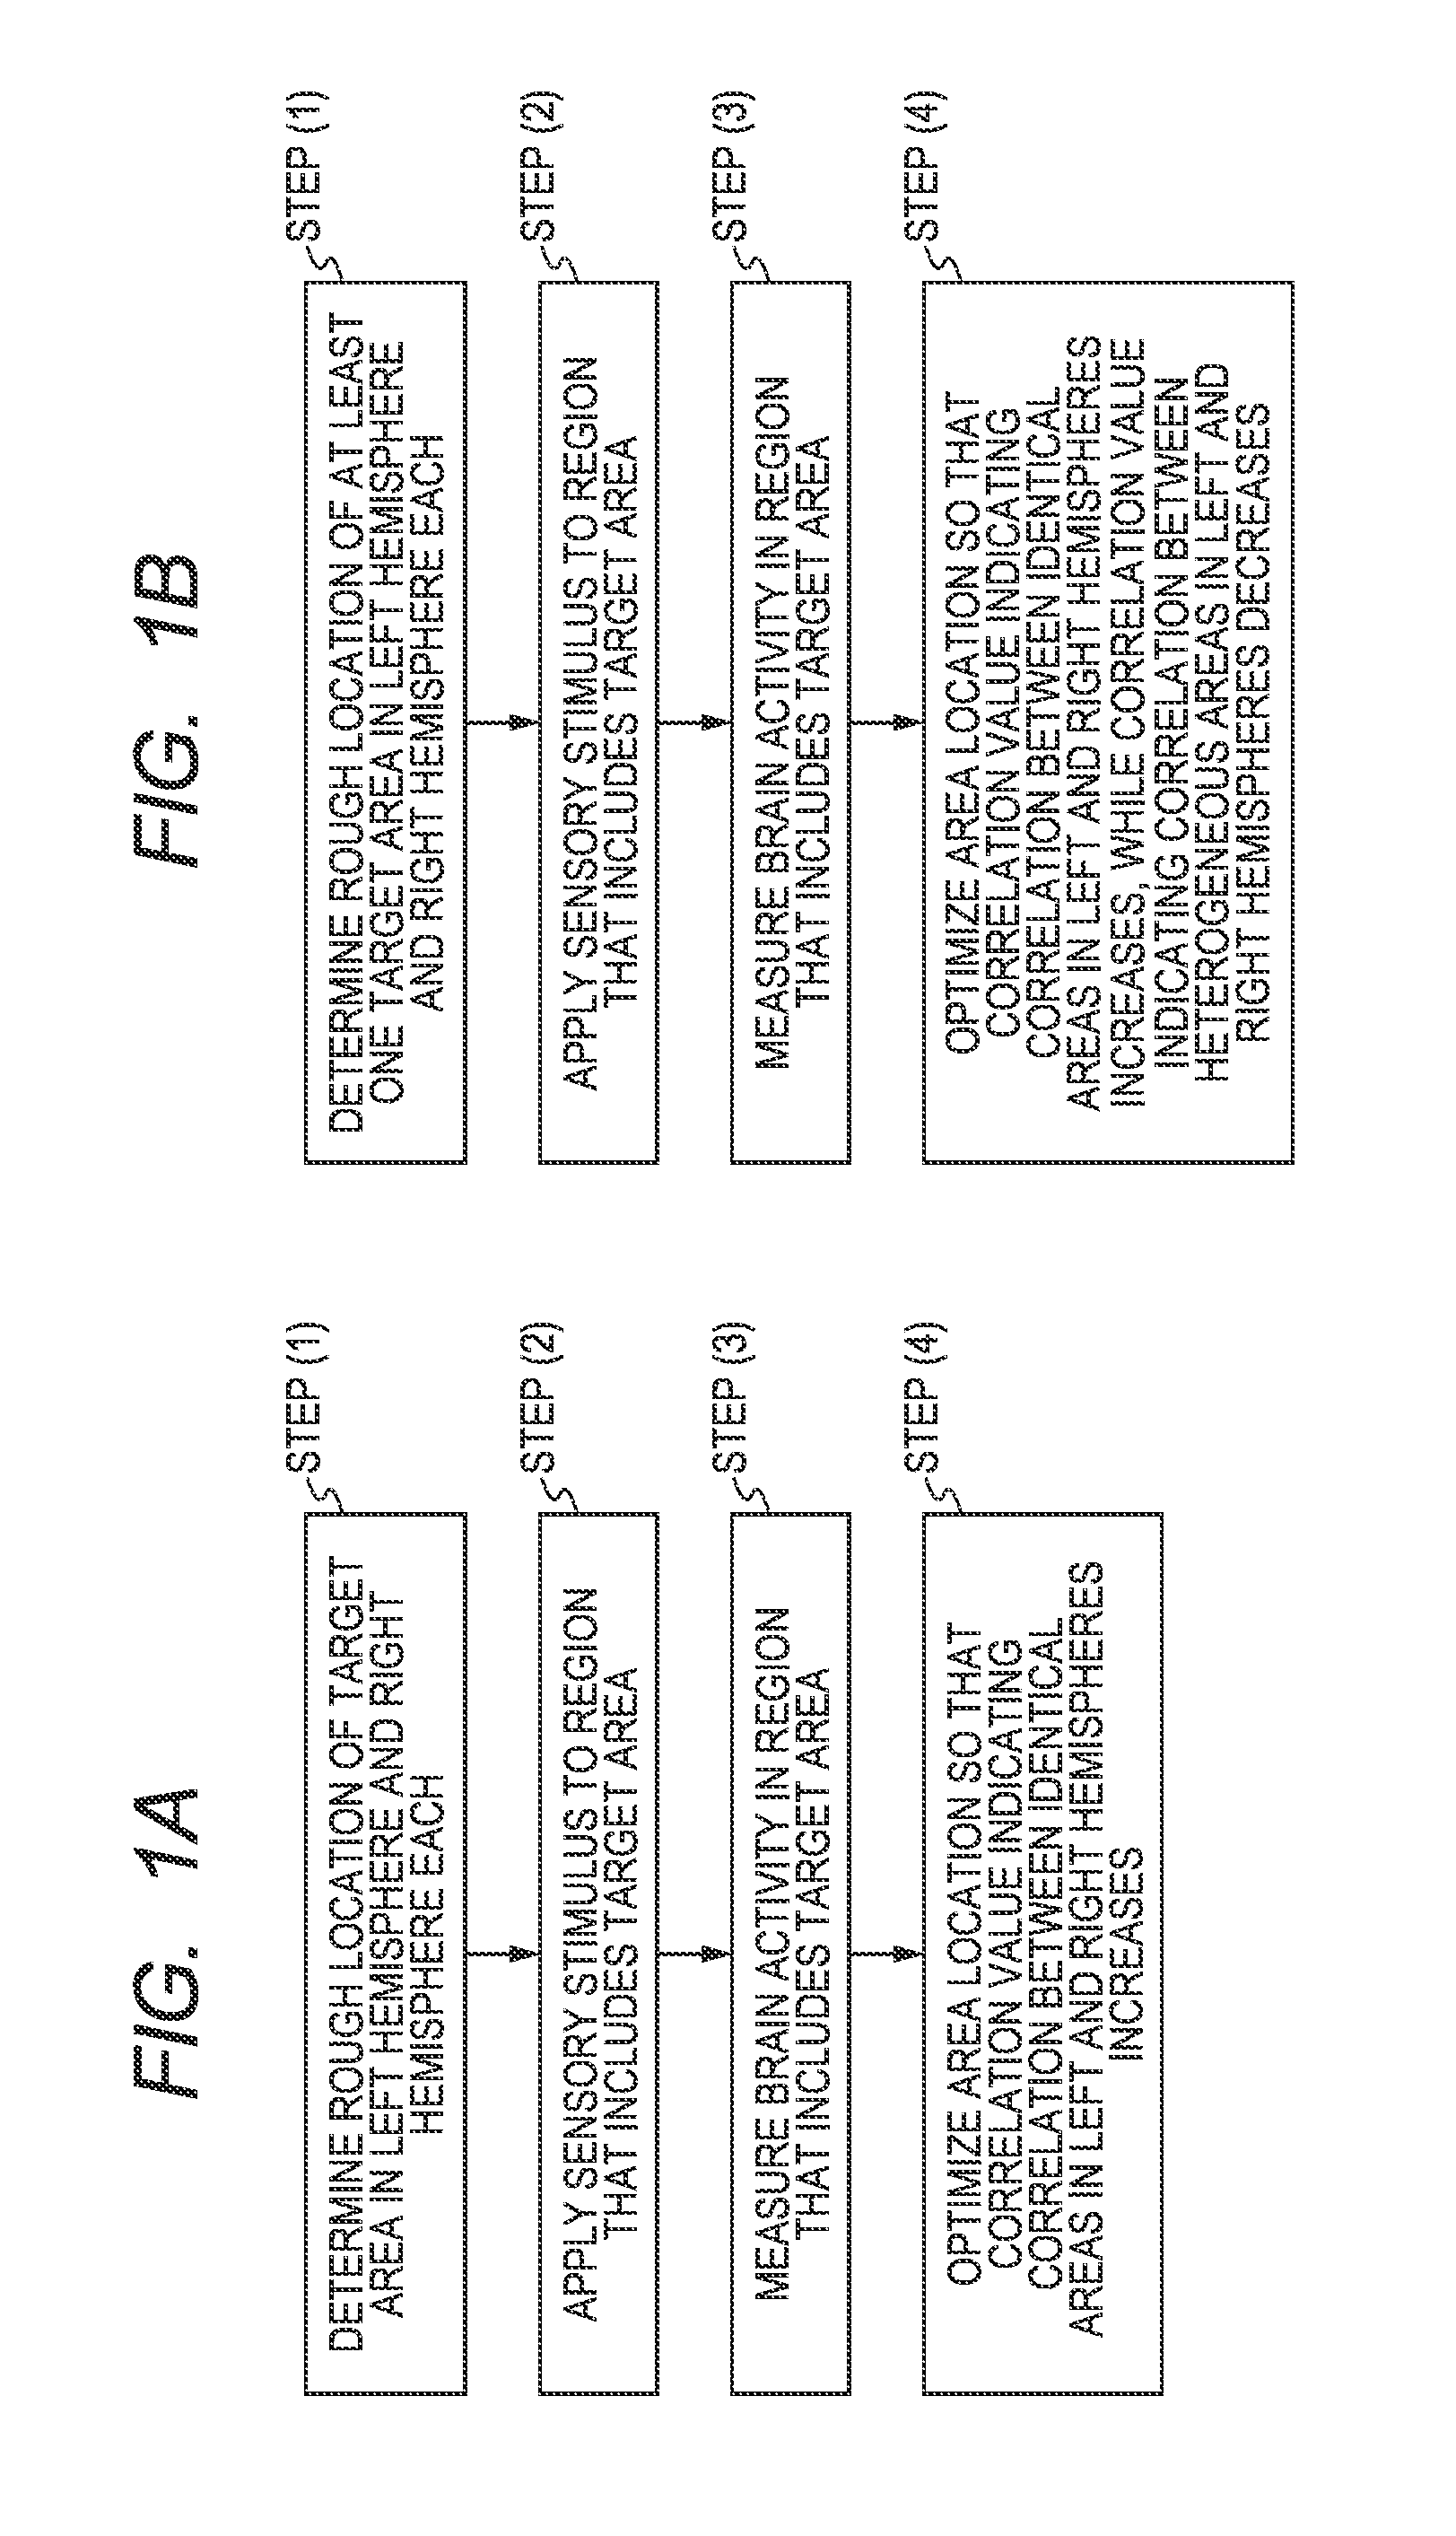
A method of identifying a spatial distribution of areas includes: a first step of determining a rough spatial distribution of at least one area in a sensory area of cerebral cortex in each of a left hemisphere and right hemisphere of the brain that is a target area of the identification; a second step of applying a sensory stimulus to the identification target area; a third step of obtaining brain activity information; and a fourth step of using the brain activity information to calculate one of a coefficient of cross-correlation, and coherence, between brain activity information of areas, assessing synchrony between the left and right hemispheres, and changing the spatial distribution determined in the first step.

Description

BACKGROUND OF THE INVENTION[0001]1. Field of the Invention[0002]The present invention relates to a method of identifying the spatial distribution of areas in a sensory area of brain, a program, and a recording medium therefor.[0003]2. Description of the Related Art[0004]The brains of humans and apes have sensory areas which respectively handle processing of visual, auditory, and other sensory functions. It has been found that some sensory areas can be divided into finer function sites (areas), and attempts are being made to identify the locations and shapes of those areas in order to assess human senses quantitatively. The locations and shapes of areas that form a sensory area of brain are hereinafter referred to as the spatial distribution of areas.[0005]This sensory area model in which a sensory area is divided into areas is called retinotopy in the case of visual sense and tonotopy in the case of auditory sense, and researches about visual sense which is the most important sense ...

Claims


Application Information

Patent Timeline
Patent Type & Authority Applications(United States)
IPC IPC(8): A61B5/0484A61B5/055
CPCA61B5/04842A61B5/04847A61B5/055A61B5/0075A61B5/4064A61B5/378A61B5/38
Inventor KOMOTO, ATSUSHIICHIMURA, YOSHIKATSUKAWASHIMA, YASUHIROMIYAZAKI, JUNGO
Owner CANON KK
Learn More