Composition for tungsten buffing

Active Publication Date: 2015-09-24
CMC MATERIALS INC
6 Cites 11 Cited by

AI-Extracted Technical Summary

Problems solved by technology

As semiconductor device feature sizes continue to shrink, meeting local and global planarity requirements has become more difficult in CMP operations (e.g., in tungsten CMP operations).
Array erosion (also referred to as oxide erosion), plug and line recessing, and tungsten etching defects are known to compromise planarity and ...

Benefits of technology

[0005]A chemical mechanical polishing composition for polishing a substrate having a tungsten layer is disclosed. The composition includes a water based liquid carrier and colloidal silica abrasive particles dispersed in the liquid carrier. About 30 percent or more of the colloidal silica abrasive particles include three or more aggregated primary particles. The colloidal silica abrasive particles further have a permanent positive charge of at least 6 mV. A method for chemical mechanical polishing a substrate including a tungsten layer is further disclosed. The method may include contacting the substrate with the above described p...

Abstract

A chemical mechanical polishing composition for polishing a substrate having a tungsten layer includes a water based liquid carrier and colloidal silica abrasive particles dispersed in the liquid carrier. The colloidal silica abrasive particles have a permanent positive charge of at least 6 mV. About 30 percent or more of the colloidal silica abrasive particles include three or more aggregated primary particles.

Application Domain

Other chemical processesDecorative surface effects +5

Technology Topic

Colloidal silicaTungsten +3

Image

  • Composition for tungsten buffing

Examples

  • Experimental program(6)

Example

Example 1
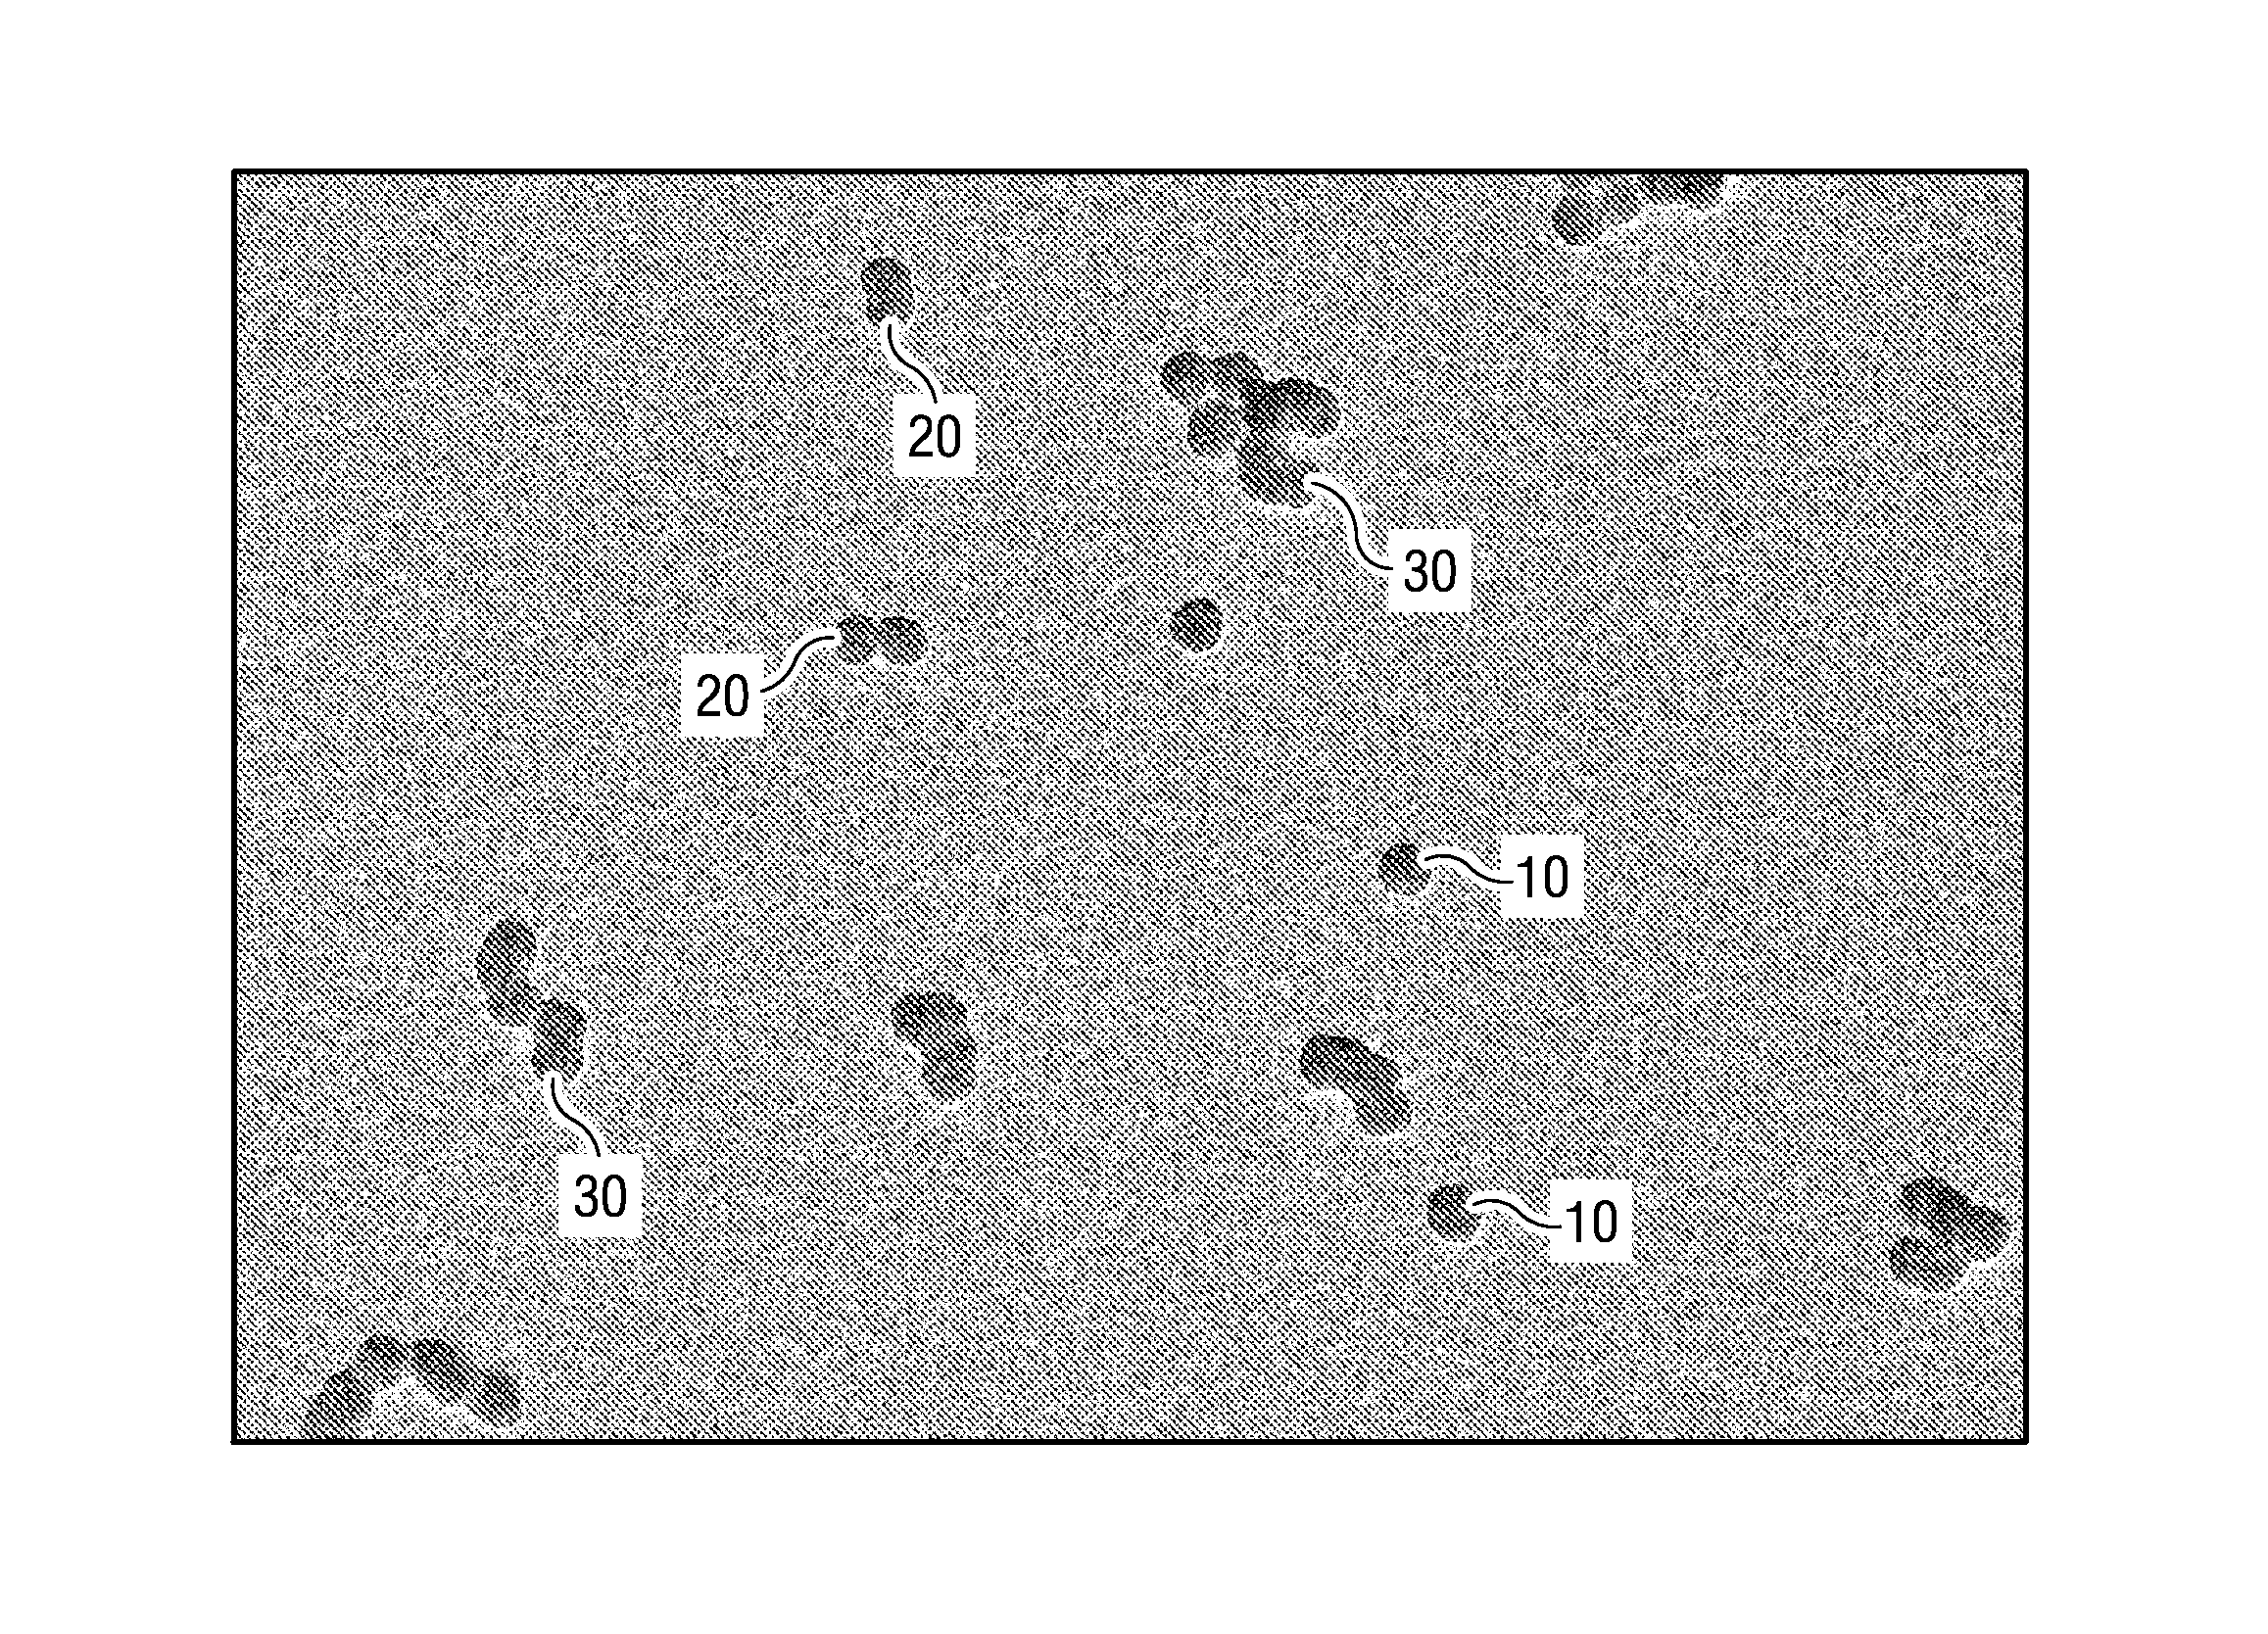
[0048]The silicon oxide (TEOS) polishing rate was evaluated in this example for various polishing compositions. This example demonstrates the effect of colloidal silica particle aggregation on the TEOS polishing rate. The TEOS polishing rates were obtained by polishing eight inch wafers having a TEOS layer using a Mirra® CMP tool (available from Applied Materials) and an IC1010 polishing pad at down-force of 1.5 psi, a platen speed of 100 rpm, and a slurry flow rate of 150 ml/min. Three colloidal silica particle dispersions were evaluated. Each of the dispersions had a primary particle size of about 20 nm. The first dispersion (1A) was made up of predominantly non-aggregated primary colloidal silica particles. The second dispersion (1B) was made up of predominately aggregated colloidal silica particles in which more than 50% of the aggregates included two primary particles. The third dispersion (1C) was made up of aggregated colloidal silica particles in which greater than 30 percent of the aggregates included three or more primary particles. Each of the dispersions was diluted with deionized water such that it included 1.5 weight percent colloidal silica abrasive particles. Each of the polishing compositions had a pH of 3.2 and further included 0.015 weight percent benzotriazole, 0.015 weight percent 5-Amino-1H-tetrazole anhydrous (ATA), 0.010 weight percent DL Alanine, and 0.5 weight percent hydrogen peroxide. Table 1 shows the TEOS polishing rate obtained for each colloidal silica dispersion.
TABLE 1 Colloidal Silica Solids TEOS Polishing Dispersion (percent) Rate (Å/min) 1A 2 380 1B 2 510 1C 2 1100
[0049]As is apparent from the results set forth in Table 1, colloidal silica dispersion 1C (made up of aggregated colloidal silica particles in which greater than 30 percent of the aggregates included three or more primary particles) exhibits a significantly increased TEOS polishing rate as compared with colloidal silica dispersions 1A and 1B.

Example

Example 2
[0050]The silicon oxide (TEOS) polishing rate was evaluated in this example for various polishing compositions. This example demonstrates the effect of colloidal silica particle aggregation on the TEOS polishing rate. The TEOS polishing rates were obtained by polishing eight inch wafers having a TEOS layer using a Mirra® CMP tool (available from Applied Materials) and an IC1010 polishing pad at down-forces of 0.75, 1.5, and 3.0 psi, a platen speed of 100 rpm, and a slurry flow rate of 150 ml/min. Two colloidal silica particle dispersions were evaluated. Each of the dispersions had a primary particle size of about 20 nm. The first dispersion (2A) was made up of predominately aggregated colloidal silica particles in which more than 50% of the aggregates included two primary particles. The second dispersion (2B) was made up of aggregated colloidal silica particles in which greater than 30 percent of the aggregates included three or more primary particles. Each of the dispersions was diluted with deionized water such that it included the indicated weight percent colloidal silica abrasive particles. Each of the polishing compositions had a pH of 3.0 and further included 0.0267 weight percent malonic acid, 0.02 weight percent of an amine modified hyperbranched polymer, and 2 weight percent hydrogen peroxide. Table 2 shows the TEOS polishing rate obtained for each composition.
TABLE 2 Colloidal Silica Solids Down-force TEOS Polishing Dispersion (percent) (psi) Rate (Å/min) 2A 2 1.5 640 2A 2 3 770 2B 1 1.5 880 2B 1 3 1310 2B 2 0.75 630 2B 2 1.5 1130
[0051]As is apparent from the results set forth in Table 2, colloidal silica dispersion 2B (made up of aggregated colloidal silica particles in which greater than 30 percent of the aggregates included three or more primary particles) exhibits a significantly increased TEOS polishing rates as compared with colloidal silica dispersion 2A. For example, even at half the solids (1 vs. 2 percent) and half the polishing down-force (1.5 vs 3 psi) dispersion 2B exhibits a greater TEOS polishing rate than dispersion 2A (880 vs 770 Å/min). At comparable solids (2 percent) and down-force (1.5 psi) dispersion 2B exhibits a TEOS polishing rate approximately twice that of dispersion 2A (1130 vs 640 Å/min).

Example

Example 3
[0052]The silicon oxide (TEOS) polishing rate was evaluated in this example for various polishing compositions. This example demonstrates the effect of colloidal silica particle aggregate size on the TEOS polishing rate. The aggregate size for each of the colloidal silicas was measured using a Zetasizer® available from Malvern Instruments®. The TEOS polishing rates were obtained by polishing eight inch wafers having a TEOS layer using a Mirra® CMP tool (available from Applied Materials) and an IC1010 polishing pad at down-forces of 1.5 psi, a platen speed of 100 rpm, and a slurry flow rate of 150 ml/min. Colloidal silica dispersions were prepared in which the dispersion was made up of aggregated colloidal silica particles in which greater than 30 percent of the aggregates included three or more primary particles. The average aggregate size ranged from about 25 to about 88 nm. Each of the dispersions was diluted with deionized water such that it contained 3.0 weight percent colloidal silica abrasive particles. Each of the polishing compositions had a pH of 4.0 and further included 0.0025 weight percent Dowfax® C10L (available from Dow Chemical Company), 0.1 weight percent 5-amino-1Htetrazole anhydrous, 0.03 weight percent acetic acid, 0.0014 weight percent of a Kathon® microbicide (available from Dow Chemical Company), and 0.25 weight percent hydrogen peroxide. Table 3 show the TEOS polishing rate obtained for each composition.
TABLE 3 Colloidal Silica Aggregate TEOS Polishing Dispersion Size (nm) Rate (Å/min) 3A 25 400 3B 30 550 3C 32 610 3D 39 890 3E 42 1000 3F 45 1080 3G 48 1110 3H 50 1190 3I 57 1180 3J 64 1040 3K 67 990 3L 88 800
[0053]As is apparent from the results set forth in Table 3, a colloidal silica dispersion made up of aggregated colloidal silica particles in which greater than 30 percent of the aggregates included three or more primary particles exhibits a maximum TEOS polishing rate when the aggregate size is about 50 nm. The TEOS polishing rates are highest in a range of aggregate sizes from about 40 to about 70 nm or from about 45 to about 65 nm.

PUM

PropertyMeasurementUnit
Fraction0.3fraction
Percent by mass1.0mass fraction
Percent by mass4.0mass fraction

Description & Claims & Application Information

We can also present the details of the Description, Claims and Application information to help users get a comprehensive understanding of the technical details of the patent, such as background art, summary of invention, brief description of drawings, description of embodiments, and other original content. On the other hand, users can also determine the specific scope of protection of the technology through the list of claims; as well as understand the changes in the life cycle of the technology with the presentation of the patent timeline. Login to view more.
Why Eureka
Try Eureka