Method and a System for Determining at Least One Forecasted Air Quality Health Effect Caused in a Determined Geographical Area by at Least One Air Pollutant

a technology of air pollution and health effects, applied in the field of methods and systems for determining at least one forecasted air quality health effects caused in a determined geographical area by air pollutants, can solve the problems of no method for precisely determining health effects, and the risk of developing harmful health effects when exposed to air pollutants

Inactive Publication Date: 2016-03-31
GRIFFON TANGUY
View PDF4 Cites 58 Cited by
  • Summary
  • Abstract
  • Description
  • Claims
  • Application Information

AI Technical Summary

Benefits of technology

[0027]A first purpose of the invention is to provide an improved method for determining at least one forecasted air quality health effect by geographical area, compared to current methods available, which can be used to prevent with accuracy, timeliness and in the future the health effects of air pollutants.
[0028]In other terms, in the technical field of determining health effects induced by air pollutants in geographical areas, the method according to the invention allows a determination of health effects of air pollutants more accurately, timely and in the future than current methods, in particular more accurately, timely and forecasted than BenMAP.
[0029]In particular, a first advantage of the method according to the invention is to resolve smaller spatial scales in near real time to obtain the concentrations of an air pollutant and the Air Quality Index (AQI) in the current hour and with hourly and daily forecasts with a resolution of 3×3 km2 (1.86×1.86 sq. miles) over an entire country or continental region, which has never been done to current knowledge. With the determination of hourly concentrations forecasts and AQI, one advantage of the method according to the invention is to determine, for areas that can be between 1 km2 and 10,000 km2 (e.g. 0.3861 sq. miles and 3861 sq. miles), the hourly concentrations and AQI forecasts with an accuracy above 5%. In other terms, the first advantage of the method and of the system according to the invention is to provide a more accurate forecast of air pollutants and AQI, enabling one to determine health effects caused by air pollutants, from a global scale up to an area whose surface is 1×1 km2.

Problems solved by technology

Greenhouse gases are air pollutants given their damaging effects on public health, welfare and the environment.
Outdoor air pollution leads to major adverse health effects and has been declared as a leading environmental health risk by the World Health Organization.
People such as individuals with underlying respiratory and cardiovascular diseases, children, elderly and pregnant women are more prone to develop harmful health effects when exposed to air pollutants.
As of today, there is no method for precisely determining health effects because air quality information is provided at a coarse resolution and with some uncertainty.
Indeed, air pollution information and maps are mainly provided to users under the form of an Air Quality Index (AQI) by websites, weather channels, mobile apps or locally by sensors, which do not allow individuals to view their real-time personal exposures, to find clean air areas around them as well as to visualize future forecasts at a high resolution.
Unfortunately, these approaches are not usable on a personal level due to their coarse temporal resolution (daily), spatial resolution (state or county level), uncertainty and limited future forecasts.
These linear approaches do not consider the high spatial and temporal variability due to pollutants, weather and climate interactions, which leads to uncertainties in air pollutant concentrations and health effects.
They provide sparse monitoring stations data (O3, PM) from ground monitors, which are not usable on a personal level.
A user needs to purchase an extra sensor and wear it continuously, which is an impediment and which does not provide a view on local areas around a user or future forecasts.
In the same perspective, as of today, the attributable public health burden on a population from an air pollutant can only be estimated from historical data on an ad-hoc basis and with some uncertainty related to exposure assessment.
A clear challenge of this health impact assessment is exposure assessment.
In the same perspective as the Air Quality Index methods, these linear approaches do not consider the high spatial and temporal variability due to pollutants, weather and climate interactions.
Hence, as of today, there is no method that would enable individuals to prevent accurately their health effects from air pollution depending on their pathology in any location in near real-time as well as in the future.
Therefore, as of today, there are no system that individuals can use to predict with accuracy and when and where local air quality will be more or less healthy in near real-time and in the future.
There is also no system to automatically alert a user exposed to harmful levels and to enable him or her to find clean air around, thus preventing health effects.

Method used


Image

  • Method and a System for Determining at Least One Forecasted Air Quality Health Effect Caused in a Determined Geographical Area by at Least One Air Pollutant
  • Method and a System for Determining at Least One Forecasted Air Quality Health Effect Caused in a Determined Geographical Area by at Least One Air Pollutant
  • Method and a System for Determining at Least One Forecasted Air Quality Health Effect Caused in a Determined Geographical Area by at Least One Air Pollutant

Examples


Embodiment Construction

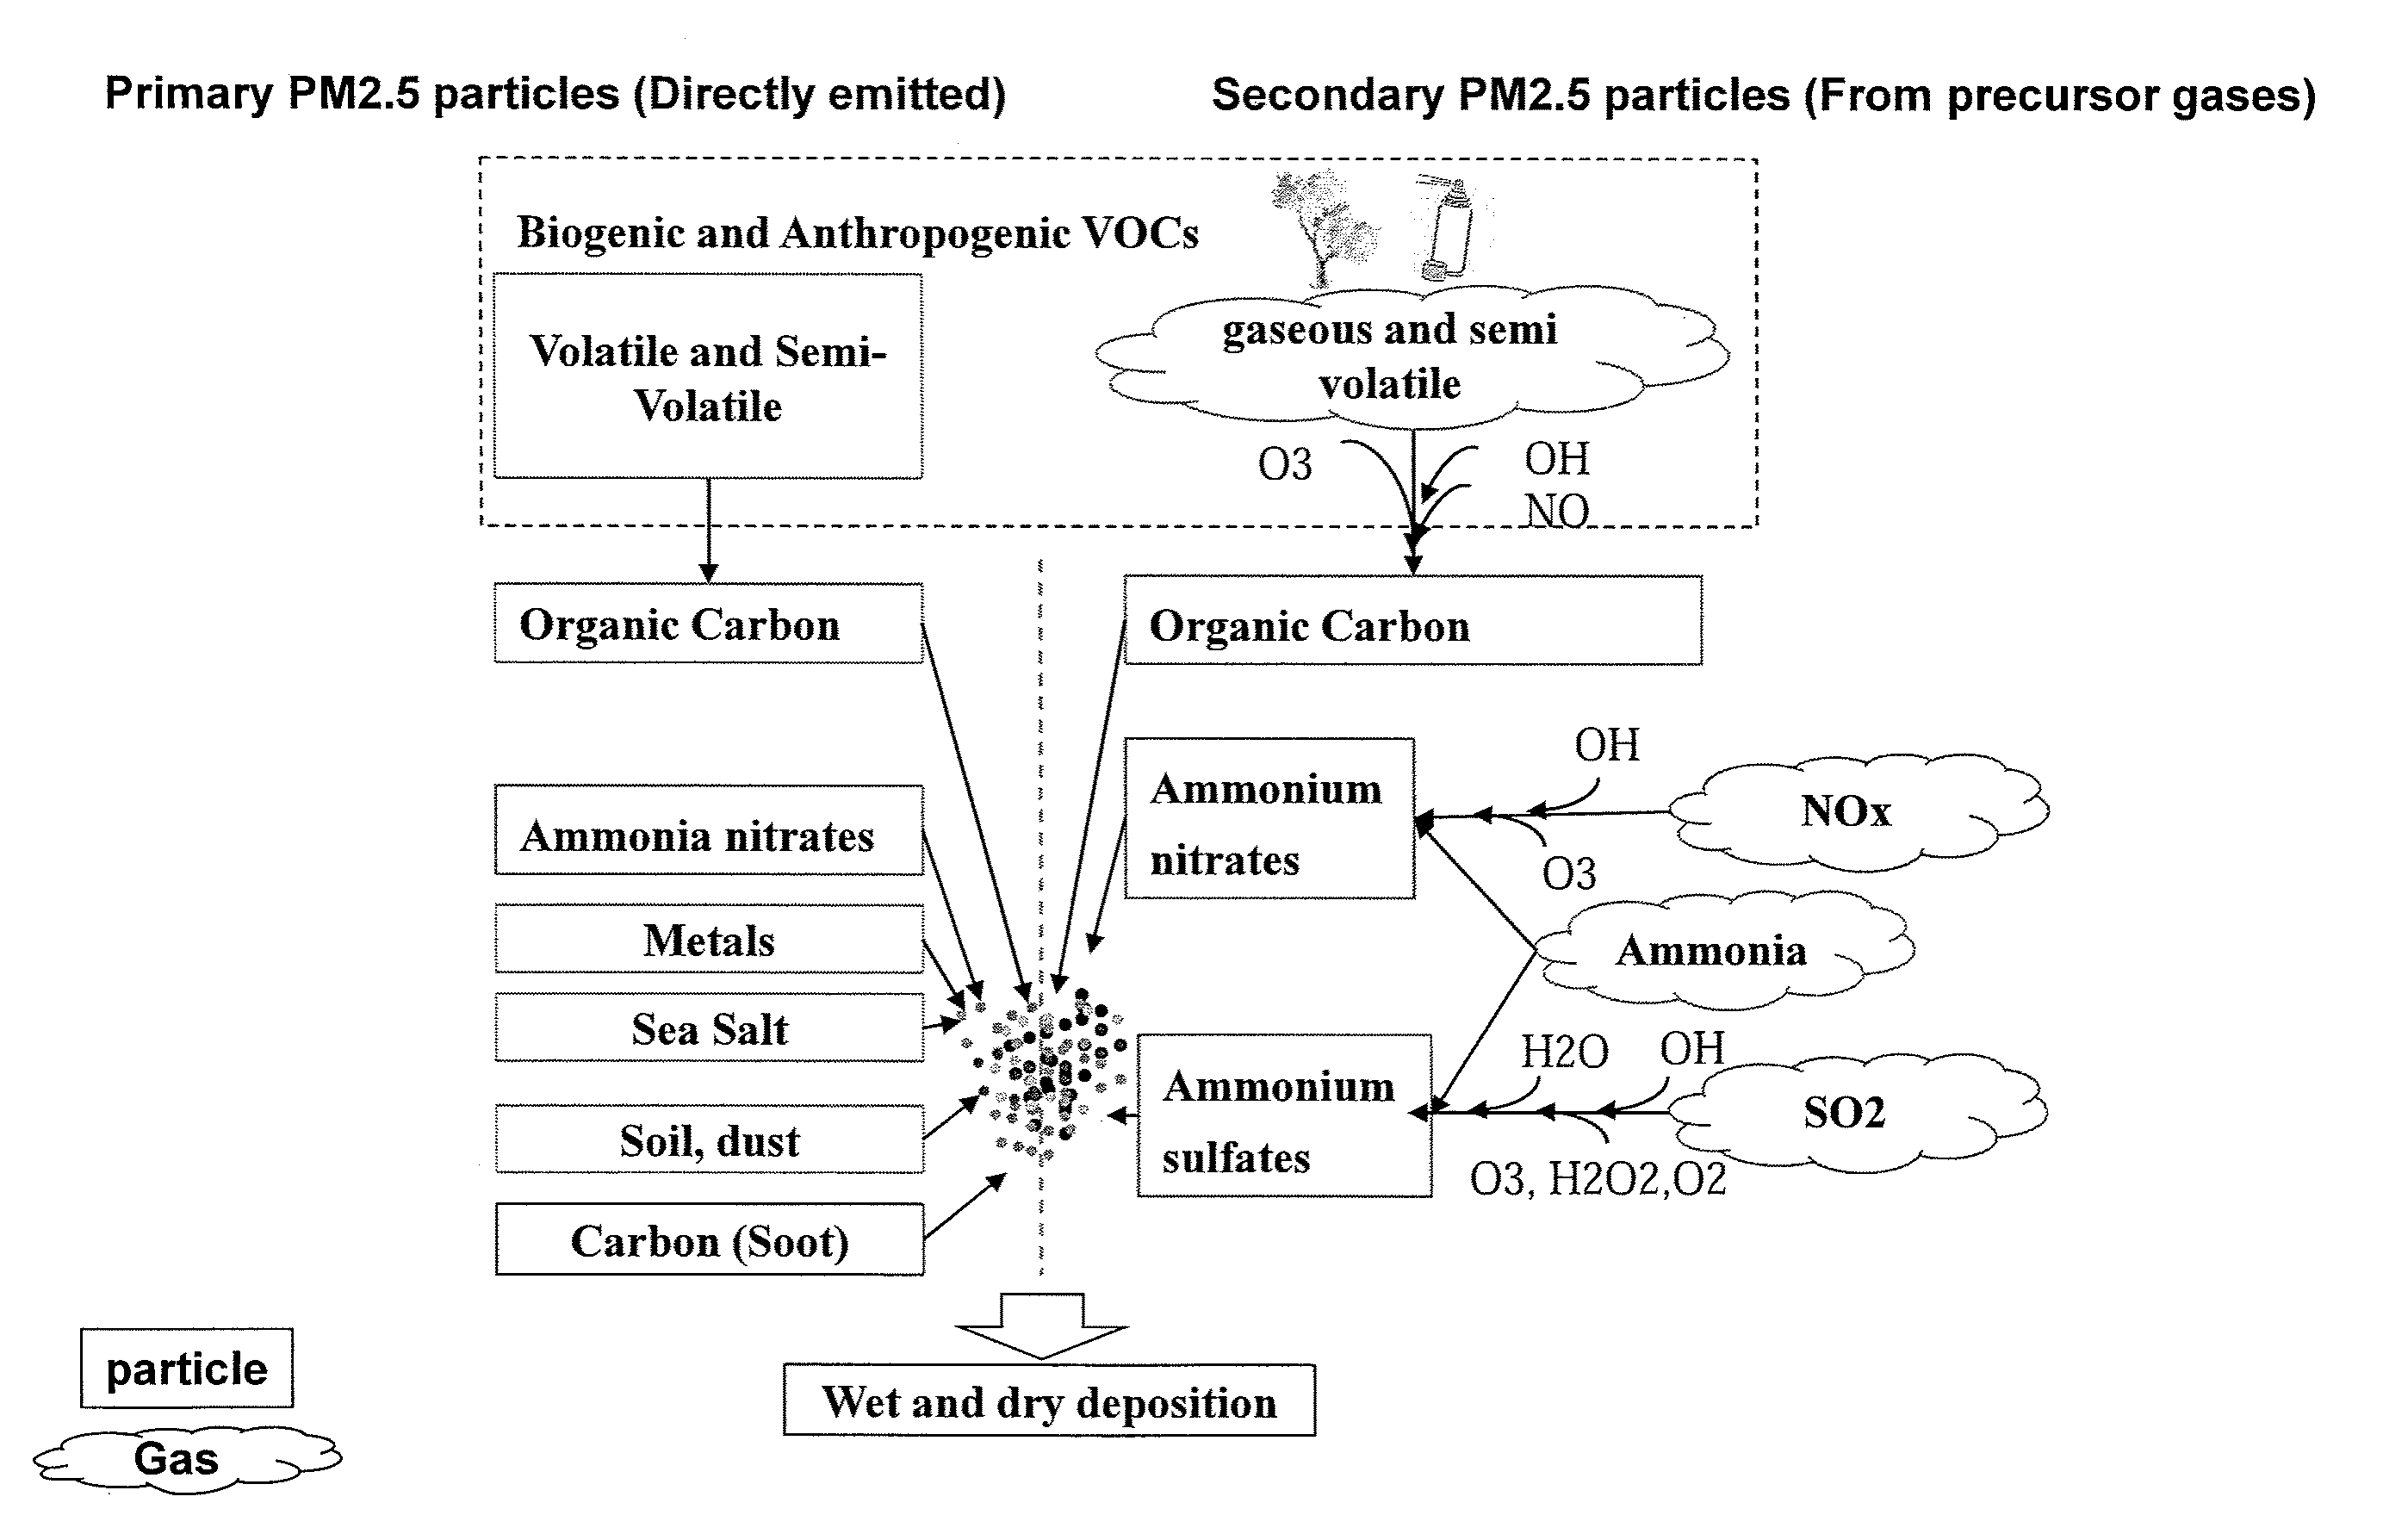
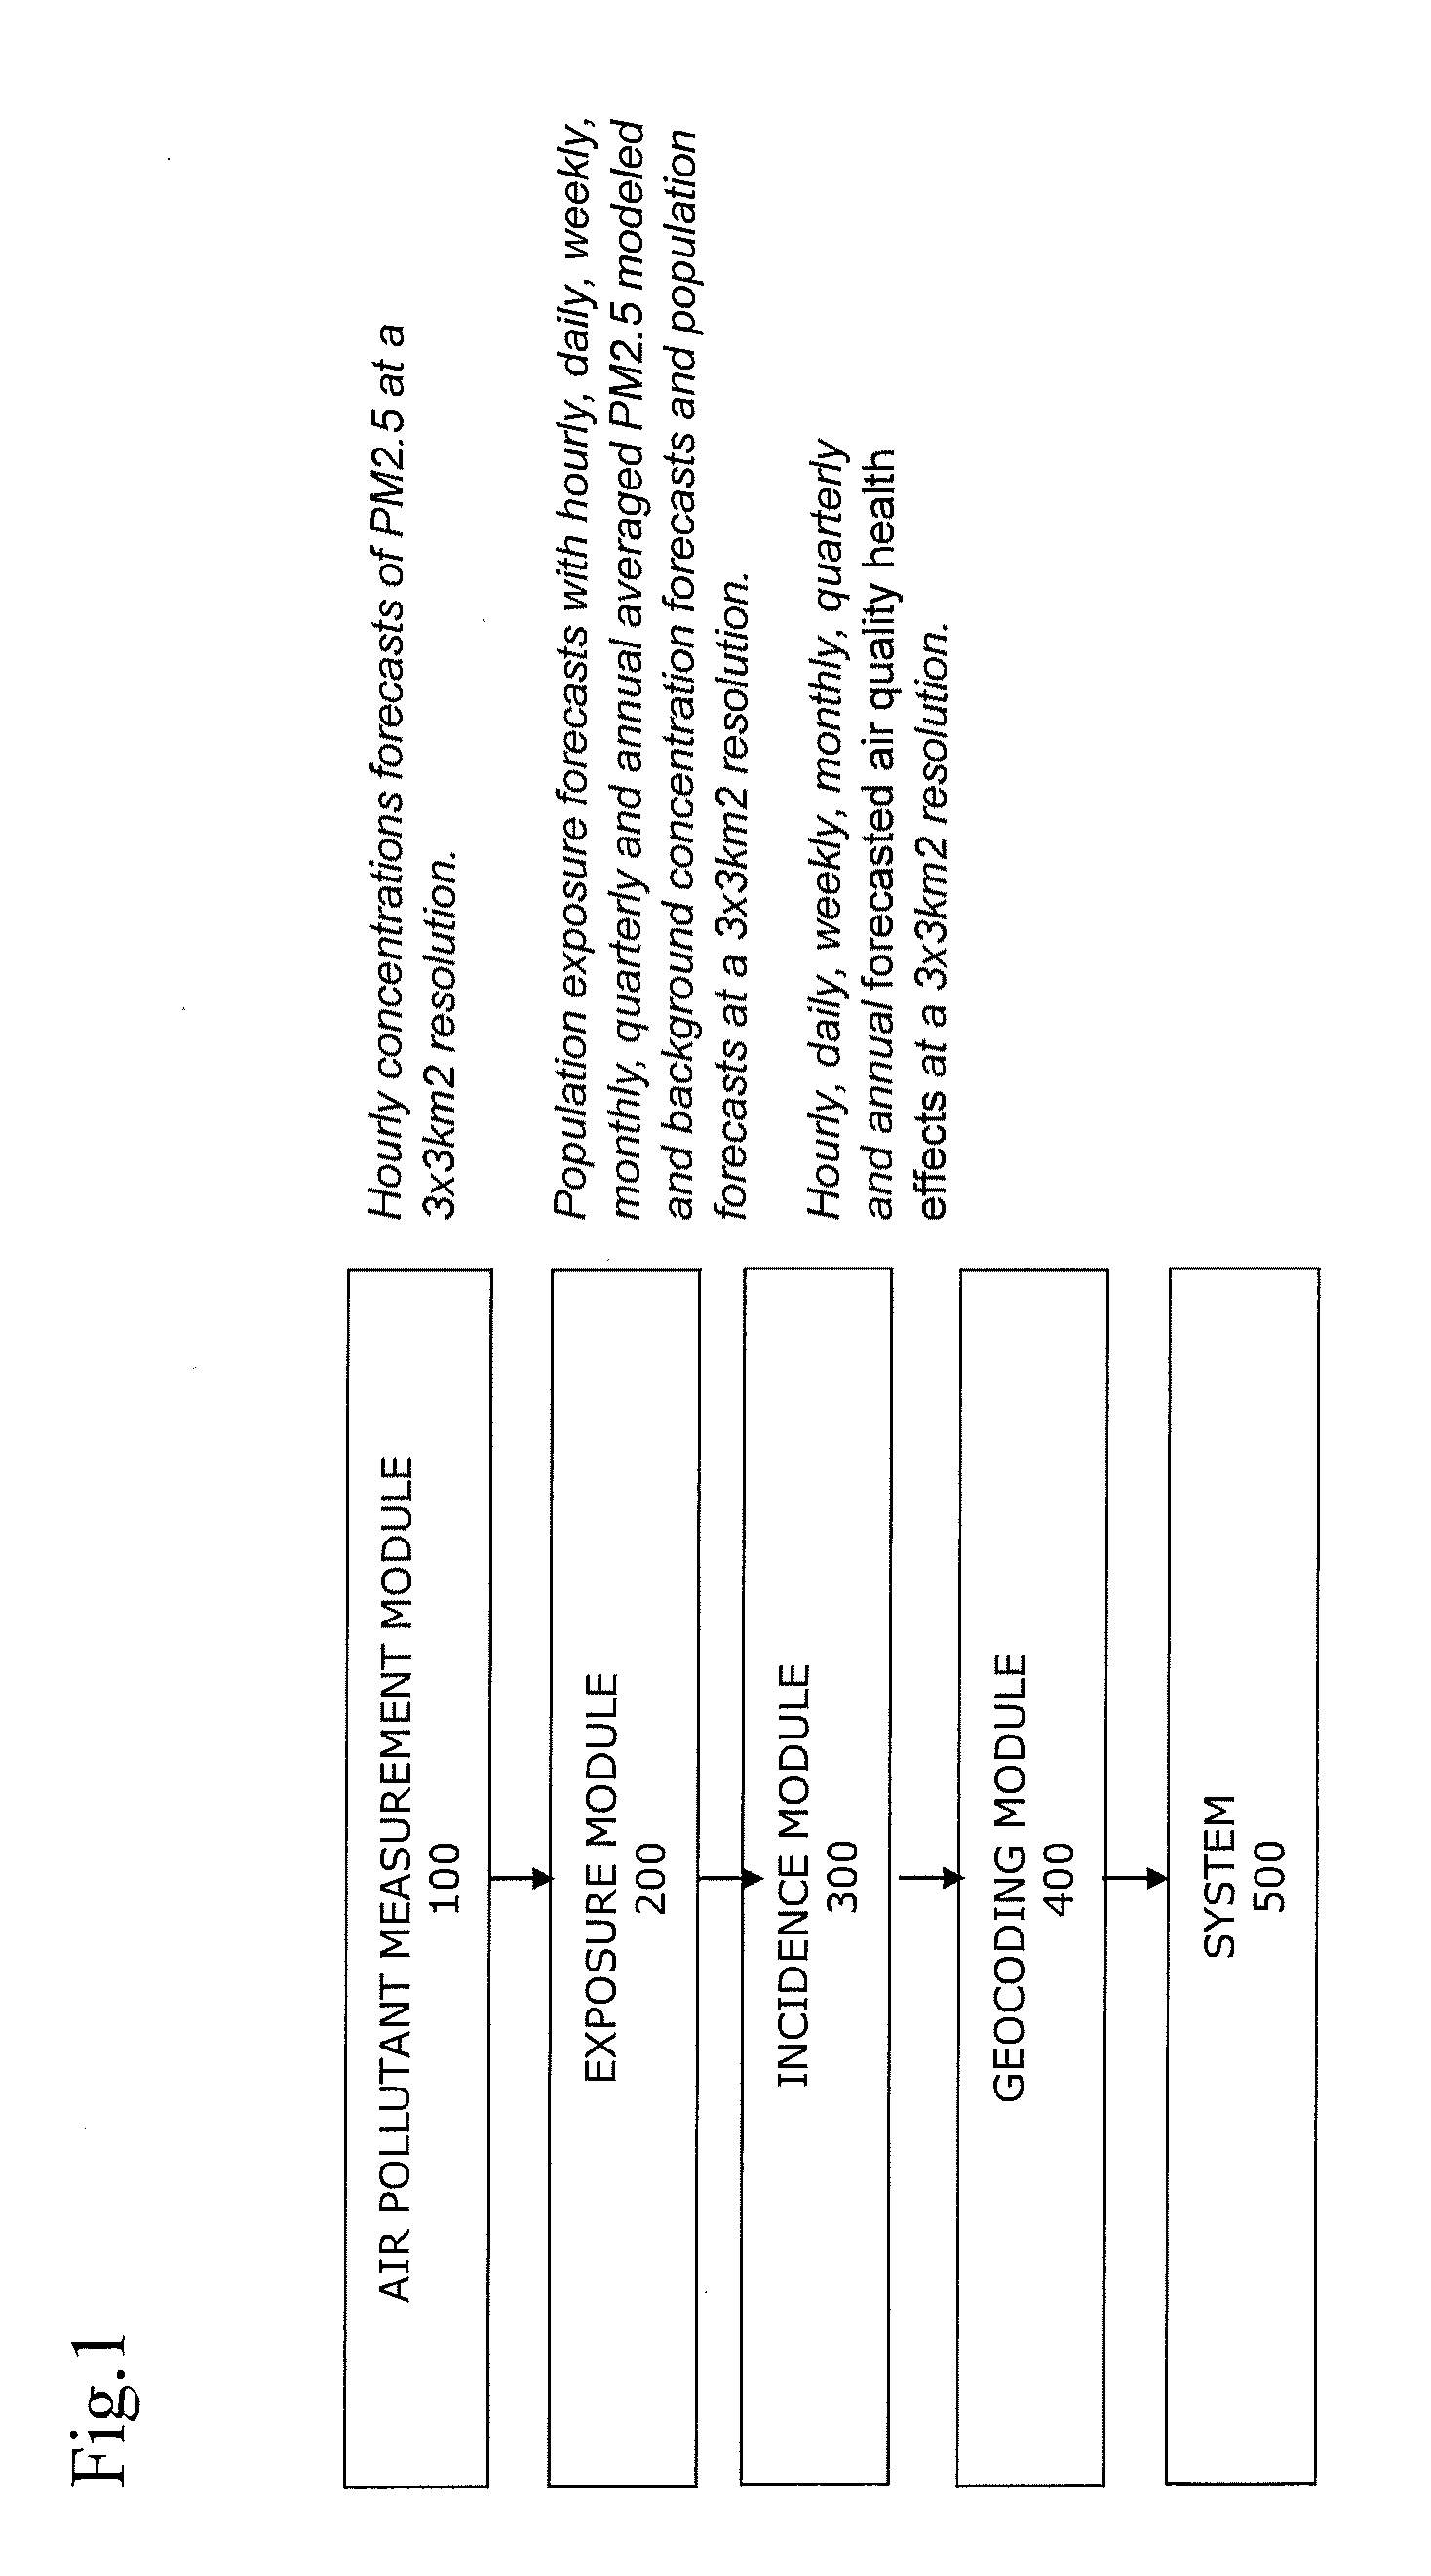
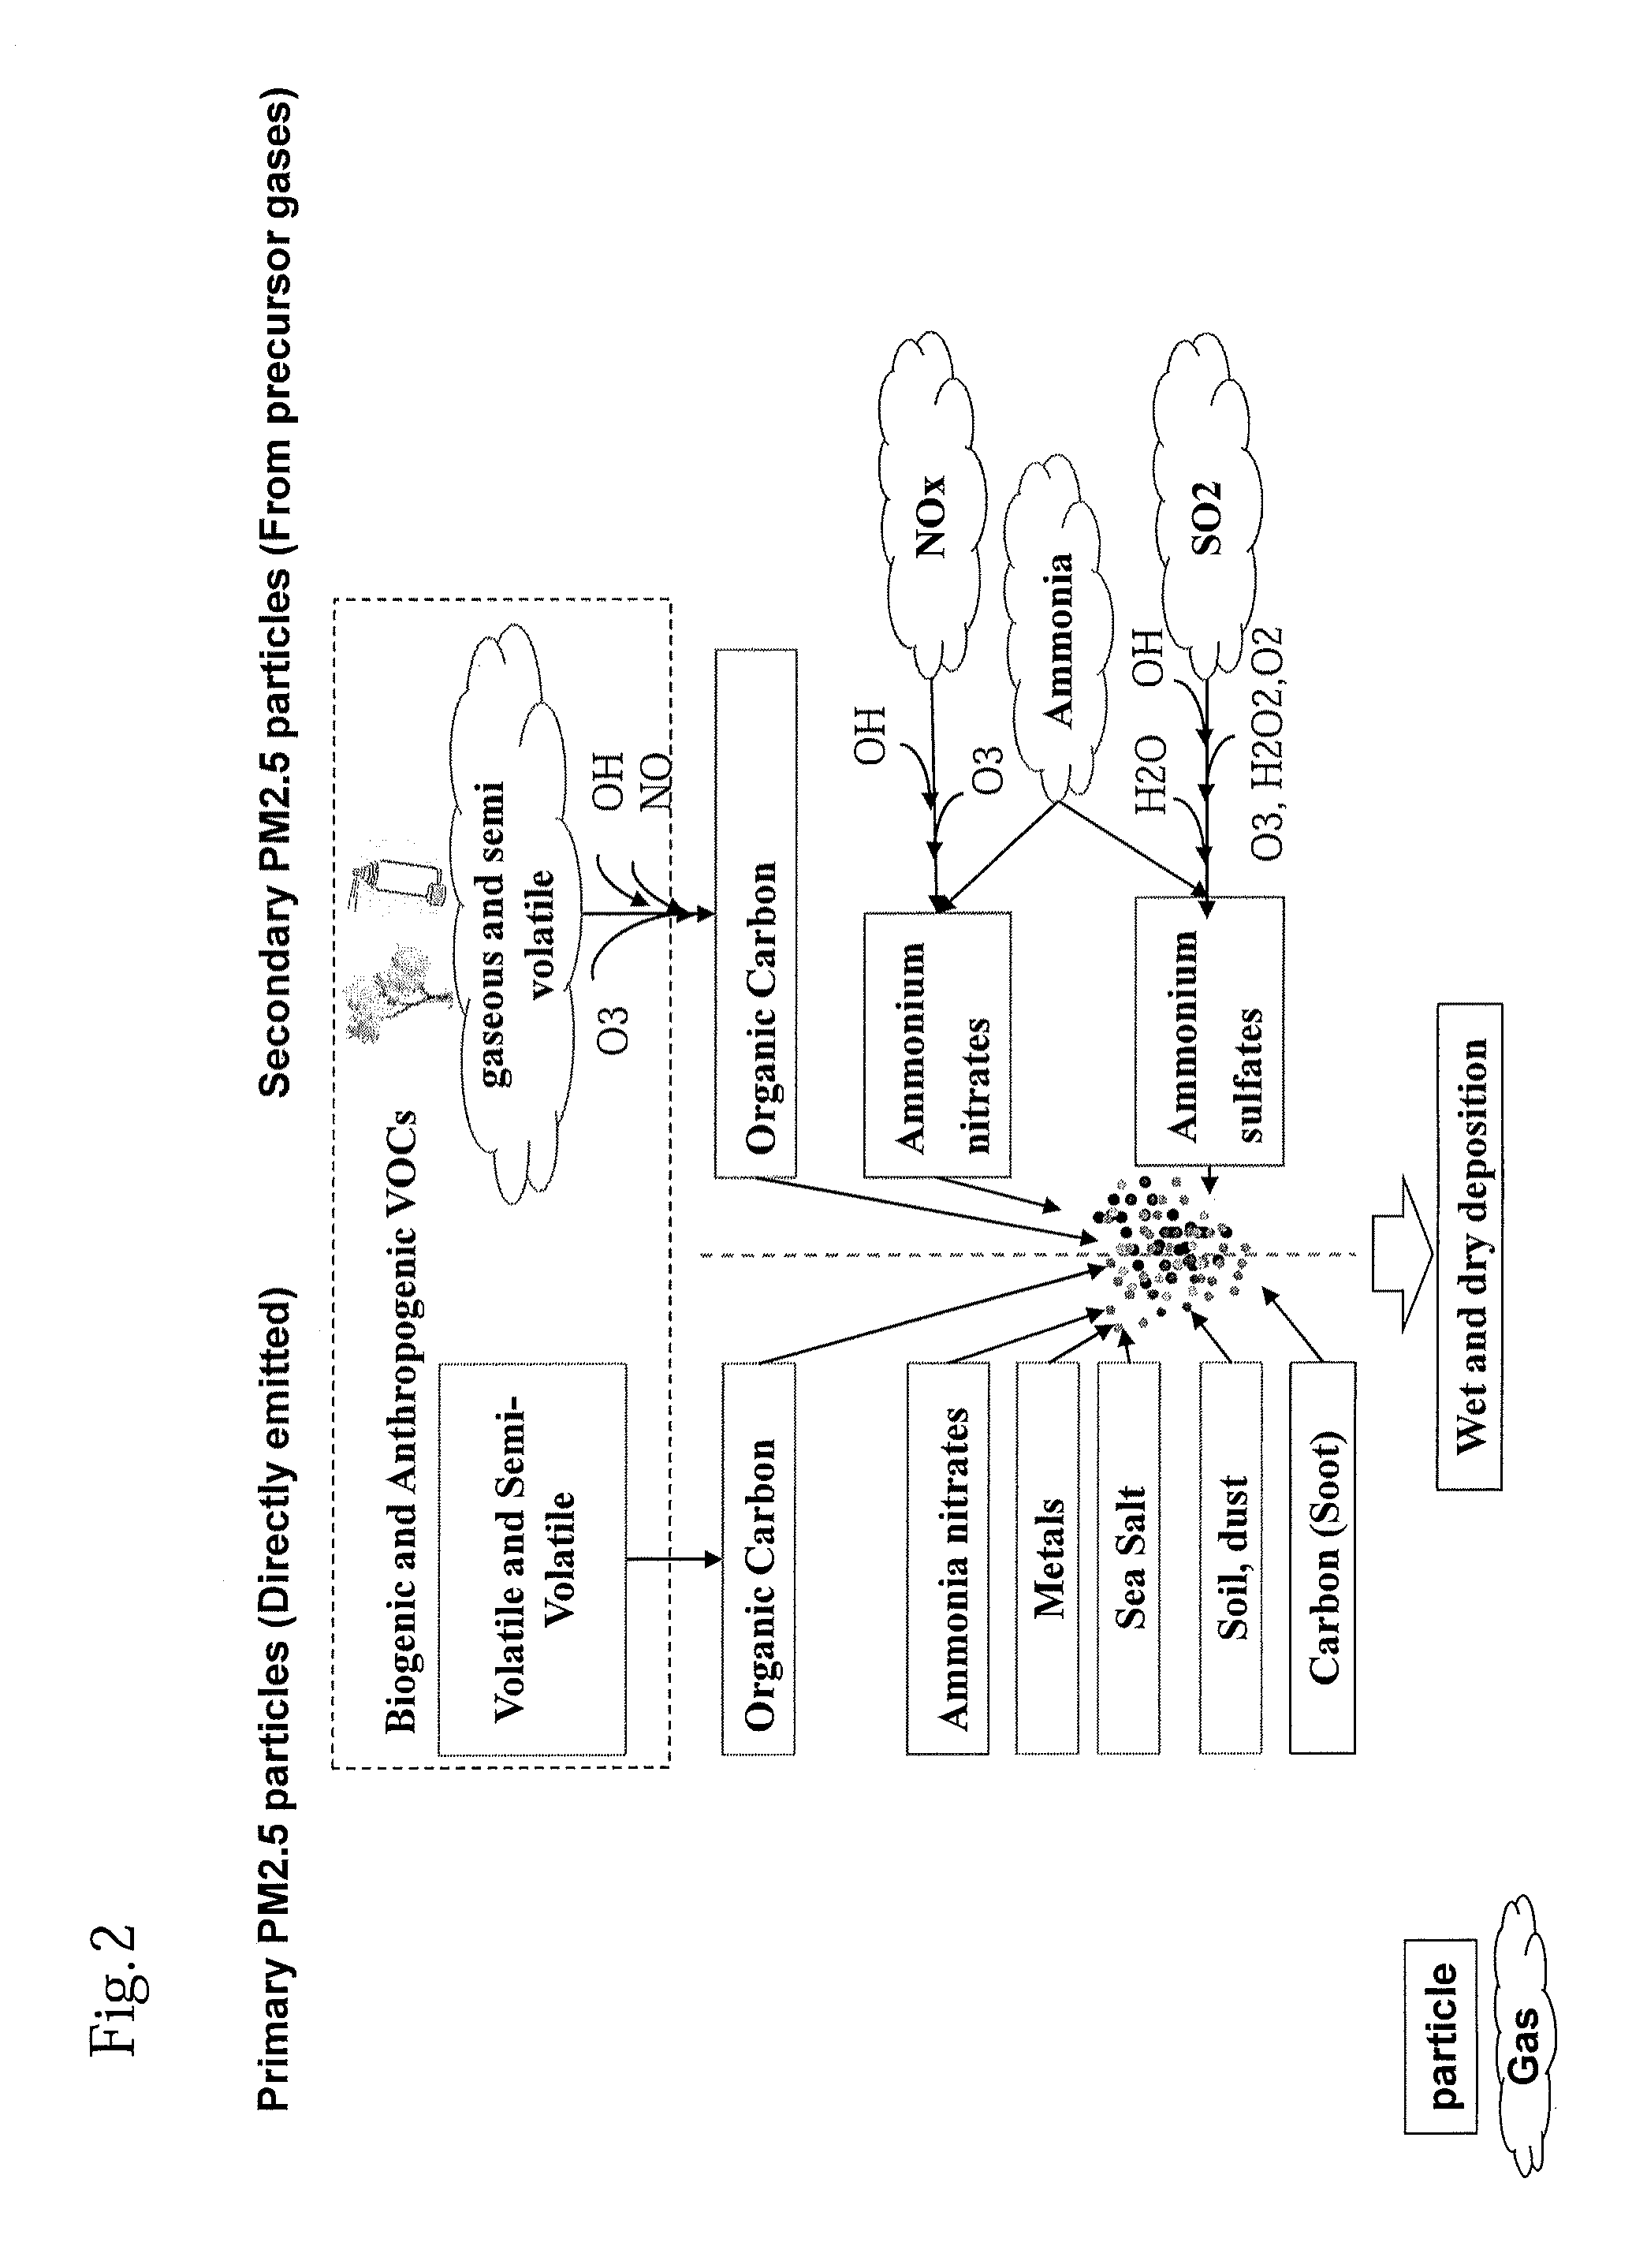
[0089]FIG. 1 presents, in a general manner, the different steps of the method according to the invention. The invention concerns a method and an accurate system to prevent health effects of an air pollutant in a determined geographical area, in particular in an area of which the surface is between 1 km2 and 10,000 km2. The method is initially presented for asthma and fine particles PM2.5 on the United States and the same process is used for the other health effects, air pollutants and geographies.

[0090]I. Asthma

[0091]1. Air Pollutant Measurement Module

[0092]Since greenhouse gases are air pollutants, the method described in US 2013 / 01790178 A1 is applied to the air pollutant measurement module (block 100) to accurately measure the hourly concentrations of fine particles PM2.5 on a predetermined geographical area from 1 km2 to 10,000 km2. For any other pollutants, the same method is used. These pollutants preferably include halogen compounds such as fluorine (F), chlorine (Cl), bromin...


PUM

PropertyMeasurementUnit
geographical areaaaaaaaaaaa
diameteraaaaaaaaaa

Abstract

A method for hourly, daily, weekly, monthly, quarterly and annual forecasted air quality health effects caused by air pollutants generated over a determined geographical area and a system implementing the method.

Description

BACKGROUND OF THE INVENTION[0001]1. Field of the Invention[0002]The invention relates to processes for determining forecasted air quality health effects caused by air pollutants. The invention relates in particular to a method and a system for determining at least one forecasted air quality health effect caused in a determined geographical area by at least one air pollutant.[0003]2. Incorporation by Reference[0004]All patents, patent applications, documents and references mentioned herein are incorporated herein by reference and may be employed in the practice of the invention.[0005]3. Description of the Prior Art[0006]Air pollution can be described as a contamination of the atmosphere by gaseous, liquid or solid wastes or by-products that can endanger human health and welfare of plants and animals, attack materials, reduce visibility, or produce undesirable odors. Greenhouse gases are air pollutants given their damaging effects on public health, welfare and the environment. An air ...

Claims


Application Information

Patent Timeline
Patent Type & Authority Applications(United States)
IPC IPC(8): G01N33/00G01W1/10
CPCG01W1/10G01N33/0036
Inventor GRIFFON, TANGUY
Owner GRIFFON TANGUY
Why Eureka
Try Eureka