Value Document and Method for Checking the Presence of the Same
a value document and document technology, applied in the field of value documents, to achieve the effect of reducing the scattering of data points
- Summary
- Abstract
- Description
- Claims
- Application Information
AI Technical Summary
Benefits of technology
Problems solved by technology
Method used
Image
Examples
application example 1
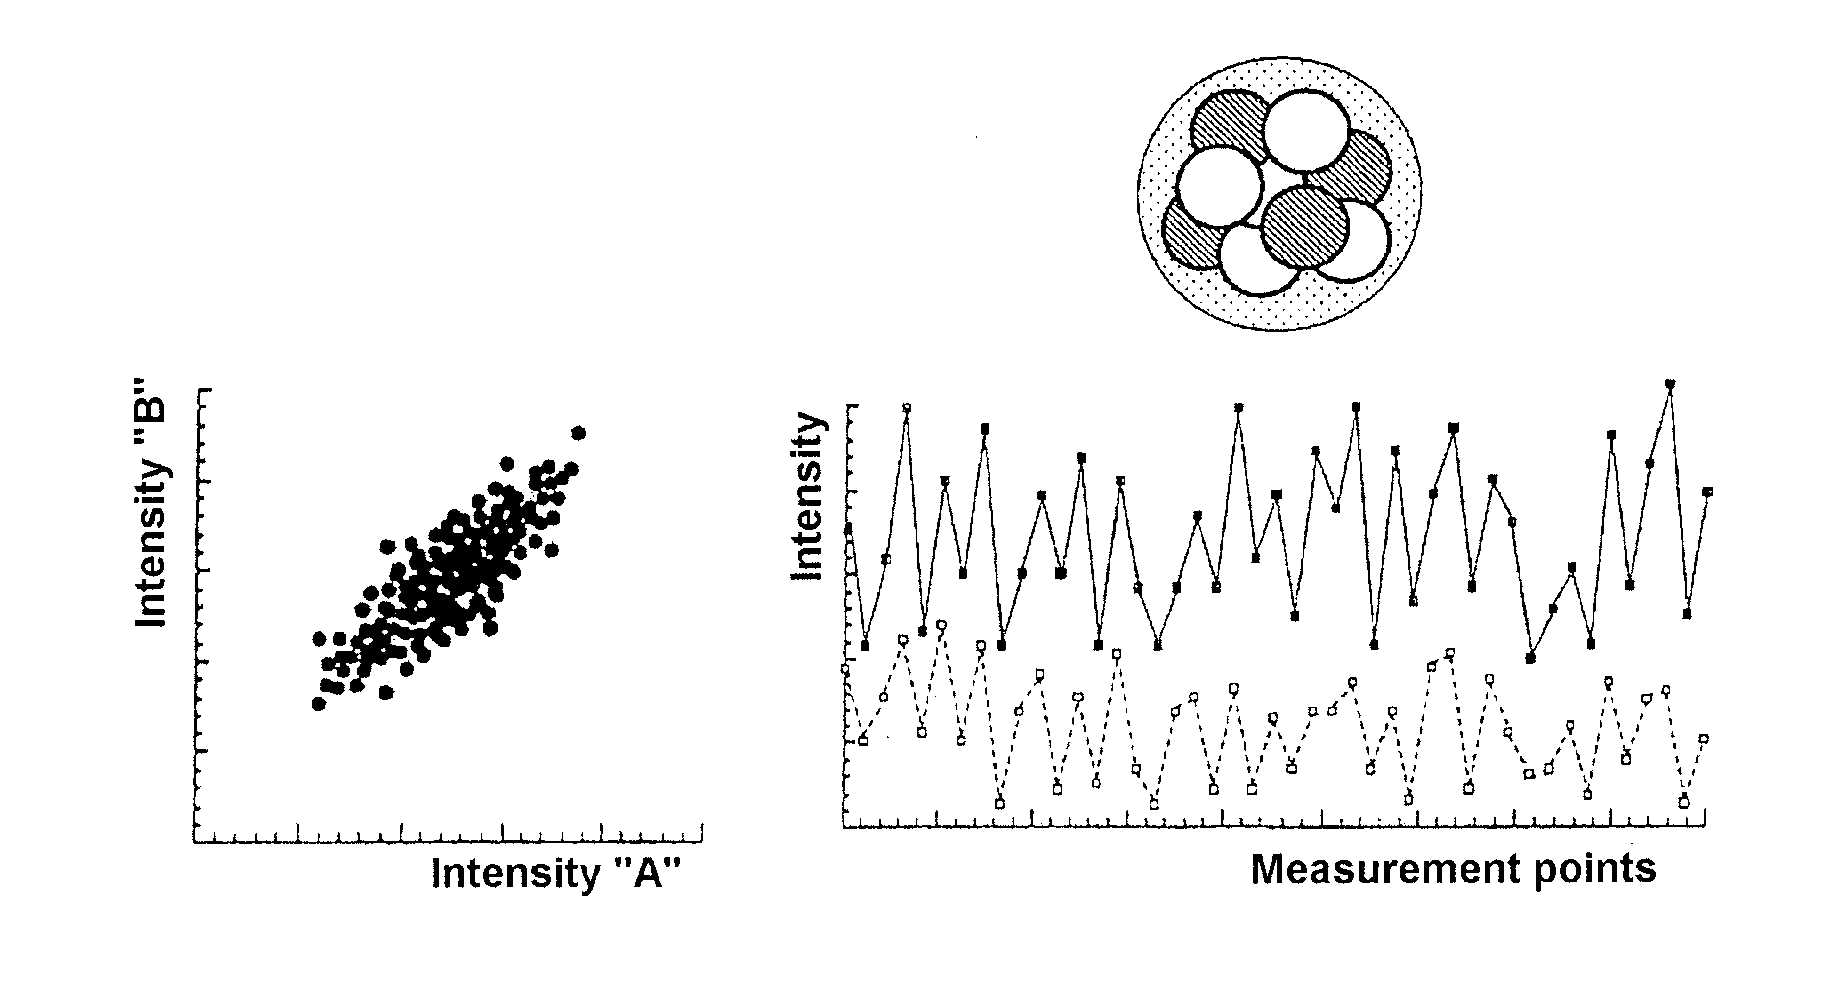
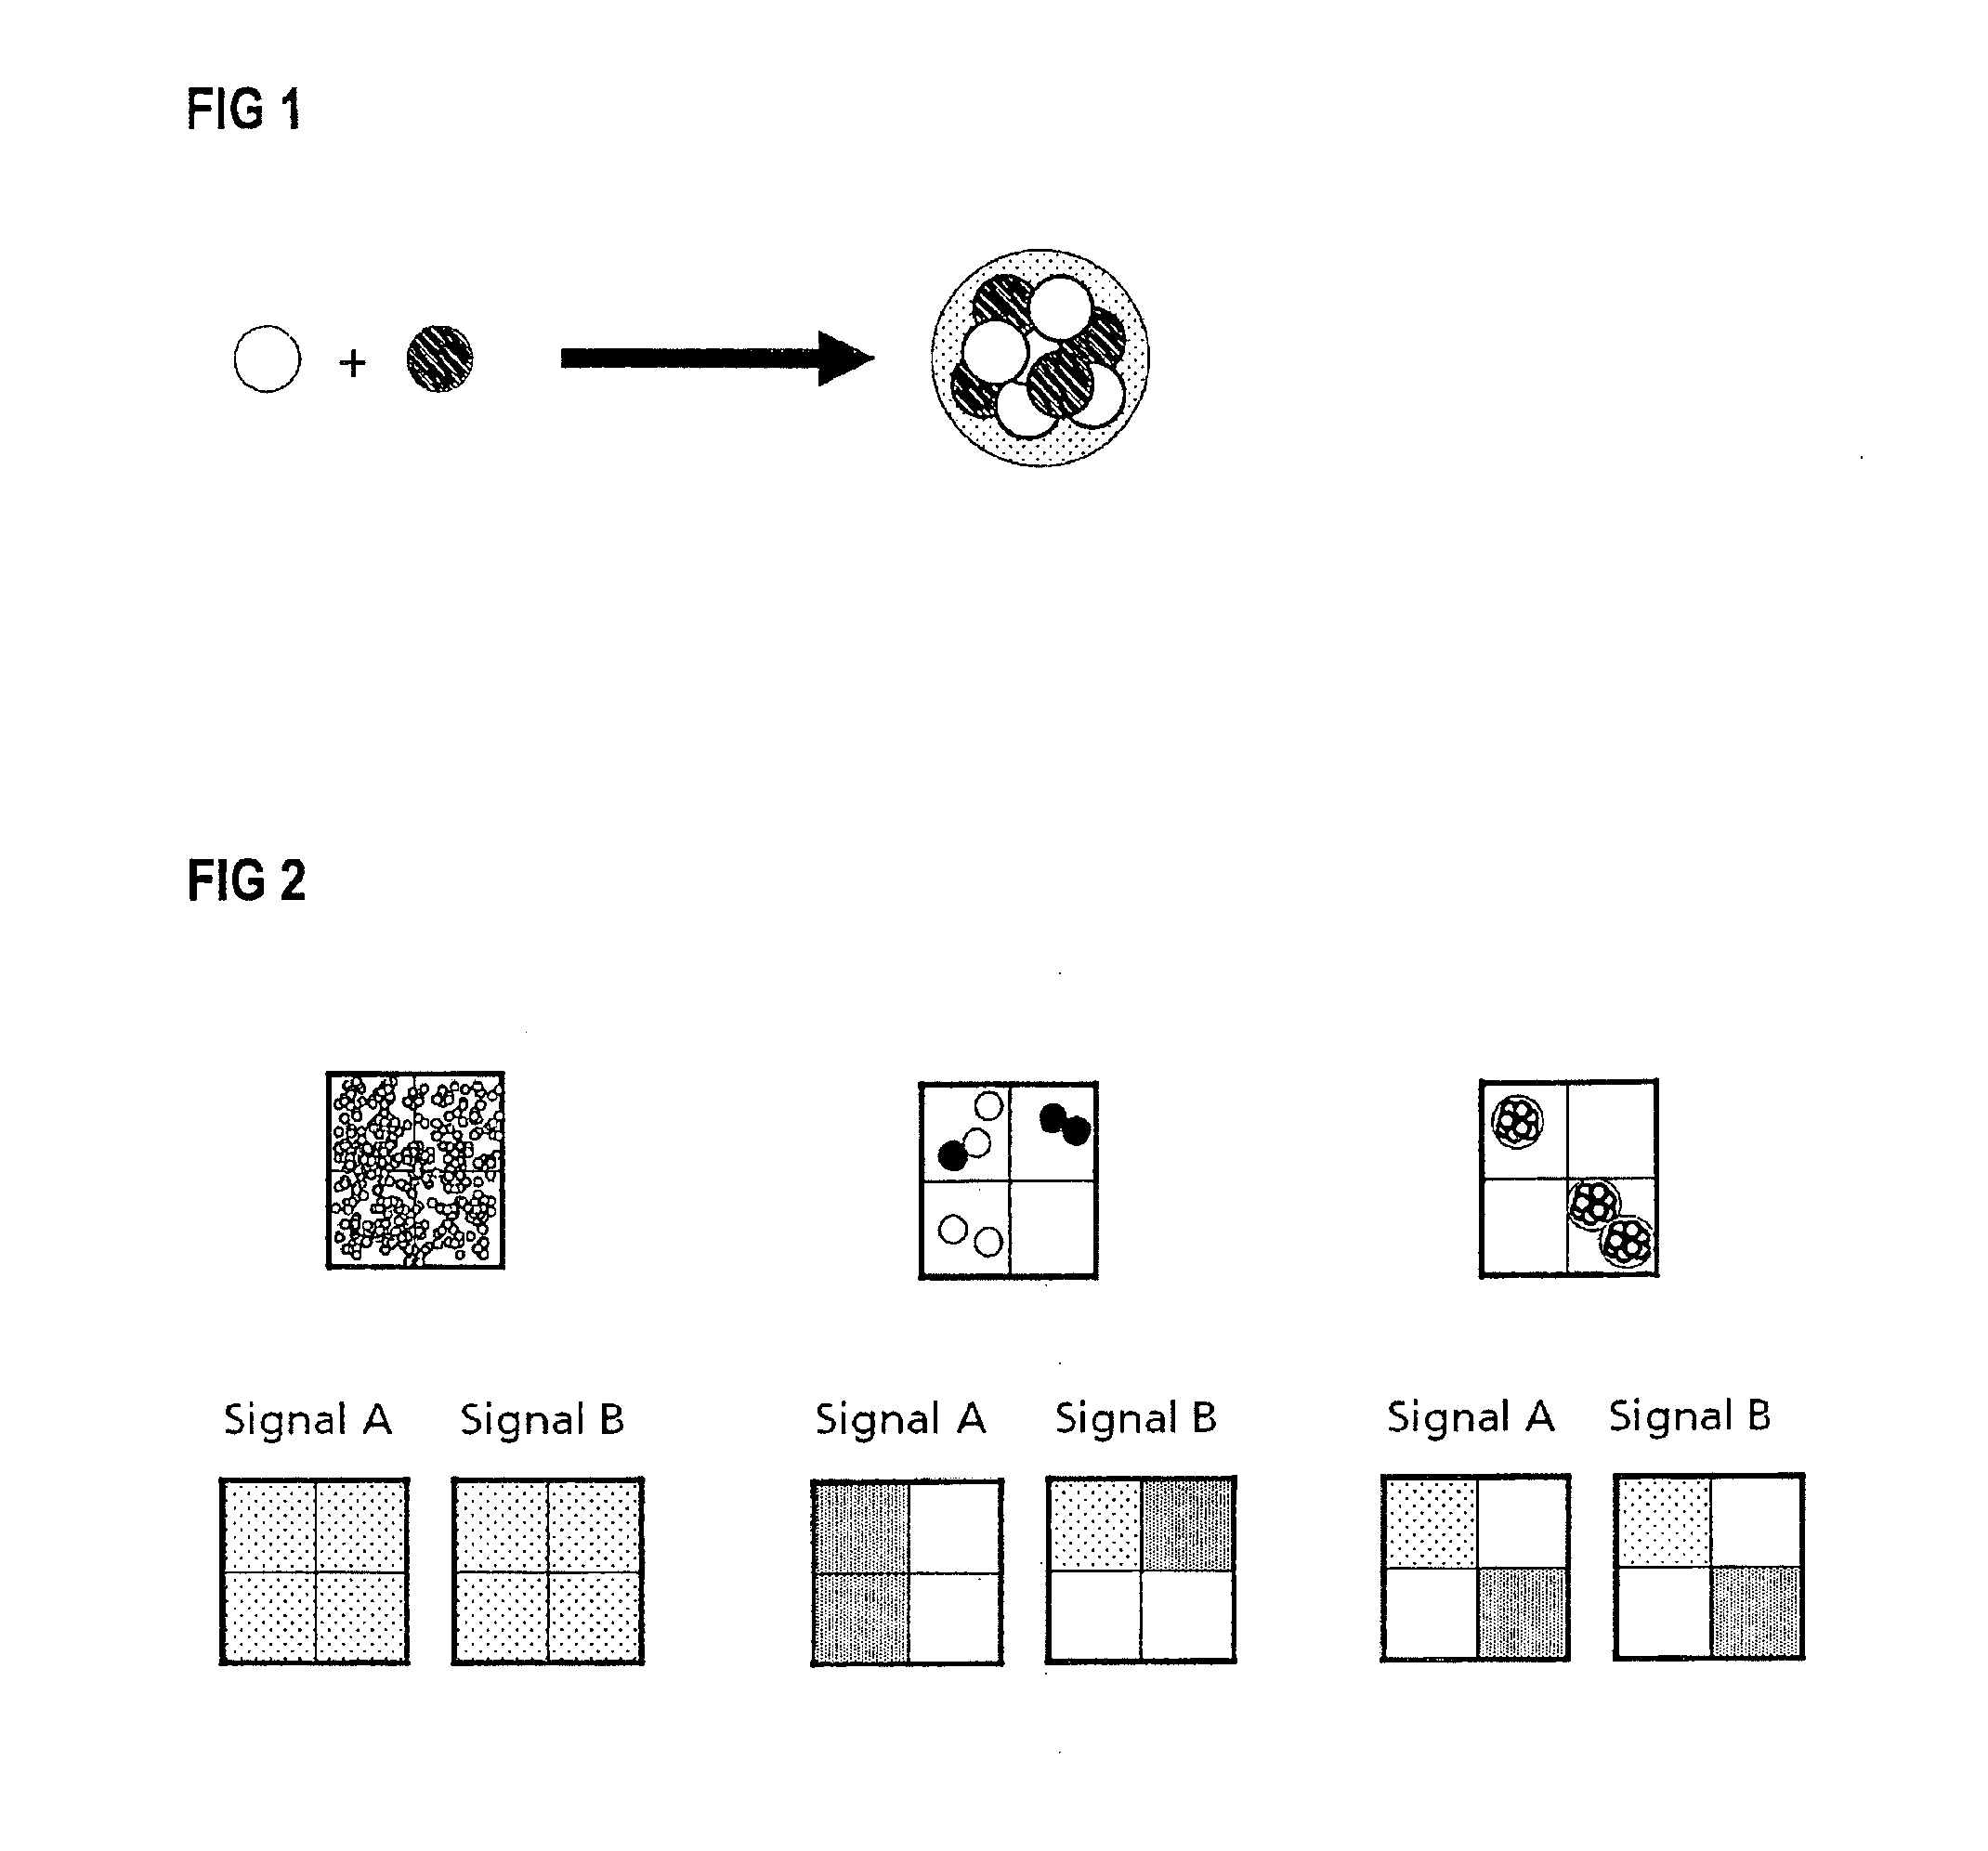
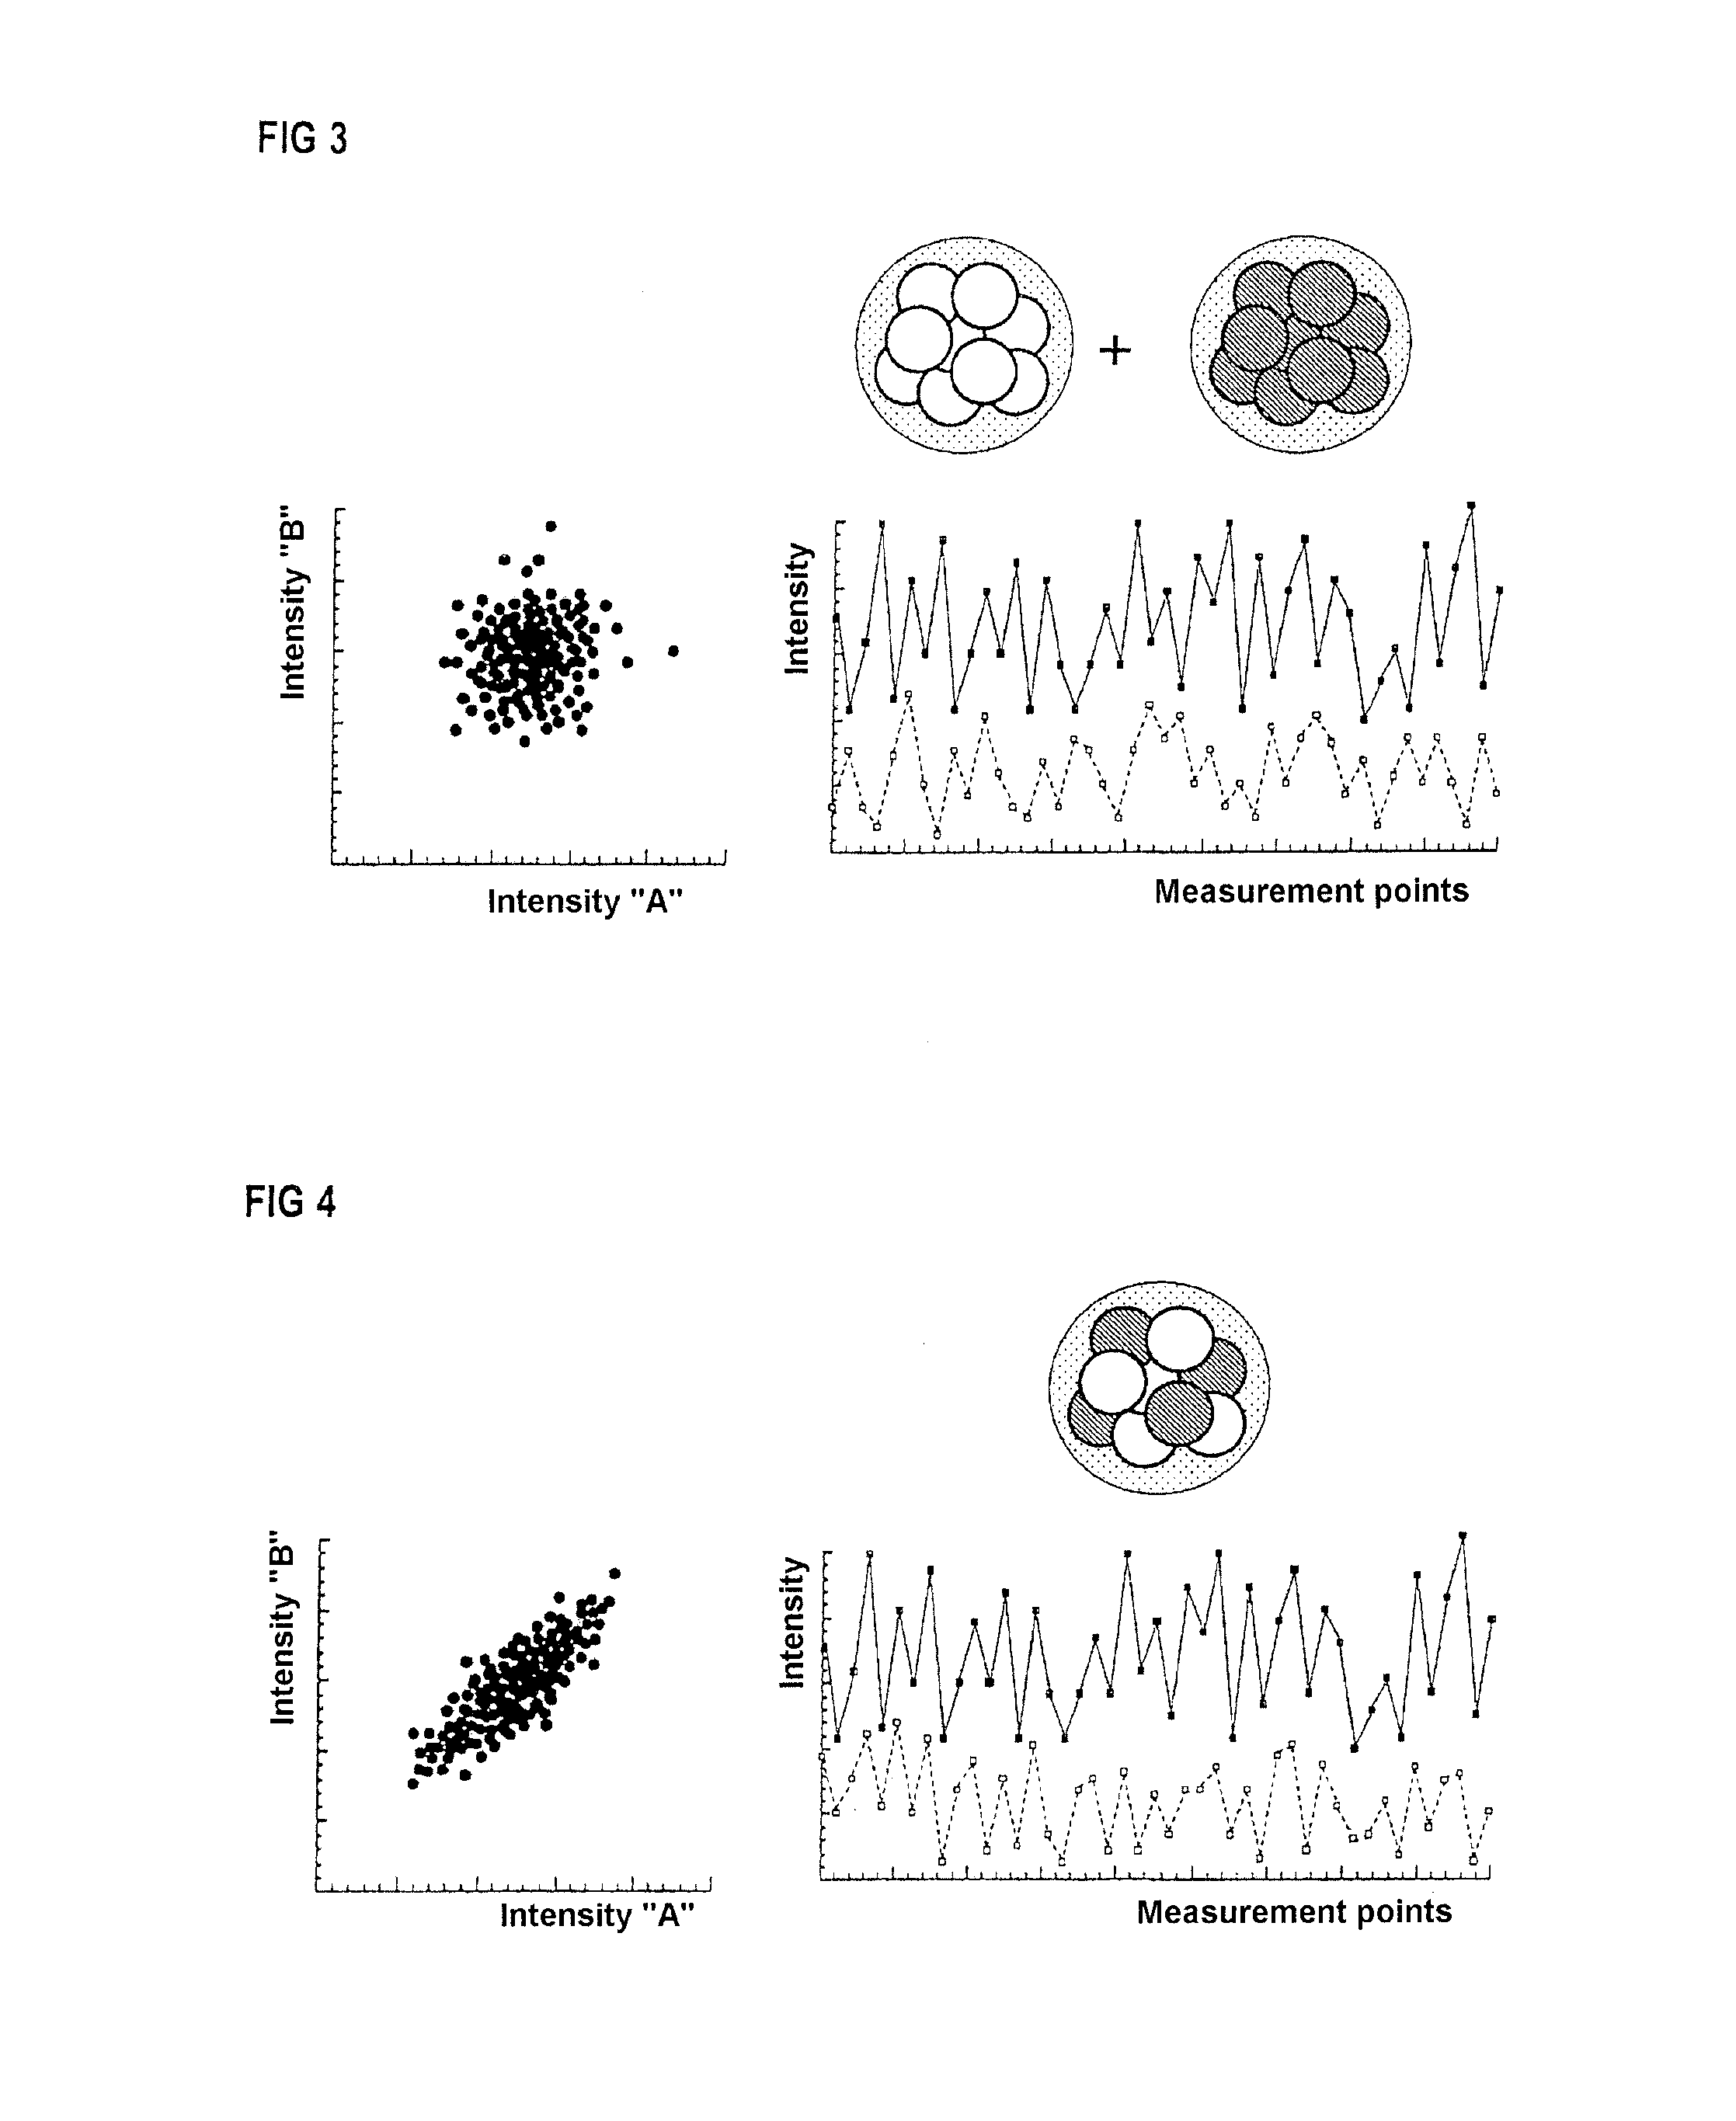
[0058]Mixed agglomerates of a luminescent feature substance “A” and a non-luminescent feature substance “B” were manufactured. For comparison, the agglomerates “only A” and the agglomerates “only B” were manufactured. Then a paper sheet with 2 wt. ‰ of the mixed agglomerates of “A” and “B” was prepared in a sheet former. Furthermore, a paper sheet with a mixture of 1 wt. ‰“only A” and 1 wt. ‰“only B” was prepared. Spectral or spectroscopic examination yields that the signals of substance “A” and substance “B” are respectively recognizable with comparable intensity in both sheets. A conventional sensor checking e.g. the signal wavelengths and signal intensities would thus ascertain no difference between the two sheets and recognize both as “identical” or “authentic”. However, additionally heeding the mutual correlation of the two signals of “A” and “B” one can recognize distinct differences between the sheets. For this purpose, the sheets were measured on an apparatus that automatica...
example 1
[0074]The following correlation function:
Kor(X,Y)=Cov(X,Y)σX·σY=1n∑i=1n(xi-μx)·(yi-μr)σX·σY
[0075]It provides a positive contribution when two data points of a row are simultaneously located above or below the respective average thereof, i.e. two “high” or two “low” signal intensities of “A” and “B” are located at the same location.
[0076]According to one embodiment, for rating the authenticity of a value document the above correlation function can be computed for the obtained measurement values and its amount compared with a threshold value. In particular, an existing statistical correlation and thus authenticity is recognized when the amount is >0.3, preferably >0.5, and particularly preferably >0.7.
example 2
[0077]Method having a plurality of steps, with the aim of evaluating the length-to-width ratio of the point clouds obtained from the measuring data (see FIG. 5). To minimize the influence of “outliers”, 25% of the highest and lowest signal values were ignored, respectively. Correlating point clouds are elongated and possess a very pronounced length-to-width ratio, while non-correlating point clouds have a length and width that are about equally great.
[0078]According to one embodiment, for rating the authenticity of a value document one can proceed as follows: In a first step, the measuring data of the spectroscopic method as well as the measuring data of the luminescence intensities at the certain emission wavelength are obtained. In a second step, the measuring data are normalized. In a third step, there is performed a transformation of the axes of coordinates, preferably a rotation by 45°, in order to minimize the scattering of the data points along an axis of coordinates. In a fo...
PUM
| Property | Measurement | Unit |
|---|---|---|
| grain size D99 | aaaaa | aaaaa |
| grain size D99 | aaaaa | aaaaa |
| grain size D99 | aaaaa | aaaaa |
Abstract
Description
Claims
Application Information
 - R&D
- Intellectual Property
- Life Sciences
- Materials
- Tech Scout
- Unparalleled Data Quality
- Higher Quality Content
- 60% Fewer Hallucinations
Browse by: Latest US Patents, China's latest patents, Technical Efficacy Thesaurus, Application Domain, Technology Topic, Popular Technical Reports.
© 2025 PatSnap. All rights reserved.Legal|Privacy policy|Modern Slavery Act Transparency Statement|Sitemap|About US| Contact US: help@patsnap.com


