High sensitivity method for early lyme disease detection
a lyme disease and high-sensitivity technology, applied in the field of methods for detecting early lyme disease, can solve the problem of unsatisfactory sensitivity in patients with early ld (29%-40%)
- Summary
- Abstract
- Description
- Claims
- Application Information
AI Technical Summary
Benefits of technology
Problems solved by technology
Method used
Image

Examples
example 1
Clinical Samples
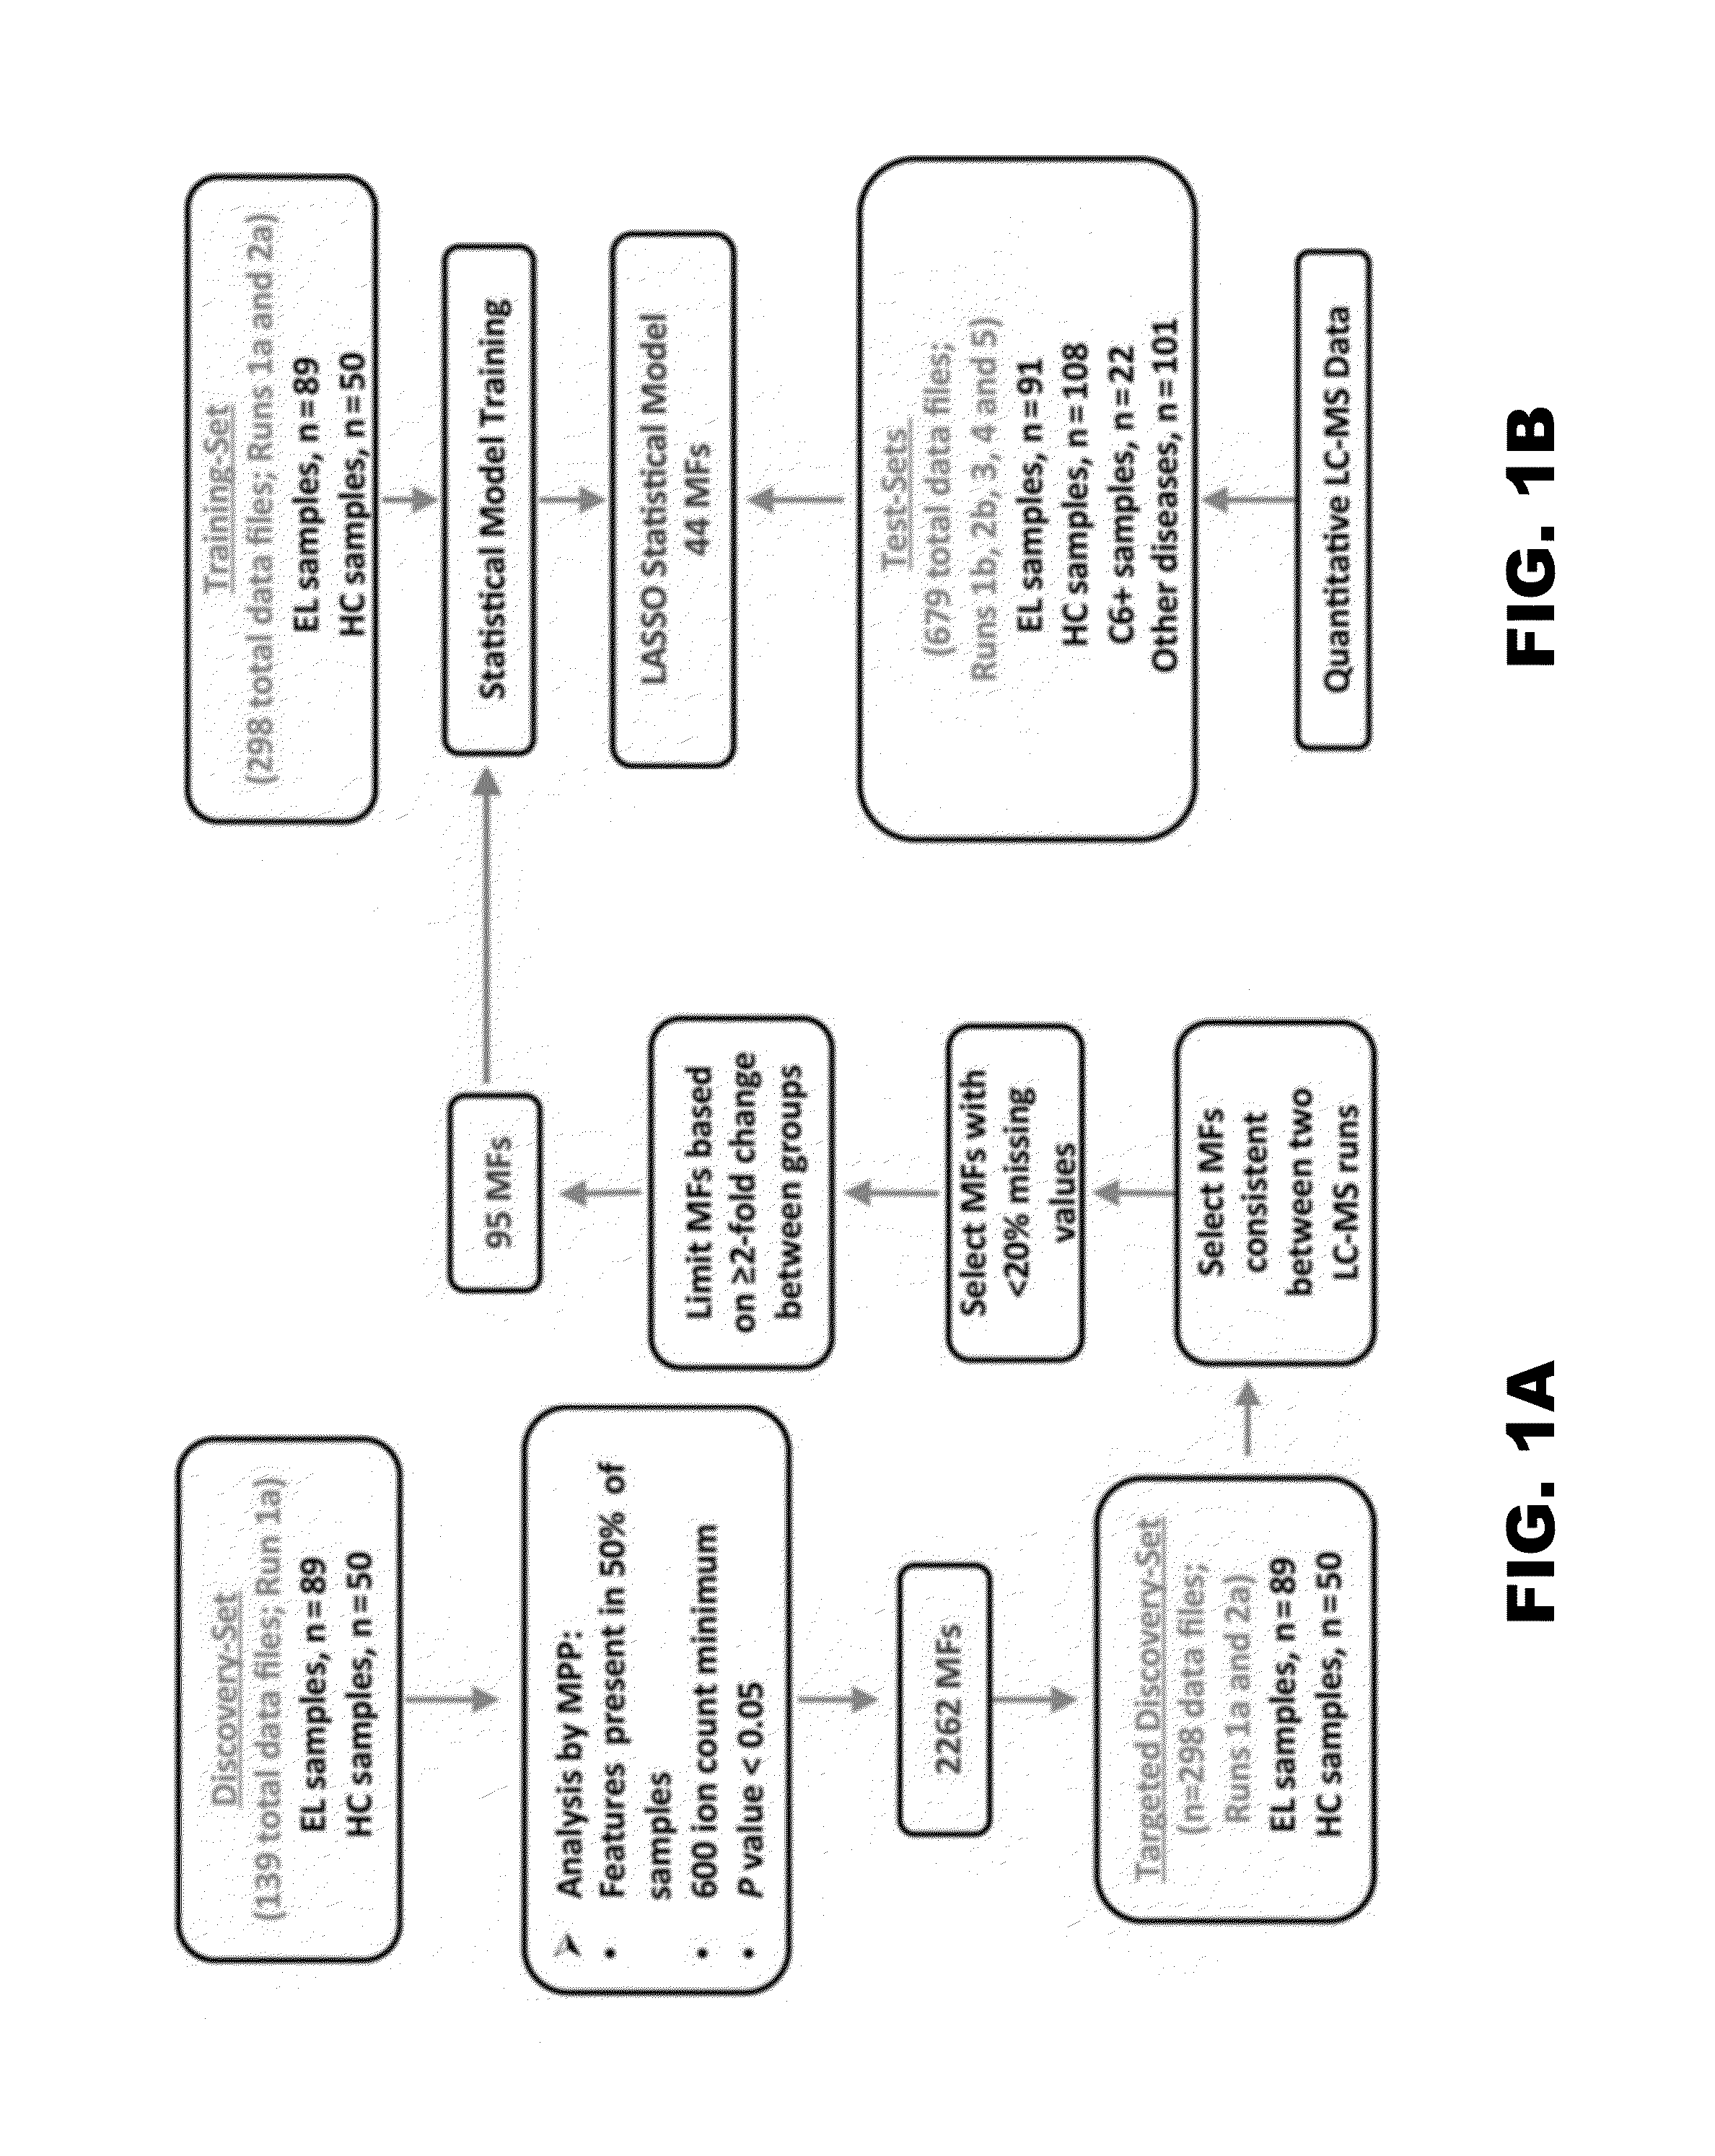
[0050]Well-characterized retrospective serum samples selected based on defined criteria (Table 1) were randomly divided into discovery- and test-sample sets to allow development and testing of an early LD metabolic biosignature (FIG. 1A, FIG. 1B). Additionally, a small set of sera from patients clinically diagnosed with early LD and positive by the C6 EIA was included as test-samples (Table 1 and FIG. 1B).
example 2
Biosignature Development
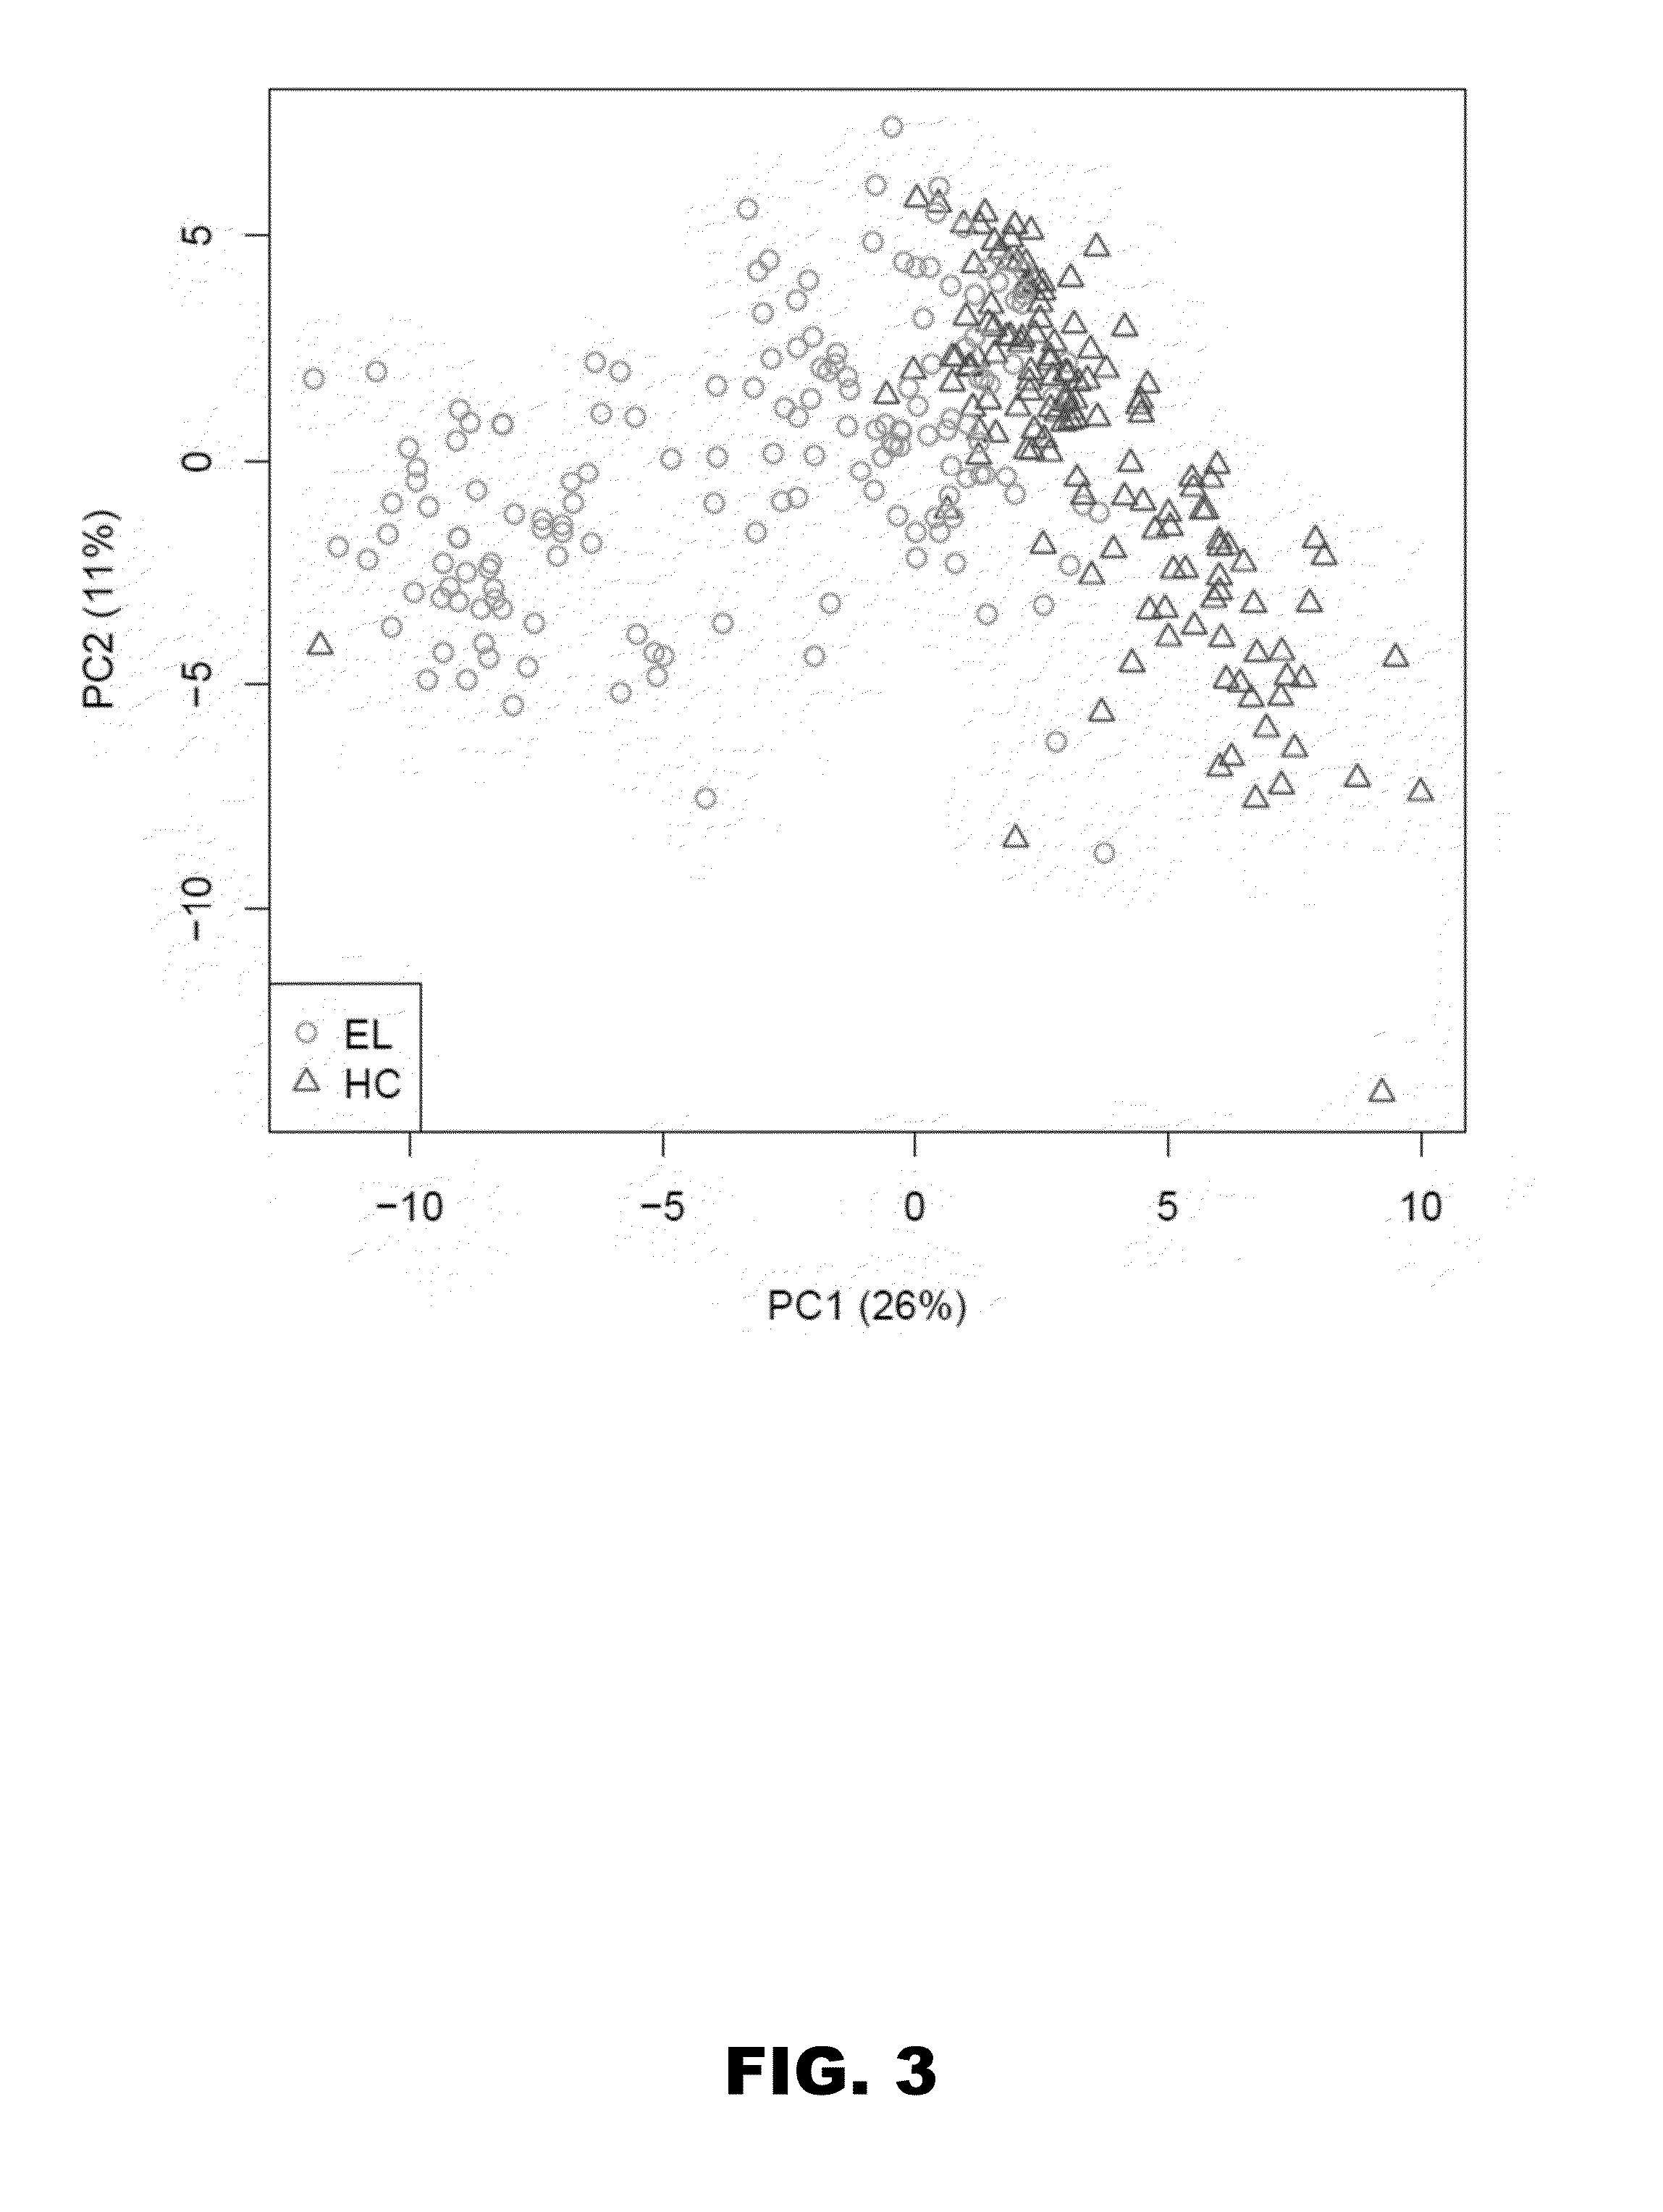
[0051]Although metabolomics studies performed by LC-MS yield abundance measurements of small molecule metabolites (ie, MFs), this technique when applied in a discovery phase is considered semiquantitative and can be influenced by run-to-run technical variances. Thus, to generate a biosignature that differentiated early LD from healthy controls, duplicate LC-MS analyses were performed with 139 patient sera comprising the discovery-samples. A group comparison of the first dataset (FIG. 1A) identified 2262 MFs that were present in at least 50% of either the LD or healthy control group samples, and that differed significantly in abundance between these 2 population groups (P<0.05). The data of the second LC-MS analysis of the discovery-samples were used to down-select the 2262 MFs based on LC-MS run consistency and increased stringency (FIG. 1A). This resulted in a biosignature of 95 MFs (FIG. 3 and Table 4) with 62 and 33 of the MFs increasing and decreasing in ...
example 3
Biosignature Testing and Comparison with 2-Tier Serology
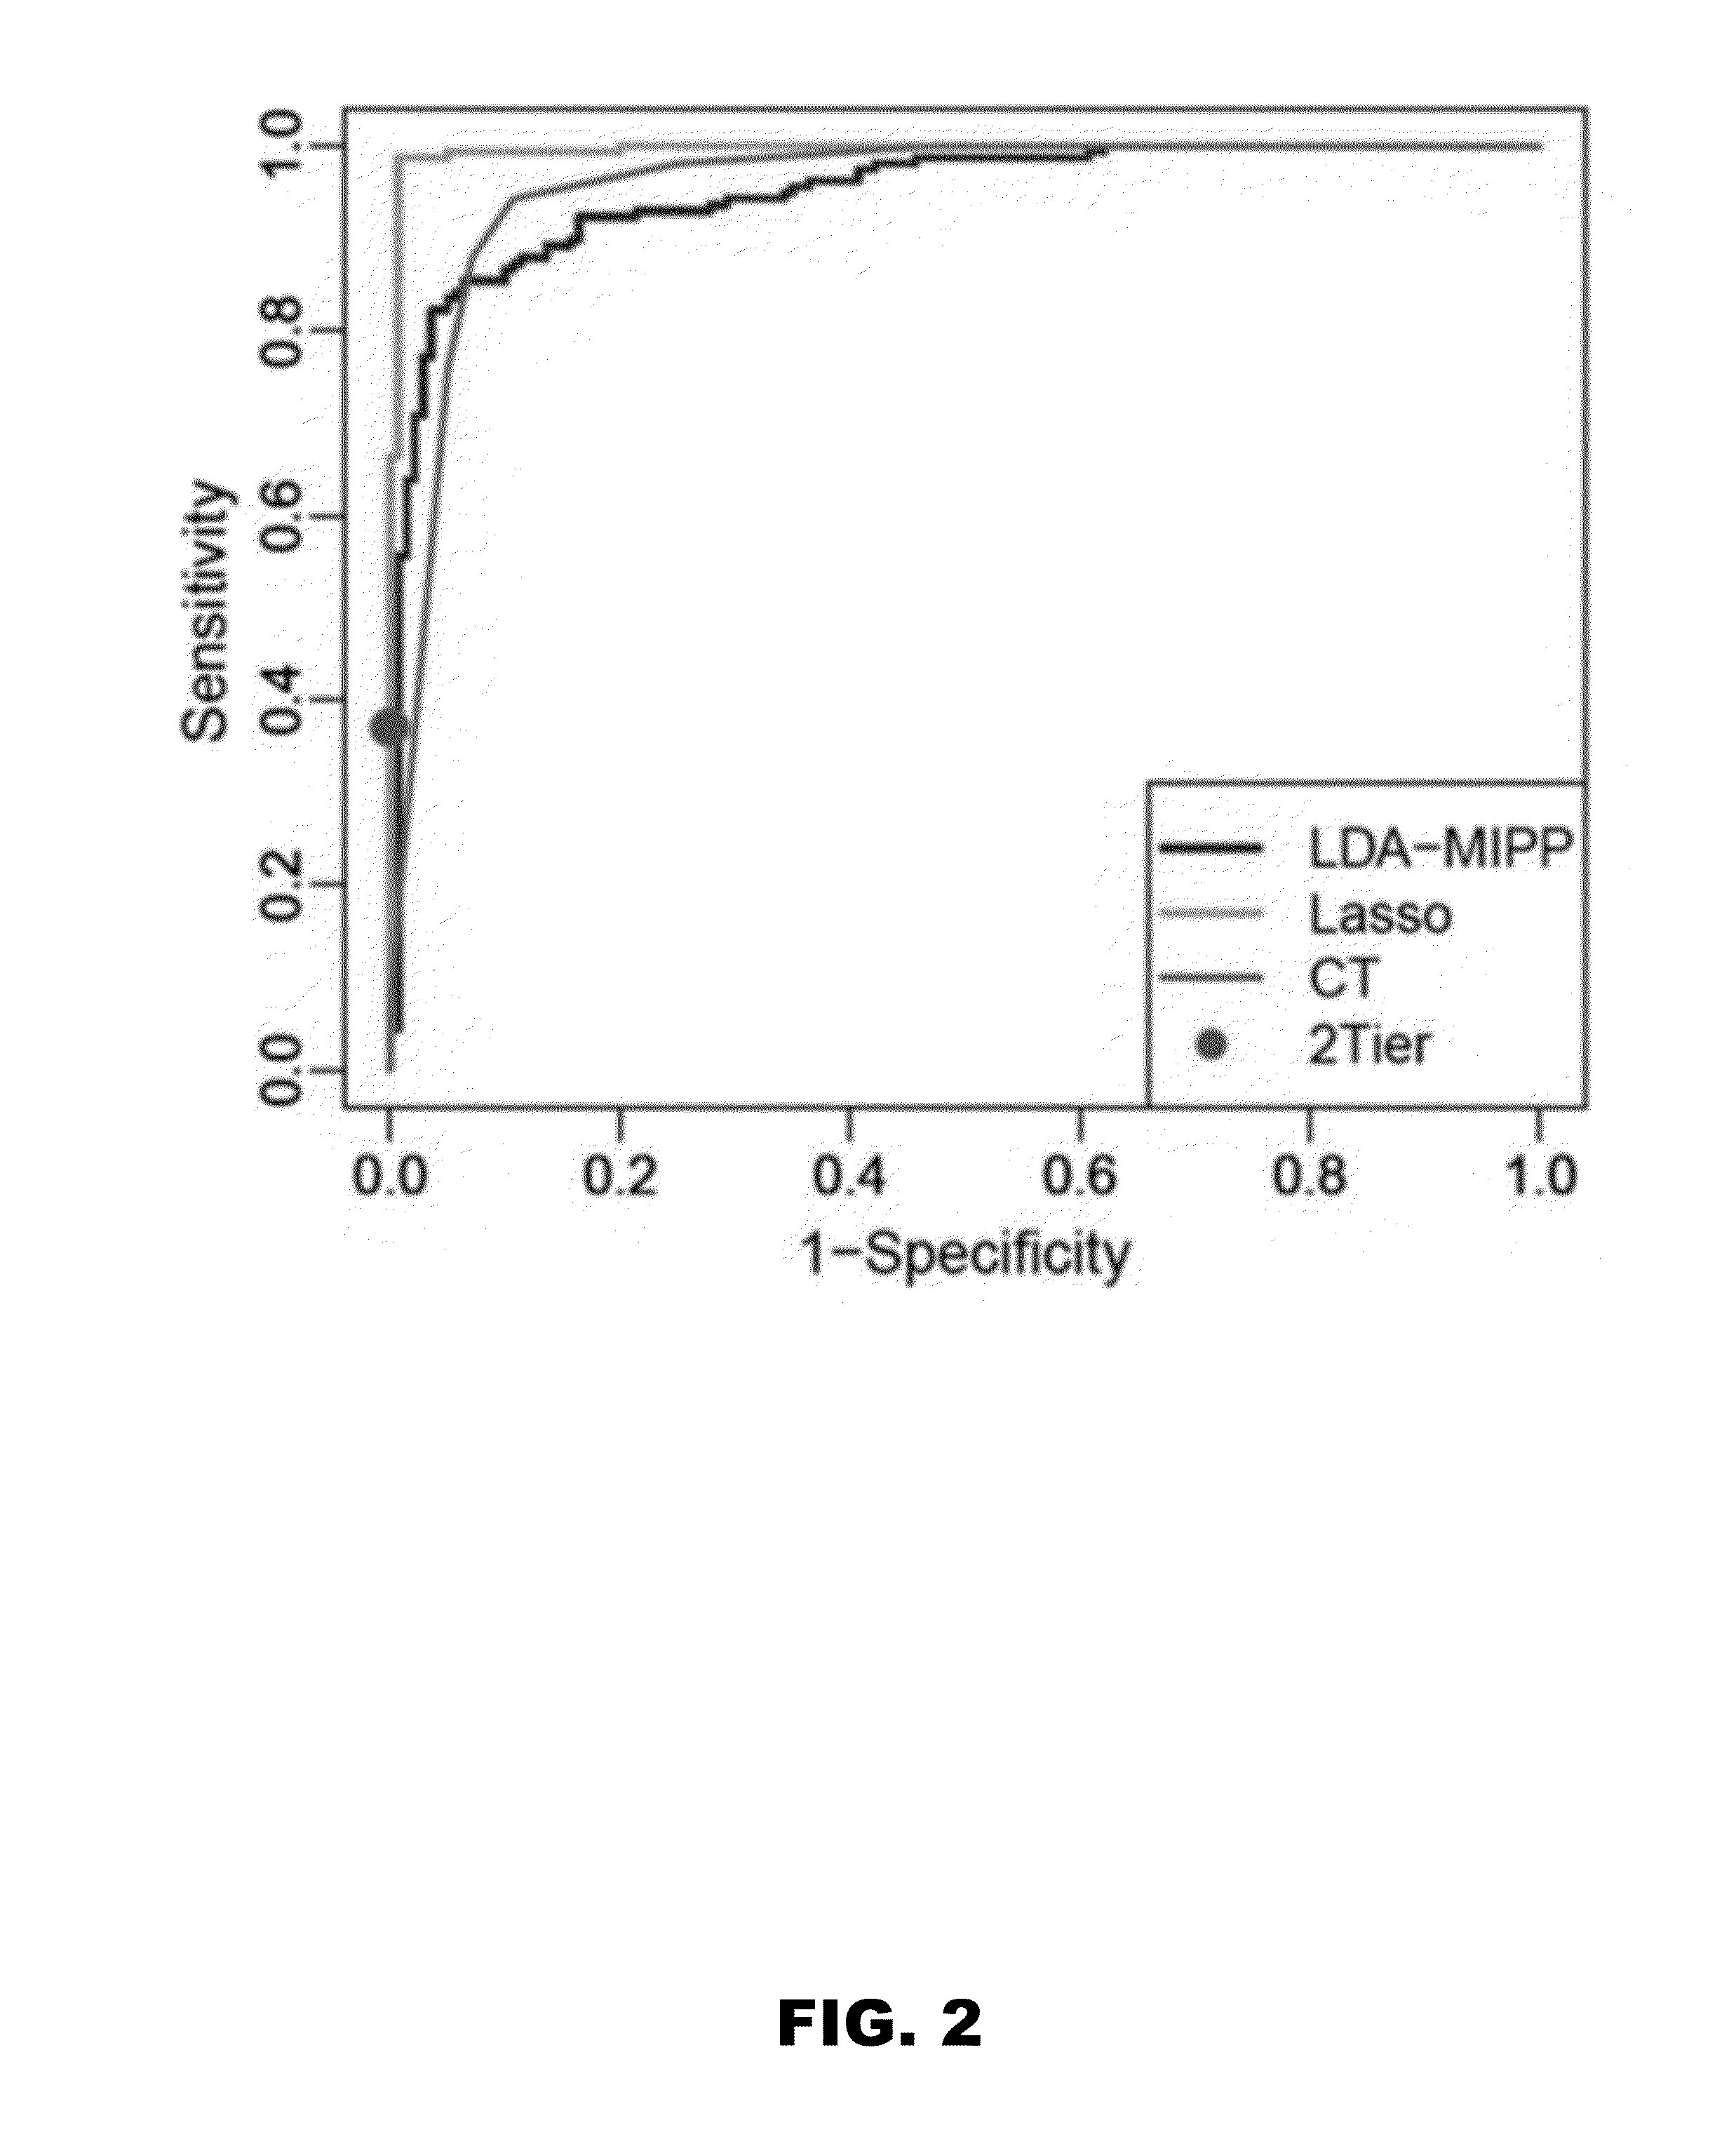
[0053]Statistical modeling was applied to assess whether metabolic profiling could accurately classify early LD patients vs healthy controls and other diseases. Several models (LDAmipp, CT, and LASSO) were trained against the 95-MF biosignature using data from the targeted discovery-samples (FIG. 1B, Training-set). This training generated refined biosignatures (Table 4), and a ROC curve was used to assess their relative performances. The LASSO model resulted in a refined biosignature of 44 MFs and was selected for further evaluation as it provided the most accurate prediction (FIG. 2) with a 99% accuracy rate for both early LD and healthy controls. This accuracy was significantly (P<0.0001) better than 2-tier testing with the same serum samples (Table 2). Further evaluation of the training-set based on leave-one-out cross-validation revealed an error rate of 7.4%.
[0054]For more robust validation, LC-MS data of test-samples (ie,...
PUM
| Property | Measurement | Unit |
|---|---|---|
| flow rate | aaaaa | aaaaa |
| gas temperature | aaaaa | aaaaa |
| temperature | aaaaa | aaaaa |
Abstract
Description
Claims
Application Information
 - R&D
- Intellectual Property
- Life Sciences
- Materials
- Tech Scout
- Unparalleled Data Quality
- Higher Quality Content
- 60% Fewer Hallucinations
Browse by: Latest US Patents, China's latest patents, Technical Efficacy Thesaurus, Application Domain, Technology Topic, Popular Technical Reports.
© 2025 PatSnap. All rights reserved.Legal|Privacy policy|Modern Slavery Act Transparency Statement|Sitemap|About US| Contact US: help@patsnap.com