
Methods for prediction of Anti-tnf alpha drug levels and autoantibody formation
a technology of autoantibody and antitnf, which is applied in the field of methods for predicting the level of antitnf alpha drug and autoantibody formation, can solve the problems that not all subjects treated respond to such therapy, or respond well to such therapy
- Summary
- Abstract
- Description
- Claims
- Application Information
AI Technical Summary
Benefits of technology
Problems solved by technology
Method used
Image

Examples
example 1
n of the Formation of Antibodies-to-Infliximab (ATI) Based on Infliximab (IFX) Levels
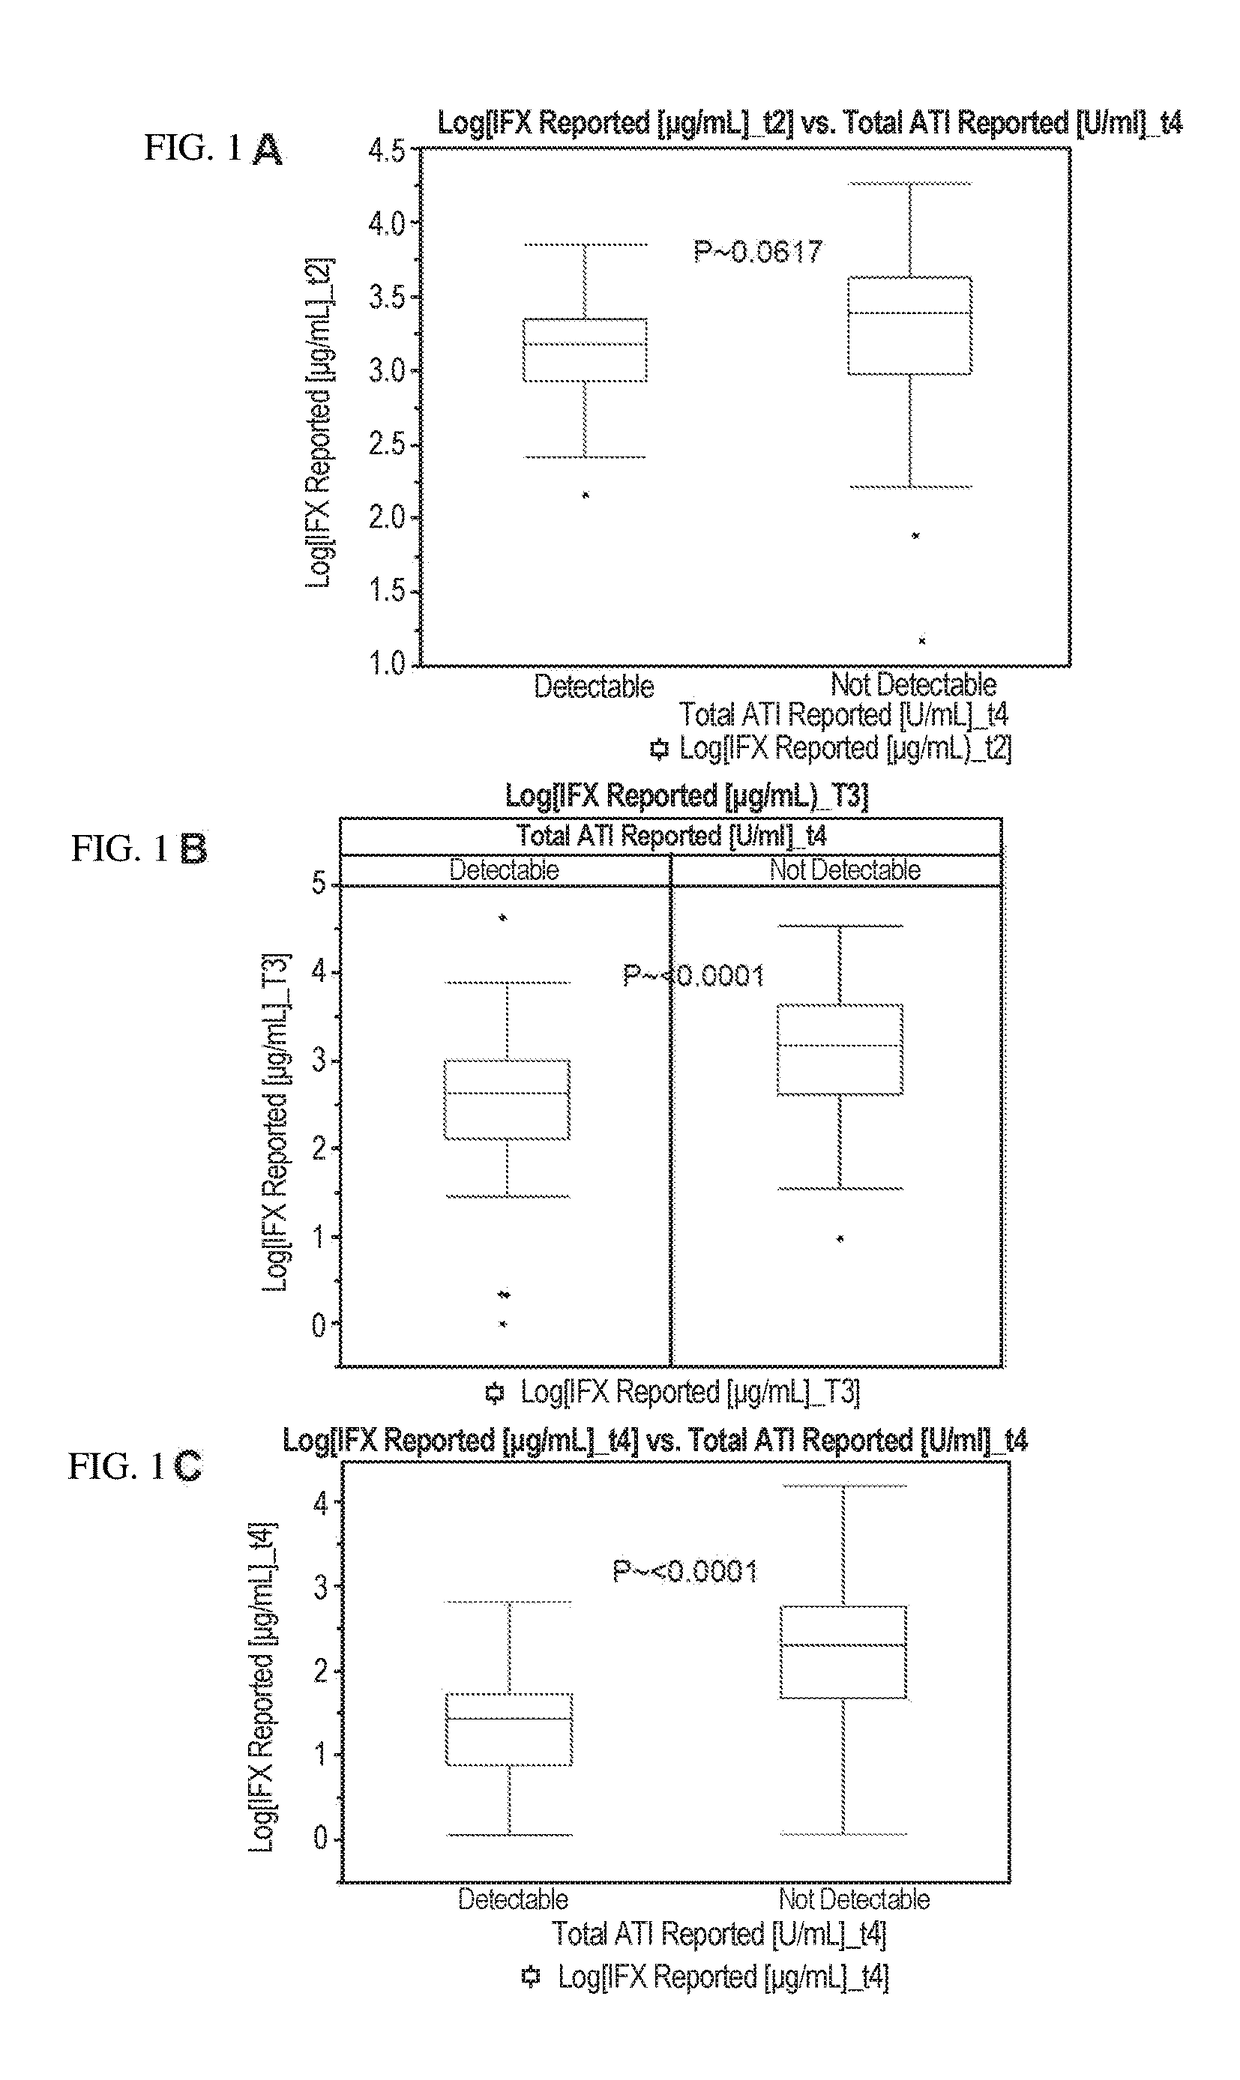
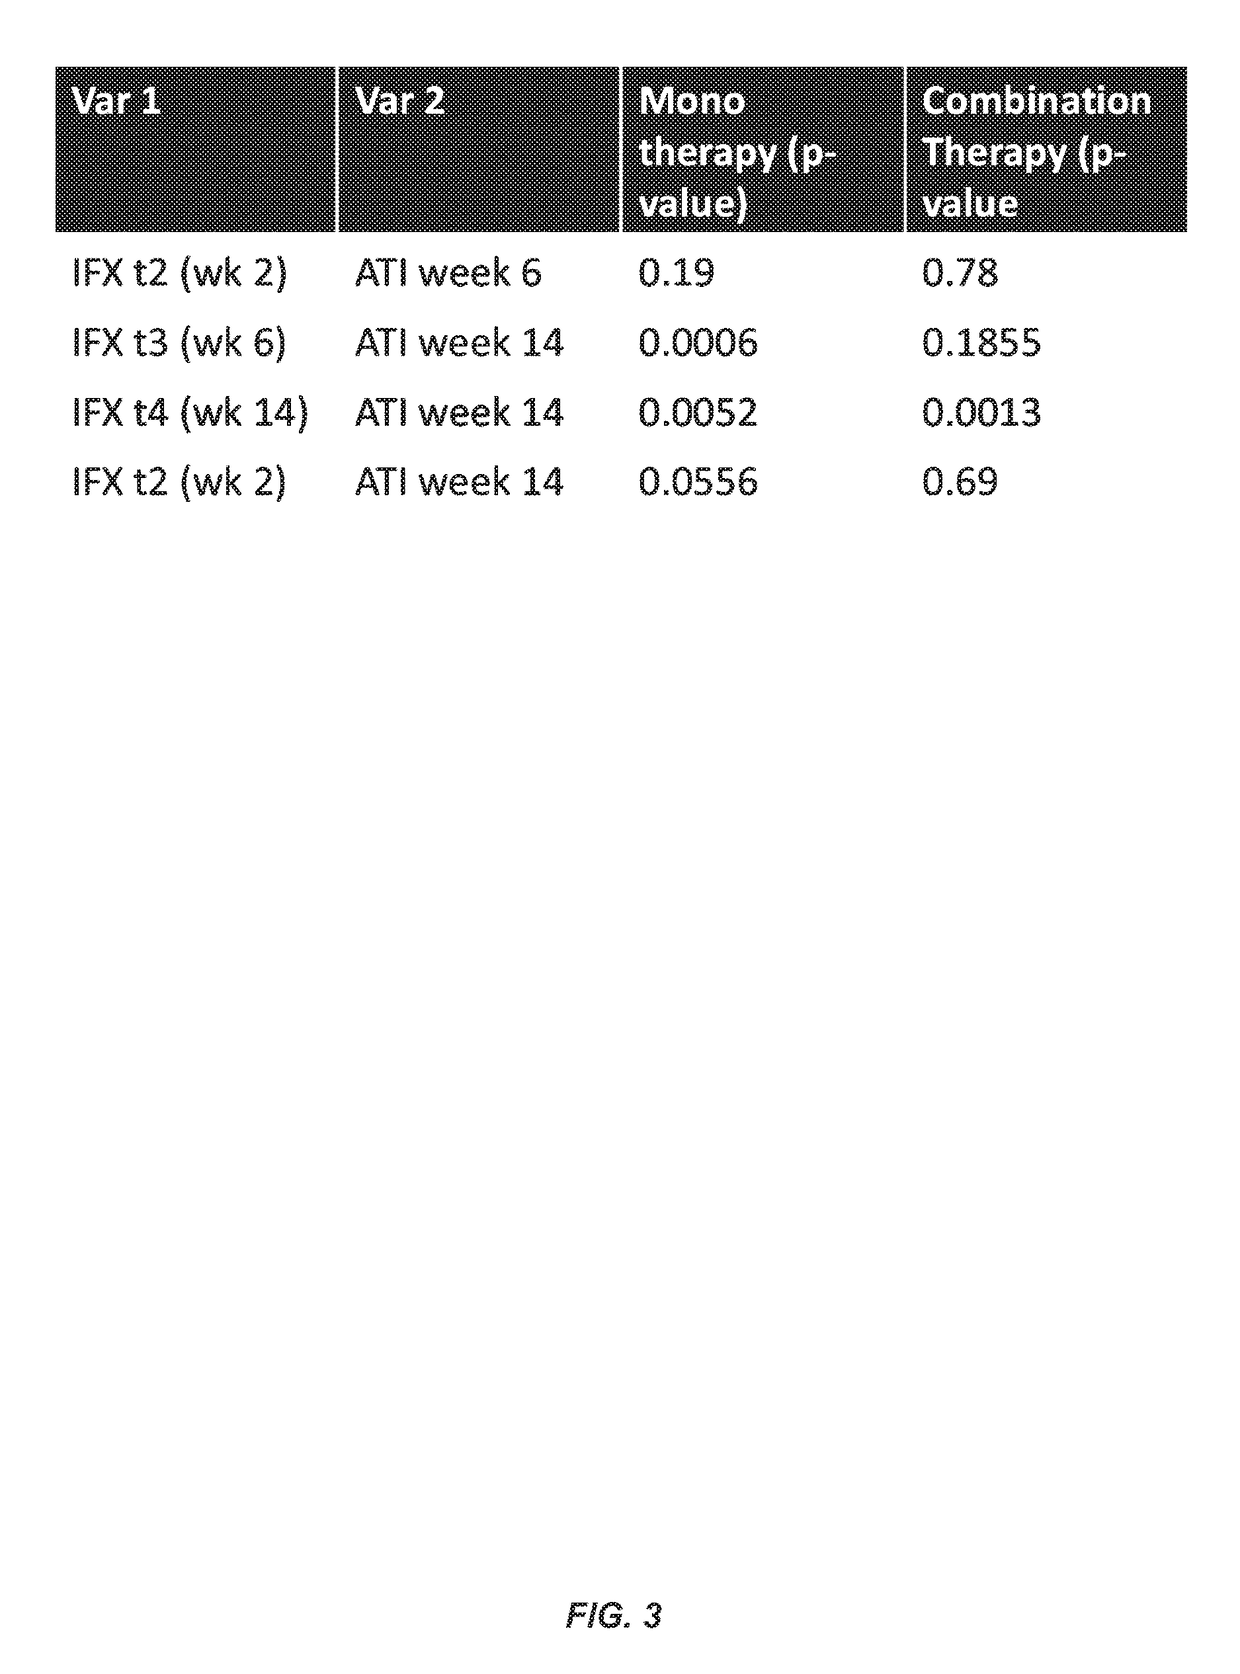
[0171]This example illustrates the association between infliximab (IFX) levels and the formation of antibodies-to-IFX (ATI) in Crohn's disease (CD) patients at various time points during the course of IFX therapy. In certain aspects, this example shows that the level of an anti-TNFα drug (e.g., IFX) at an earlier time point during therapy is predictive of anti-TNFα drug autoantibody (e.g., ATI) formation at a later time point during therapy. In other aspects, this example shows that anti-TNFα drug (e.g., IFX) levels above a specific threshold or cut-off value (i.e., drug levels in the 4th quartile or Q4 based on quartile analysis) at an earlier time point during therapy is predictive of whether a patient will develop anti-TNFα drug autoantibody (e.g., ATI) at a later time point during therapy.
[0172]FIGS. 1A-1C show the relationship between IFX levels and the ATI formation in CD patients at week 2 (“...
example 2
, Multiple Regression Models for Predicting IFX Levels and ATI Formation
[0178]This example illustrates multiple regression modelling to predict IFX levels and ATI formation at a later time point during a course of therapy with IFX (e.g., at week 2, 6, or 14) in Crohn's disease (CD) patients prior to the initiation of IFX therapy. In certain aspects, this example shows that the initial dose of an anti-TNFα drug (e.g., IFX) can be individualized and tailored for each patient at the start of therapy based on the predictive models described herein. In other aspects, this example shows that patients predicted to produce anti-TNFα drug autoantibody (e.g., ATI) during a course of therapy with an anti-TNFα drug (e.g., IFX) based on the predictive models described herein can be administered an initial dose of the drug that is increased compared to the normal starting dose and / or an increased dose of an immunosuppressive agent (e.g., immunomodulator or “IMM”) such as azathioprine (AZA), 6-mer...
example 3
n of IFX Levels and ATI Formation Based on TNFα Levels
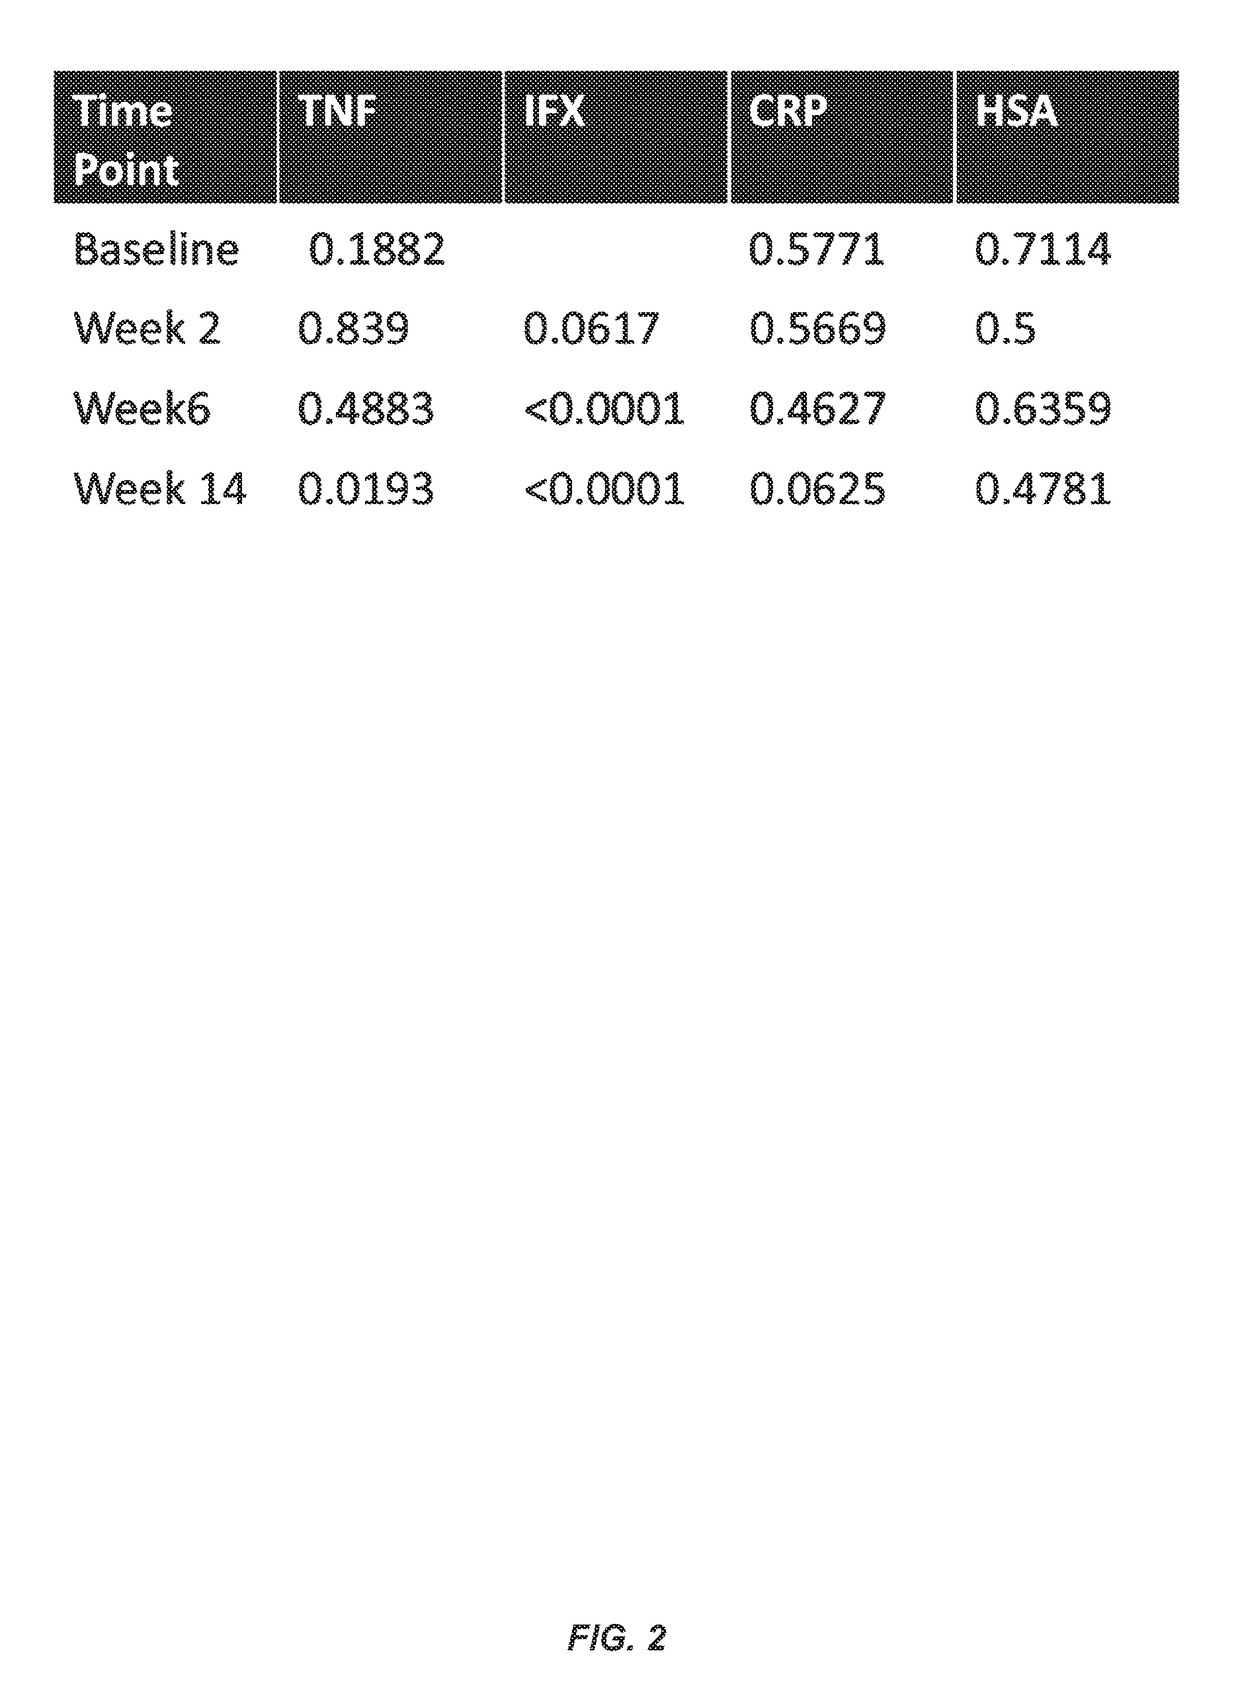
[0190]This example illustrates the association between TNFα levels and IFX levels, ATI formation, human serum albumin (HSA) levels, and C-reactive protein (CRP) levels during the course of IFX therapy and at baseline prior to the initiation of therapy.
[0191]FIGS. 17A-17D show the relationship between TNFα levels at baseline (FIG. 17A), week 2 (FIG. 17B), week 6 (FIG. 17C), and week 14 (FIG. 17D) and ATI formation at week 14.
[0192]FIG. 18 shows the association between TNFα levels at baseline and IFX levels at weeks 2, 6, and 14. In particular, FIG. 18 illustrates that TNFα levels at baseline predict IFX levels at week 14.
[0193]FIG. 19 shows a stratified analysis of the association between baseline TNFα levels and IFX levels in CD patients receiving IFX monotherapy or combination therapy with IFX and an immunosuppressive agent. In particular, FIG. 19 illustrates that TNFα levels at baseline predict IFX levels at week 14 in patients...
PUM
| Property | Measurement | Unit |
|---|---|---|
| time | aaaaa | aaaaa |
| time | aaaaa | aaaaa |
| time | aaaaa | aaaaa |
Abstract
Description
Claims
Application Information