Root cause analysis in a communication network via probabilistic network structure

a network structure and network technology, applied in the field of root cause analysis in a communication network via probabilistic network structure, can solve the problems of time-consuming and costly to properly measure and calculate kqis, and the difficulty of improving the experience of a customer's quality of service (qos) remains a challenging task,

Inactive Publication Date: 2017-12-21
FUTUREWEI TECH INC
View PDF7 Cites 38 Cited by
  • Summary
  • Abstract
  • Description
  • Claims
  • Application Information

AI Technical Summary

Benefits of technology

[0003]In one embodiment, there is a method for determining a root cause of anomalous behaviors in a network, comprising categorizing each of one or more first indicators into a corresponding one of a plurality of first groups and each of one or more second indicators into a corresponding one of a plurality of second groups; estimating a conditional probability by calculating a probability that the one or more second indicators will result in a degradation of one of the first indicators based on historical data of the one or more first and second indicators using association rule learning; mapping the one or more second indicators having the conditional probability associated with degradation of the one of the first indicators to a corresponding one of the plurality of first groups (in a probabilistic network structure based on a detected degradation of the one of the first indicators in the historical data; and determining whether the one or more second indicators mapped to the corresponding one of the plurality of first groups satisfies a threshold when degradation of the one of the first indicators is detected, and ranking each of the one or more second indicators that results in the degradation of the one of the first indicators according to a corresponding conditional probability.
[0004]In another embodiment, there is a non-transitory computer-readable medium storing computer instructions for determining a root cause of anomalous behavior in a network, that when executed by one or more processors, perform the steps of: categorizing each of one or more first indicators into a corresponding one of a plurality of first groups (states) and each of one or more second indicators into a corresponding one of a plurality of second groups; estimating a conditional probability by calculating a probability that the one or more second indicators will result in a degradation of one of the first indicators based on historical data of the one or more first and second indicators using association rule learning; mapping the one or more second indicators having the conditional probability associated with degradation of the one of the first indicators to a corresponding one of the plurality of first groups in a probabilistic network structure based on a detected degradation of the one of the first indicators in the historical data; and determining whether the one or more second indicators mapped to the corresponding one of the plurality of first groups satisfying a threshold when degradation of the one of the first indicators is detected, and ranking each of the one or more second indicators that results in the degradation of the one of the first indicators according to a corresponding conditional probability.
[0005]In still another embodiment, there is a device for determining a root cause of anomalous behavior in a network, comprising: a non-transitory memory storing instructions; and one or more processors in communication with the non-transitory memory, wherein the one or more processors execute the instructions to: categorize each of one or more first indicators into a corresponding one of a plurality of first groups and each of one or more second indicators into a corresponding one of a plurality of second groups; estimate a conditional probability by calculating a probability that the one or more second indicators will result in a degradation of one of the first indicators based on historical data of the one or more first and second indicators using association rule learning; map the one or more second indicators having the conditional probability associated with degradation of the one of the first indicators to a corresponding one of the plurality of first groups in a probabilistic network structure based on a detected degradation of the one of the first indicators in the historical data; and determine whether the one or more second indicators mapped to the corresponding one of the plurality of first groups satisfies a threshold when degradation of the one of the first indicators is detected, and rank each of the one or more second indicators that results in the degradation of the one of the first indicators according to a corresponding conditional probability.
[0006]This Summary is provided to introduce a selection of concepts in a simplified form that are further described below in the Detailed Description. This Summary is not intended to identify key features or essential features of the claimed subject matter, nor is it intended to be used as an aid in determining the scope of the claimed subject matter. The claimed subject matter is not limited to implementations that solve any or all disadvantages noted in the Background.

Problems solved by technology

However, measuring and improving a customer's quality of service (QoS) experience remains a challenging task, which requires accounting for technical issues, such as response times and throughput, and non-technical issues, such as customer expectations, prices and customer support.
For example, a user's device may experience poor coverage or fail to handover due to a faulty base station or a content server may suffer from a hardware issue resulting in performance degradation.
However, while measurement of performance levels using KPIs may be accomplished in a relatively fast and economic manner, it is often time consuming and costly to properly measure and calculate KQIs.
As a result, QoS performance levels may not be readily identifiable.

Method used


Image

  • Root cause analysis in a communication network via probabilistic network structure
  • Root cause analysis in a communication network via probabilistic network structure
  • Root cause analysis in a communication network via probabilistic network structure

Examples


Embodiment Construction

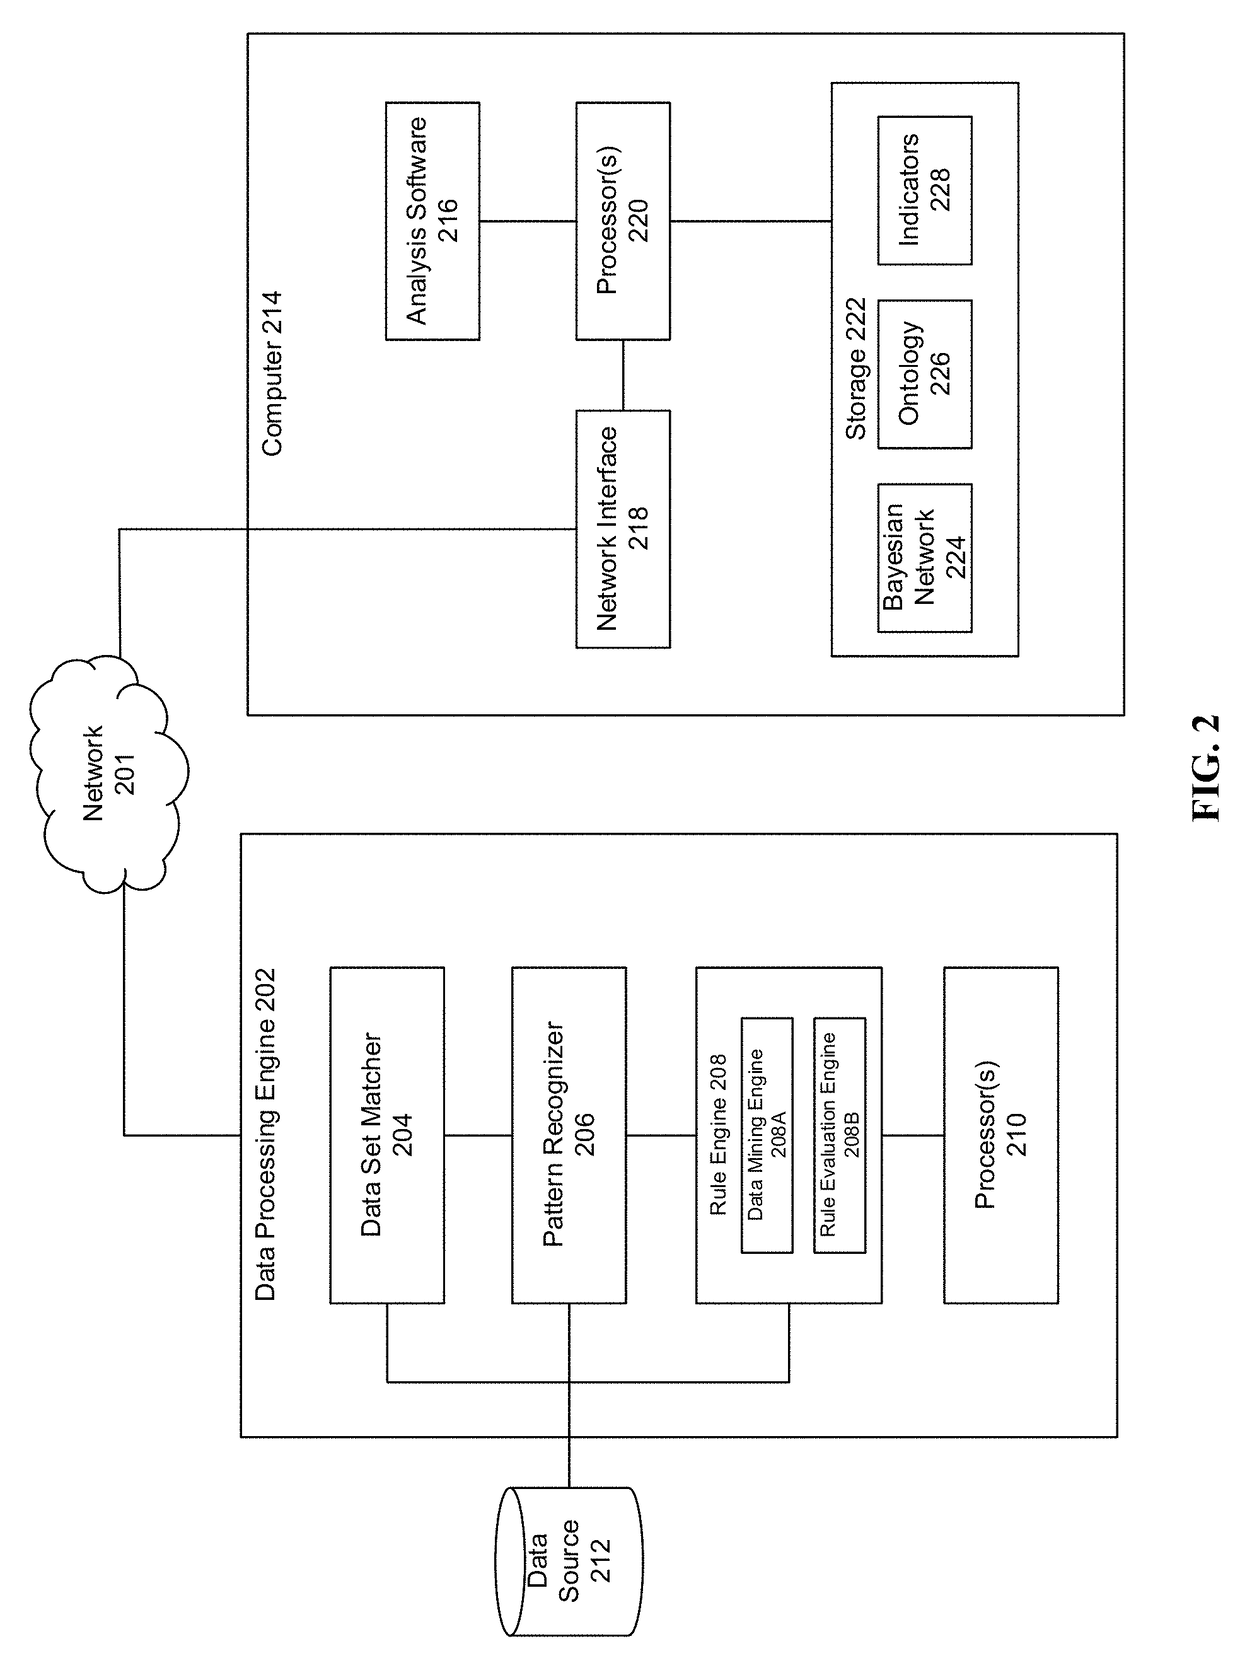
[0019]The disclosure relates to technology for determining a root cause of anomalous behavior in a network using a probabilistic network structure (learned network), such as a Bayesian network or finite state machine.

[0020]Determining the cause of anomalous or degraded behavior in a network (e.g., network slowness) for a particular transaction, component, entity, etc. can be onerous. The technology described herein determines or infers probable root causes of degradation in network transactions using learned networks. In some embodiments, the learned network may be updated to reflect the dynamically evolving environment of the network or based on specific operator feedback.

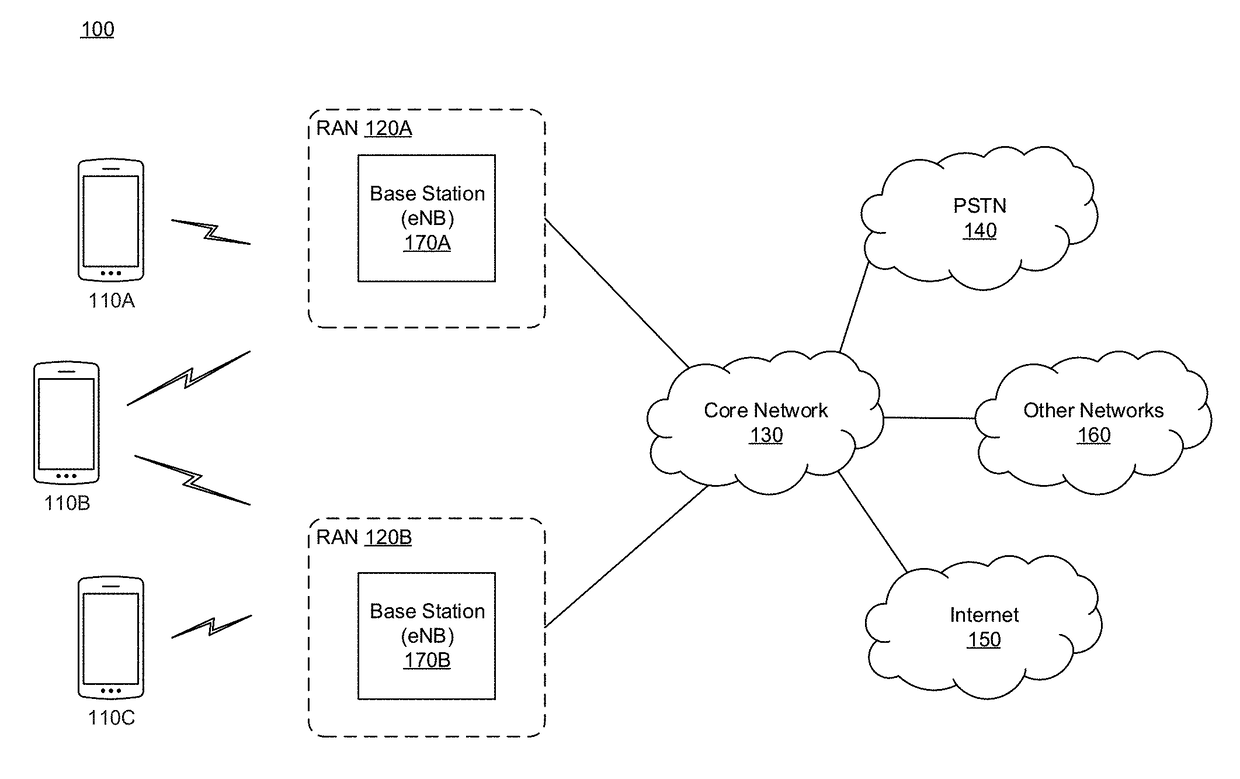
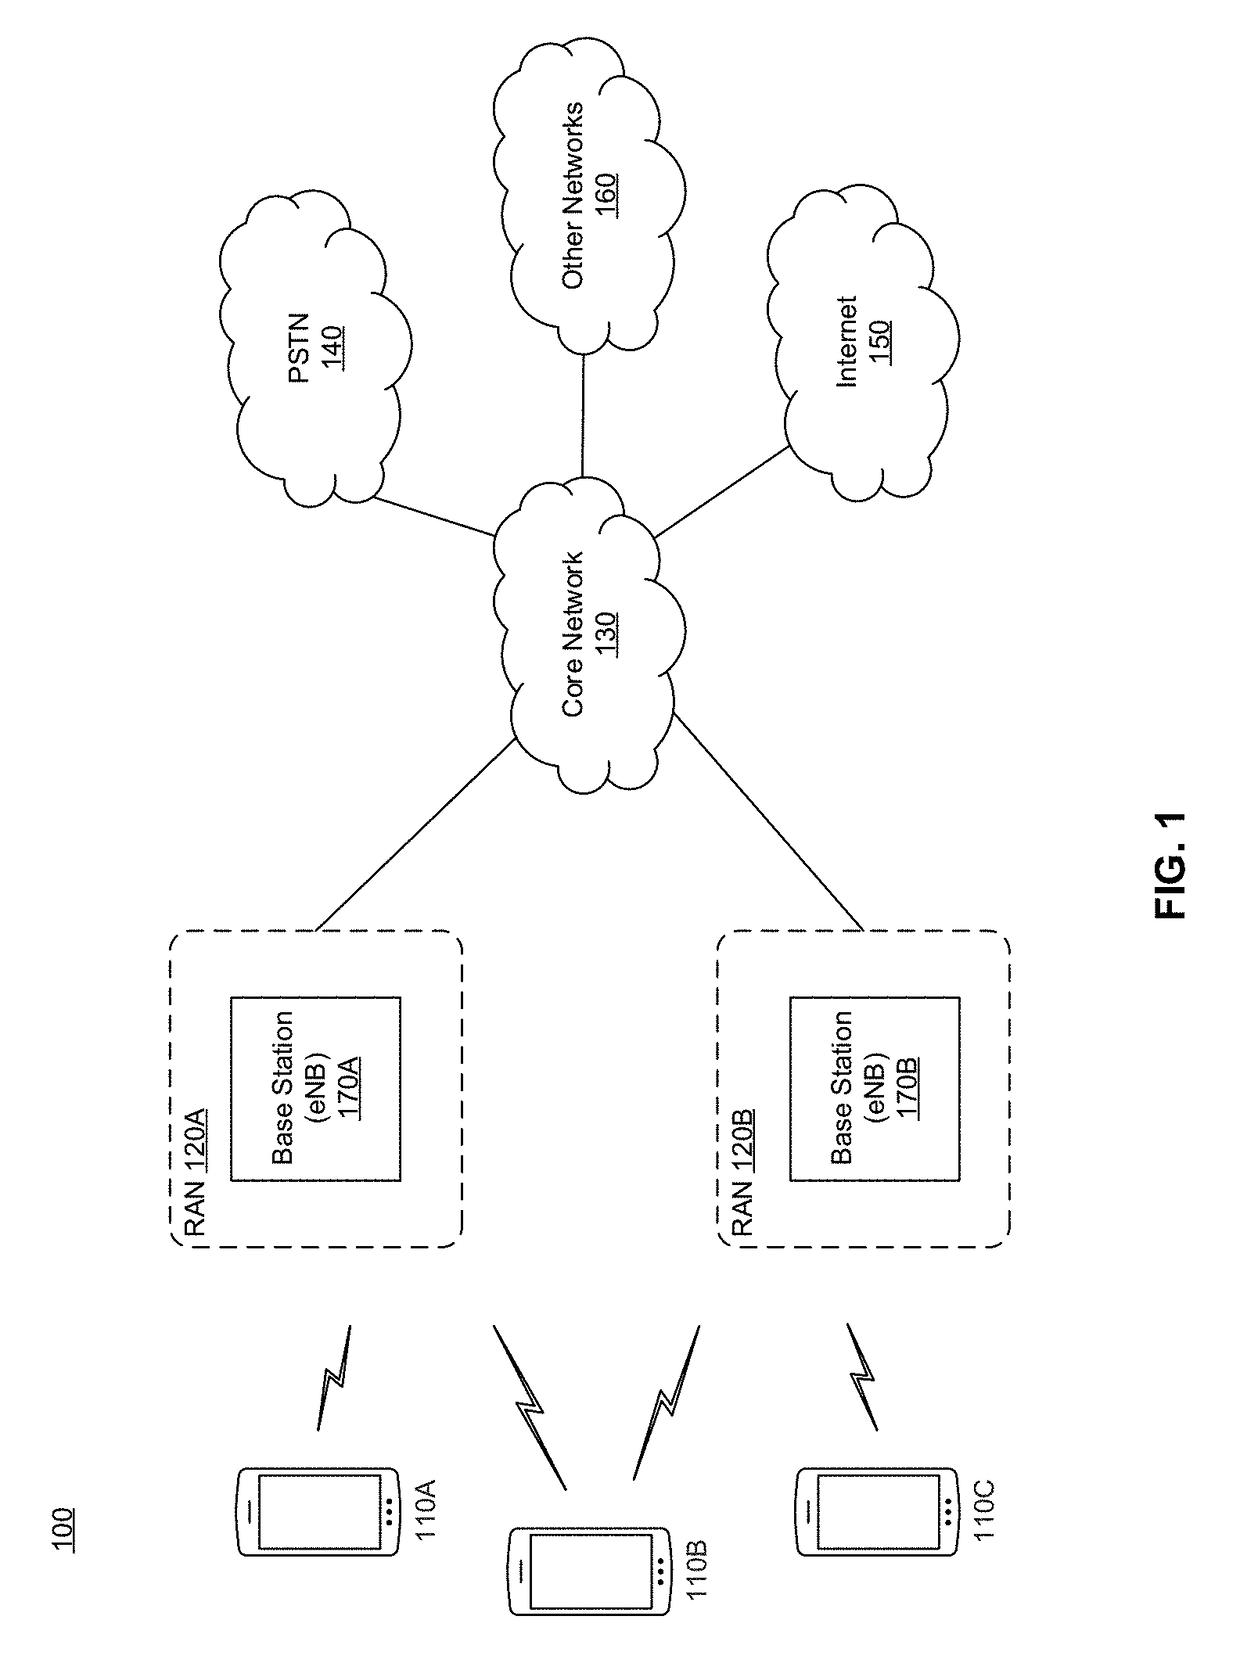
[0021]To determine root causes within the network, data from network transactions, components, entities, etc. are collected and measured using, for example, monitoring agent and sensors located throughout the network. The collected and measured data includes, for example, quality of service (KQI) and performance (...


PUM


Abstract

The disclosure relates to technology for determining a root cause of anomalous behaviors in networks. First indicators (KQIs) are categorized into first groups (states) and second indicators (KPIs) are categorized into second groups. A conditional probability is estimated by calculating a probability that the second indicators will result in degradation of the first indicators based on historical data using association rule learning. The second indicators having the conditional probability associated with degradation of the first indicators are mapped to a corresponding one of the first groups in a probabilistic network structure based on a detected degradation of the first indicators in the historical data. Then it is determined whether the second indicators mapped to the corresponding first groups satisfy a threshold when degradation of the first indicators is detected, and each of the second indicators resulting in degradation of the first indicator are ranked according to a corresponding conditional probability.

Description

BACKGROUND[0001]Service quality as perceived by customers is an important aspect of the telecommunications industry. To successfully maintain and enhance the service quality to customers, network behaviors require measurement and analysis. However, measuring and improving a customer's quality of service (QoS) experience remains a challenging task, which requires accounting for technical issues, such as response times and throughput, and non-technical issues, such as customer expectations, prices and customer support. One mechanism to measure these issues is by root cause analysis for network troubleshooting in a communication network. For example, a customer service assurance platform may be used to analyze performance and quality degradation from a variety of network services, such as content servers and user devices, to ensure customer service quality is consistent with communication service provider expectations.[0002]Another mechanism to troubleshoot communication networks invol...

Claims


Application Information

Patent Timeline
Patent Type & Authority Applications(United States)
IPC IPC(8): G06N7/00H04L12/24
CPCH04L41/16G06N7/005H04L41/142H04L41/145H04L41/5009H04L41/0636G06N5/025G06N7/01
Inventor YANG, KAI
Owner FUTUREWEI TECH INC
Why Eureka
Try Eureka