Methods and means for dysplasia analysis
a dysplasia and analysis method technology, applied in the field of dysplasia diagnosis or aiding diagnosis, can solve problems such as disagreements, and achieve the effects of modest or negligible effect on the classification ability of signatures and high value of the area
- Summary
- Abstract
- Description
- Claims
- Application Information
AI Technical Summary
Benefits of technology
Problems solved by technology
Method used
Image
Examples
example 1
Normalisation
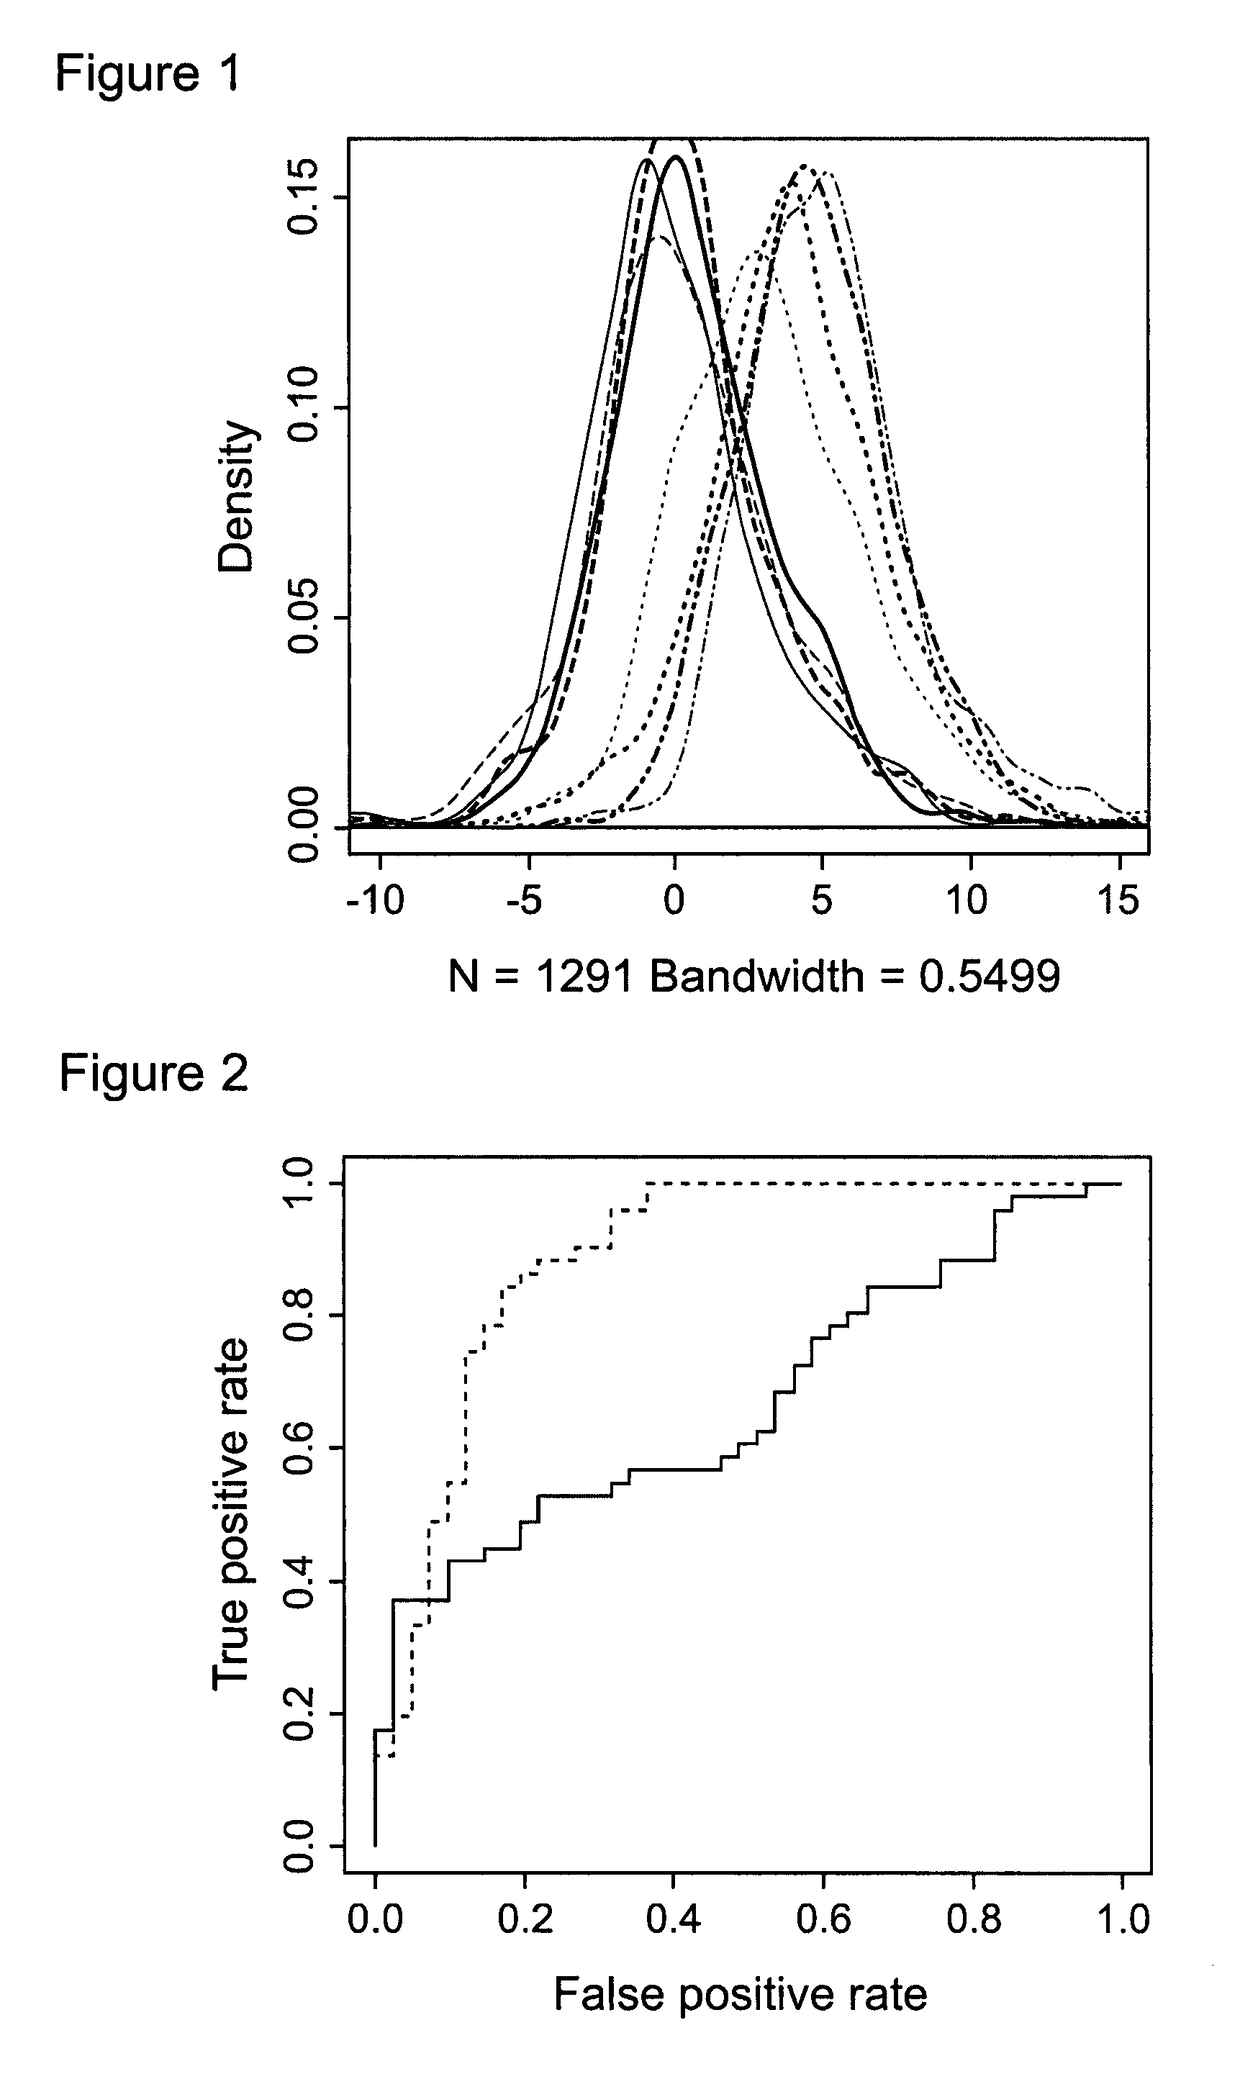
[0239]Even after control probe normalisation intensity values between different runs are not always comparable (see FIG. 1). There can be a shift in the mean intensity, in particular between Runs 1 & 4 compared to Runs 2 & 3.
[0240]Such a shift might be corrected for, for example by using a calibration sample.
[0241]Alternatively the shift might be corrected for using a data analysis solution. The solution that we show in this example is to Gaussian normalise the arrays. To Gaussian normalise, firstly the 40 (or 90) values were ranked and the rank divided by 41 (or 91). These values were then taken to be a vector of probabilities from a Gaussian distribution and converted to variables using the distribution's quantile function.
[0242]That is, if ri is the rank of the ith probe on the array, its value is Gaussian transformed to xi where Pr(Xi)=ri=41 (or 91), and xi are assumed to be normally distributed.
[0243]ROC curves for the unnormalised data (red) and the Gaussian norma...
example 2a
gnature
[0245]The 40 gene signature provides the advantage of delivering clinically reliable information or a clinically reliable indication. Use of fewer genes in the analysis results in information of clinically questionable relevance.
[0246]In particular, one conclusion which can be supported using the 40 gene signature taught herein is whether or not the subject has dysplasia such as oesophageal dysplasia. Use of fewer than 40 genes does not reliably support this type of conclusion.
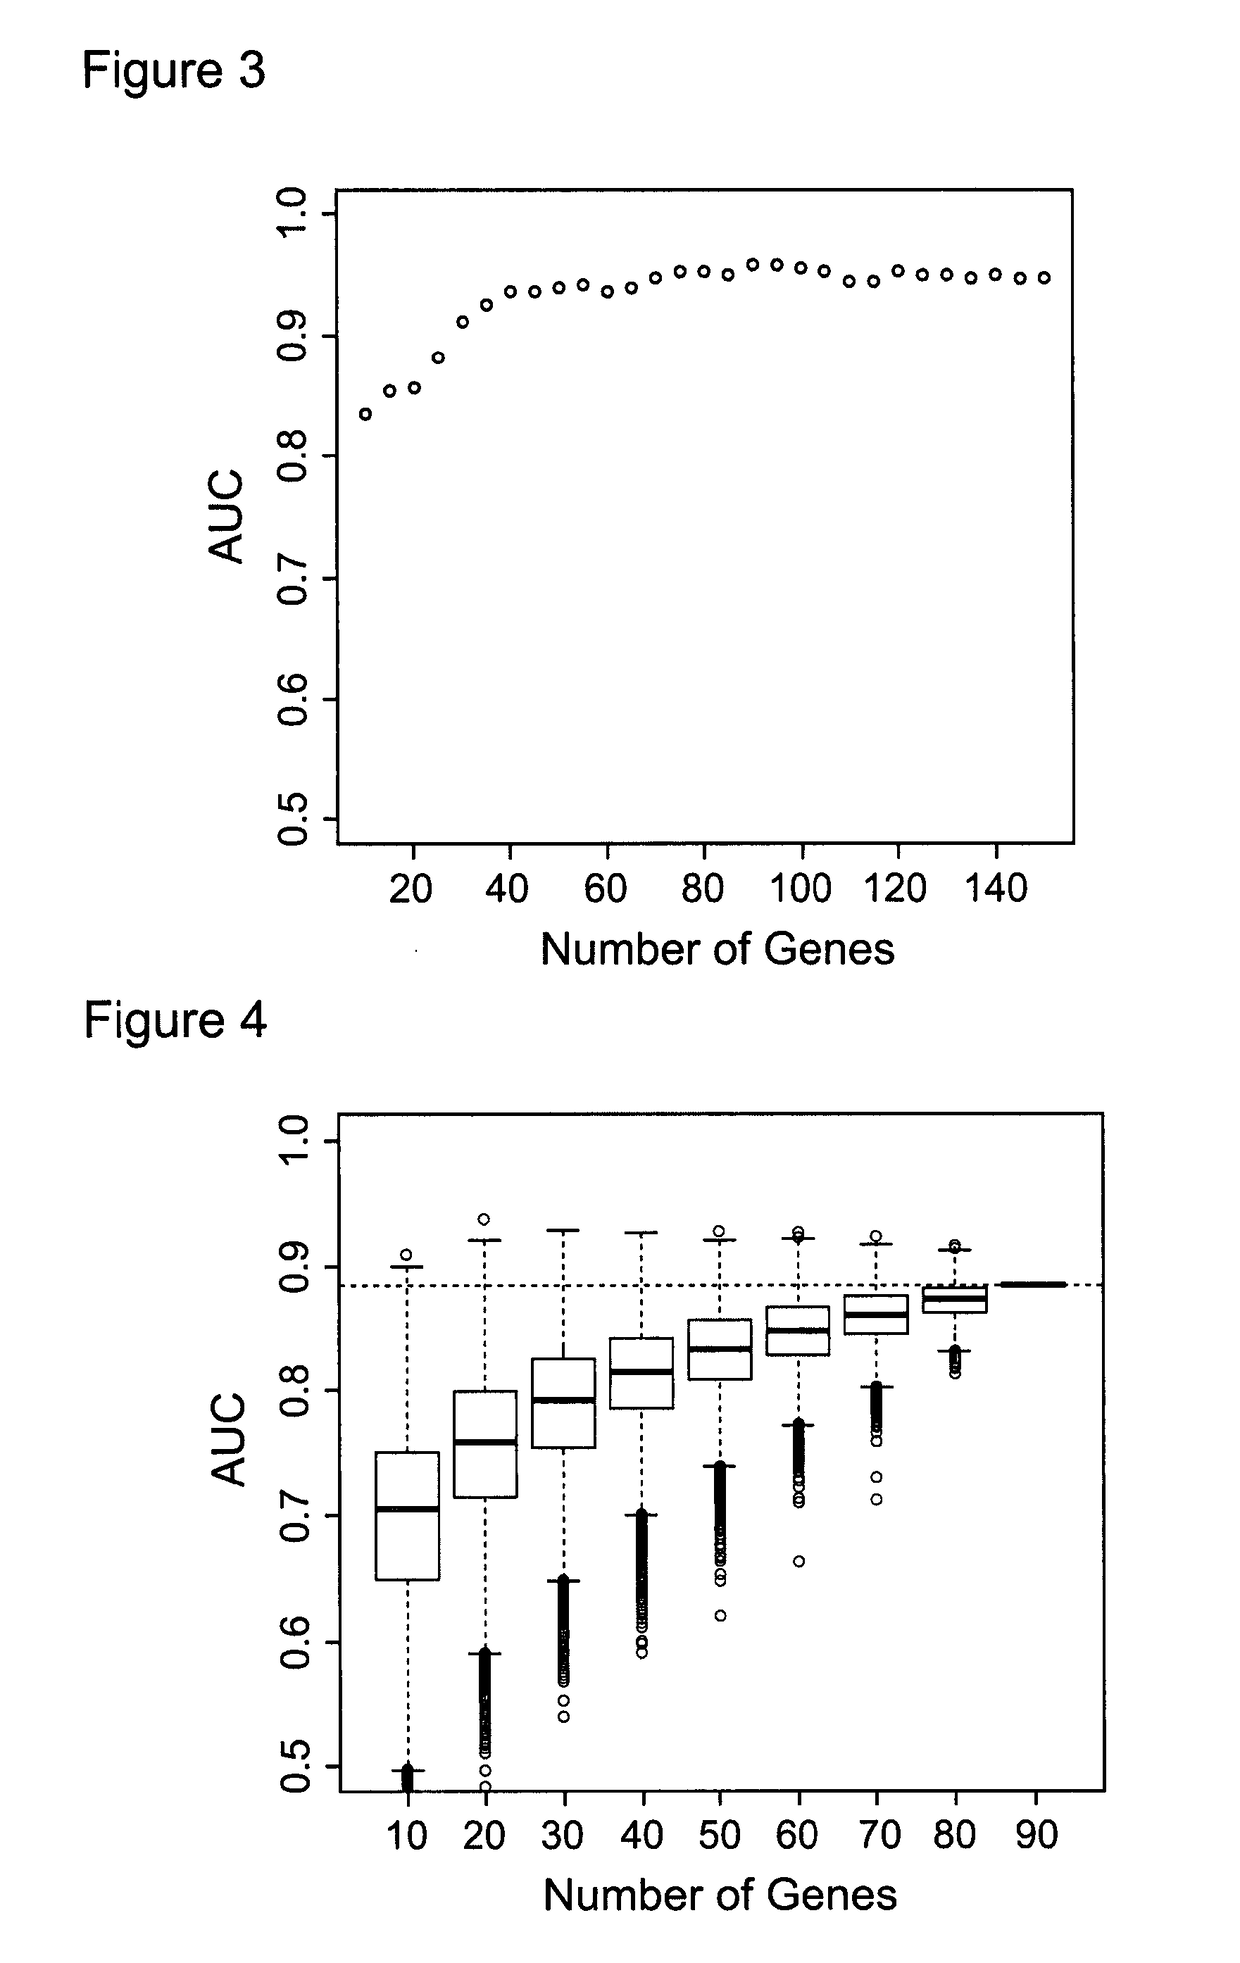
[0247]Another advantage of the 40 gene signature is the high value area under the curve (‘AUC’, which measures the diagnostic accuracy of a panel), which it provides. At 40 genes, the AUC is above 90% as shown in FIG. 3.
[0248]In other words, FIG. 3 clearly demonstrates that the area under the curve (AUC) for the 40 gene signature is equivalent to that for the 90 gene signature. The area under the curve indicates the proportion of samples that would be correctly classified into low or high risk based on ...
example 2b
n to Subjects
[0255]We provide the following outline of applying the test to a patient / subject:
[0256]A biopsy sample is taken (or provided) from the Barrett's oesophagus segment of a patient.
[0257]The mRNA from the sample is extracted and processed and the expression levels of 40 specific genes shown in table 1 is assessed on this sample.
[0258]The gene expression levels are then normalised and a weighted average score is calculated based on the expression of these 40 genes which gives different pre-set weights for each of the genes.
[0259]Based on the weighted average score the sample would be assigned as ‘high risk’ or ‘low risk’ for dysplasia based on whether the weighted average score is above or below a threshold value of zero.
PUM
| Property | Measurement | Unit |
|---|---|---|
| Mass | aaaaa | aaaaa |
| Length | aaaaa | aaaaa |
| Length | aaaaa | aaaaa |
Abstract
Description
Claims
Application Information
 - R&D
- Intellectual Property
- Life Sciences
- Materials
- Tech Scout
- Unparalleled Data Quality
- Higher Quality Content
- 60% Fewer Hallucinations
Browse by: Latest US Patents, China's latest patents, Technical Efficacy Thesaurus, Application Domain, Technology Topic, Popular Technical Reports.
© 2025 PatSnap. All rights reserved.Legal|Privacy policy|Modern Slavery Act Transparency Statement|Sitemap|About US| Contact US: help@patsnap.com


