Image Processing Apparatus, Surface Analyzer, and Image Processing Method

Active Publication Date: 2018-11-29
JEOL LTD
View PDF2 Cites 1 Cited by
  • Summary
  • Abstract
  • Description
  • Claims
  • Application Information

AI Technical Summary

Benefits of technology

[0006]The invention provides an image processing apparatus capable of displaying characteristics of an elemental composition of each phase in an easily understandable manner, a surface analyz

Problems solved by technology

As illustrated in FIG. 25, when the X-ray intensities of elements of each phase are displayed as a list, it is difficult to comprehend characteristics of an elemental composition of each phase.
For example, with the list

Method used


Image

  • Image Processing Apparatus, Surface Analyzer, and Image Processing Method
  • Image Processing Apparatus, Surface Analyzer, and Image Processing Method
  • Image Processing Apparatus, Surface Analyzer, and Image Processing Method

Examples


Embodiment Construction

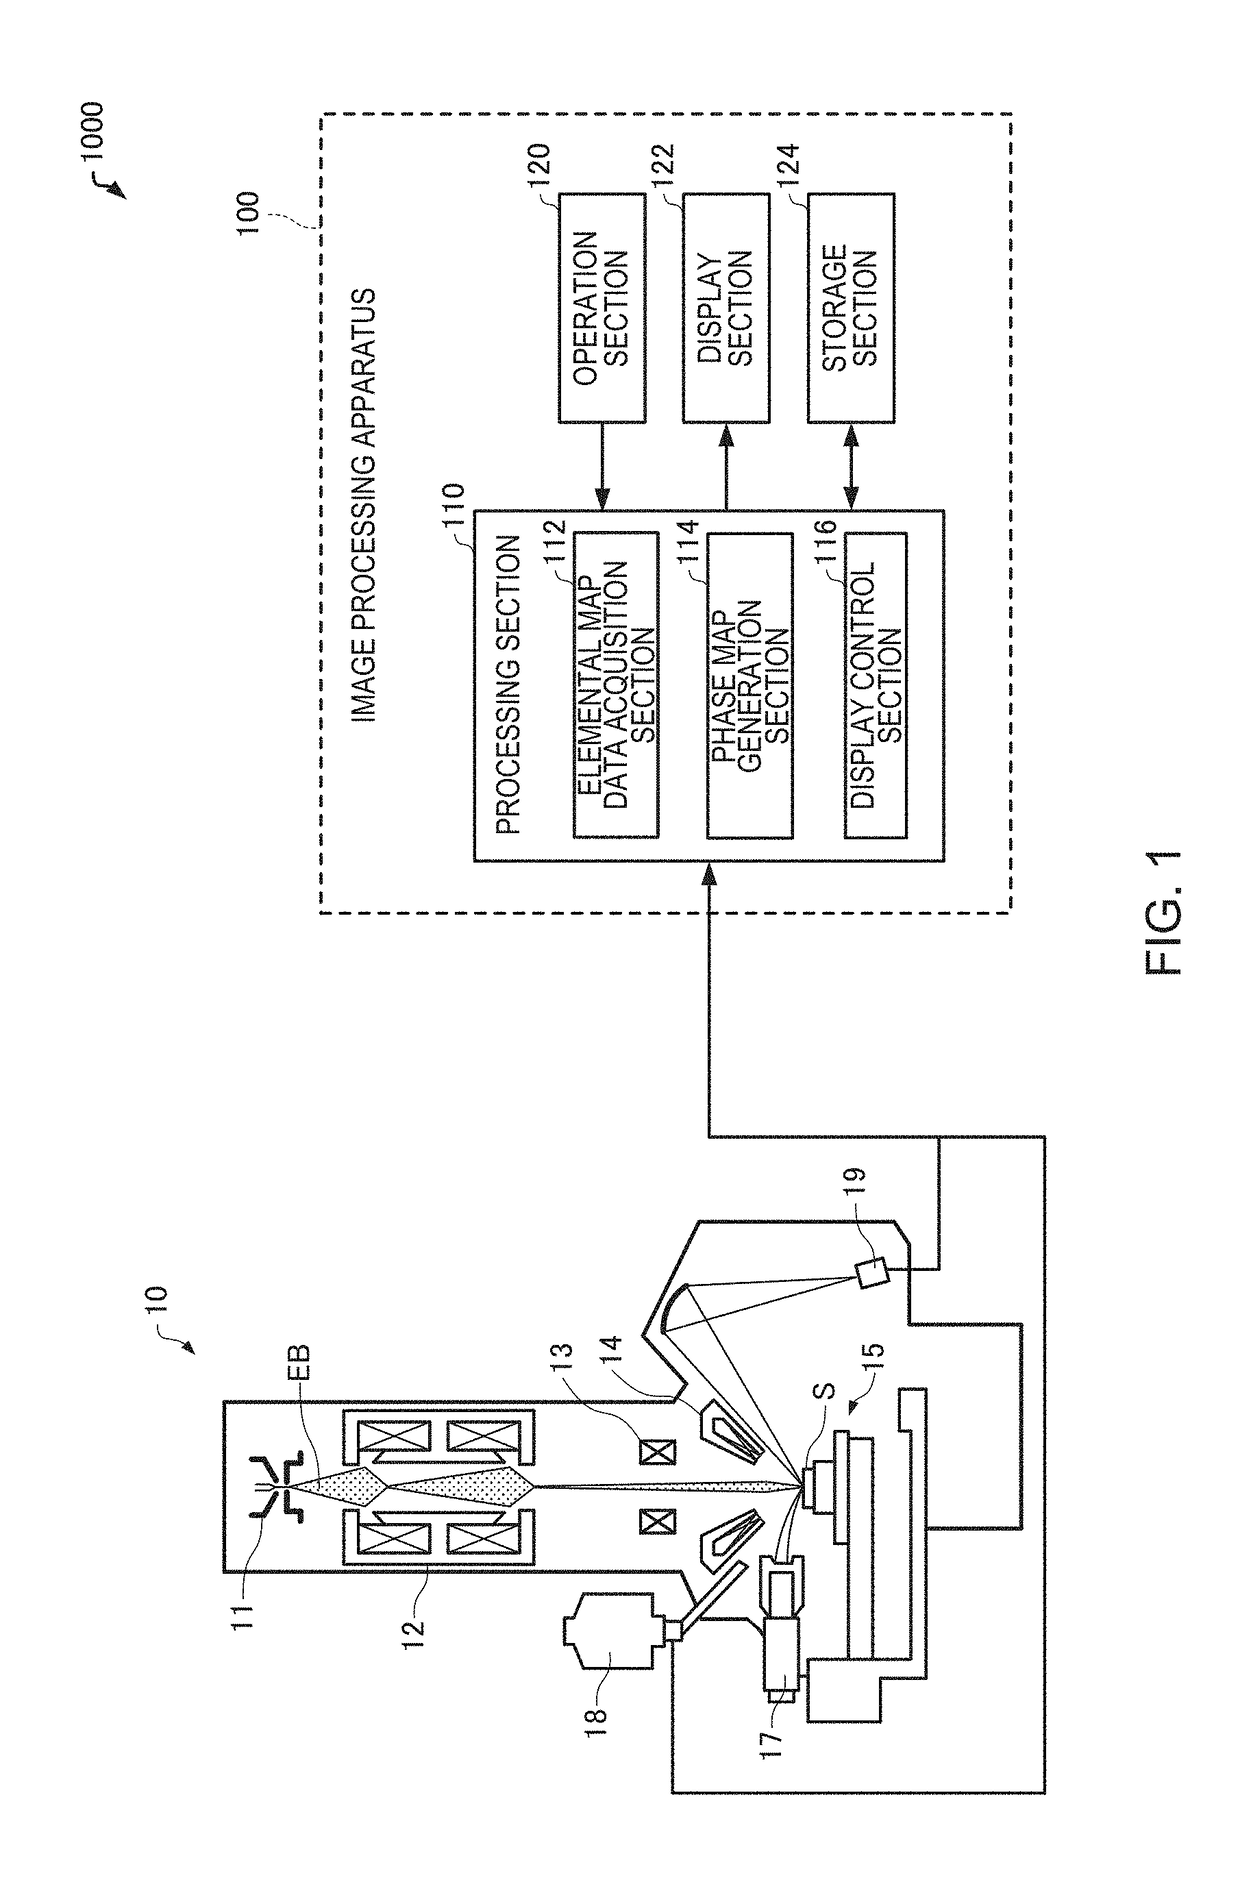
[0041]According to one embodiment of the invention, there is provided an image processing apparatus including a processor and a memory, the processor executing a program stored in the memory to:

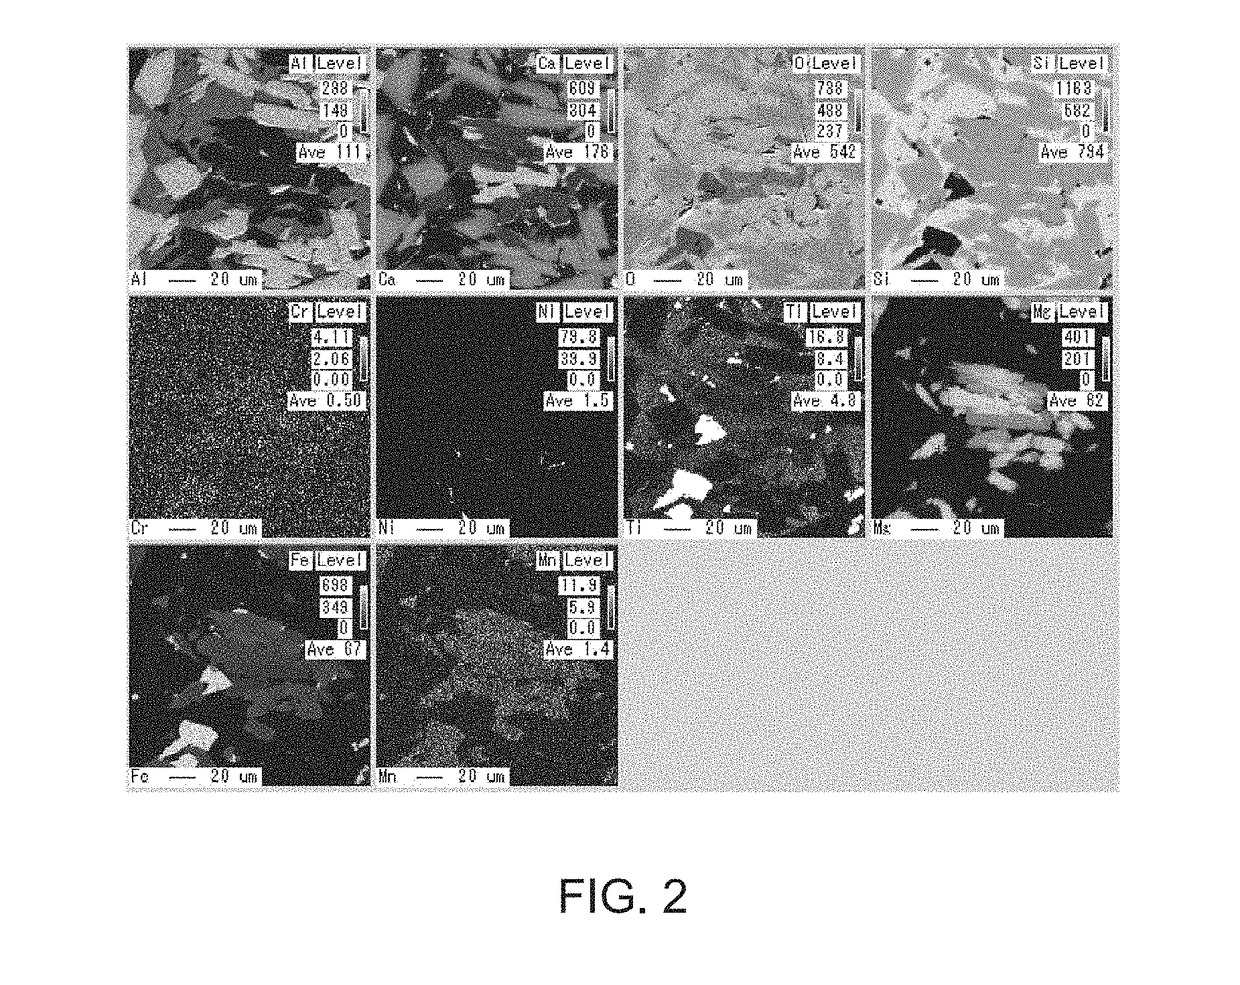
[0042]acquire elemental map data representing a distribution of X-ray intensity or a distribution of concentration for each element;

[0043]generate a phase map indicating a distribution of phases of compounds based on the elemental map data; and

[0044]generate graphs representing X-ray intensity of each element or a concentration of each element as an area for the respective phases of the compounds included in the phase map and cause a display section to display the graphs.

[0045]Such an image processing apparatus causes the display section to display the graphs representing X-ray intensity of each element or a concentration of each element as an area for the respective phases of the compounds included in the phase map. Therefore, a user can readily comprehend characteristics of an elemental com...


PUM


Abstract

An image processing apparatus including a processor and a memory, the processor executing a program stored in the memory to: acquire elemental map data representing a distribution of X-ray intensity or a distribution of concentration for each element; generate a phase map indicating a distribution of phases of compounds based on the elemental map data; and generate graphs representing X-ray intensity of each element or a concentration of each element as an area for the respective phases of the compounds included in the phase map and cause a display section to display the graphs.

Description

CROSS-REFERENCE TO RELATED APPLICATION[0001]This application claims priority to Japanese Patent Application No. 2017-105804 filed May 29, 2017, the disclosure of which is hereby incorporated in its entirety by reference.BACKGROUND OF THE INVENTIONField of the Invention[0002]The present invention relates to an image processing apparatus, a surface analyzer, and an image processing method.Description of Related Art[0003]Phase analysis is known as a method of analyzing elemental map data (distribution data of X-ray intensity or concentration for each element) acquired using a surface analyzer such as an electron probe microanalyzer (EPMA). The term “phase analysis” refers to a method of extracting phases of compounds from a correlation between a plurality of elements and determining a correlation for each phase. For example, JP-A-2015-219217 discloses a method of generating a phase map indicating a distribution of a phase of a compound from elemental map data.[0004]FIG. 24 illustrates ...

Claims


Application Information

Patent Timeline
IPC IPC(8): G06T11/00G06T11/60G06T11/20G01T1/36
CPCG06T11/005G06T11/60G06T11/206G06T11/008G01T1/36G06T2207/10116G01N23/2252G01N2223/402G01N2223/605
Inventor KATOH, NAOKIMORI, NORIHISA
Owner JEOL LTD
Why Eureka
Try Eureka