
Speckle contrast analysis using machine learning for visualizing flow

a contrast analysis and flow technology, applied in the field of image analysis using machine learning, can solve the problems of blood vessels not always near the surface of a tissue, not always easily imaged, blurred or low contrast image characteristics, etc., and achieve the effect of reducing the difficulty of image processing, and improving the accuracy of image processing

Active Publication Date: 2019-02-28
VERILY LIFE SCI LLC
View PDF0 Cites 9 Cited by
  • Summary
  • Abstract
  • Description
  • Claims
  • Application Information

AI Technical Summary

Benefits of technology

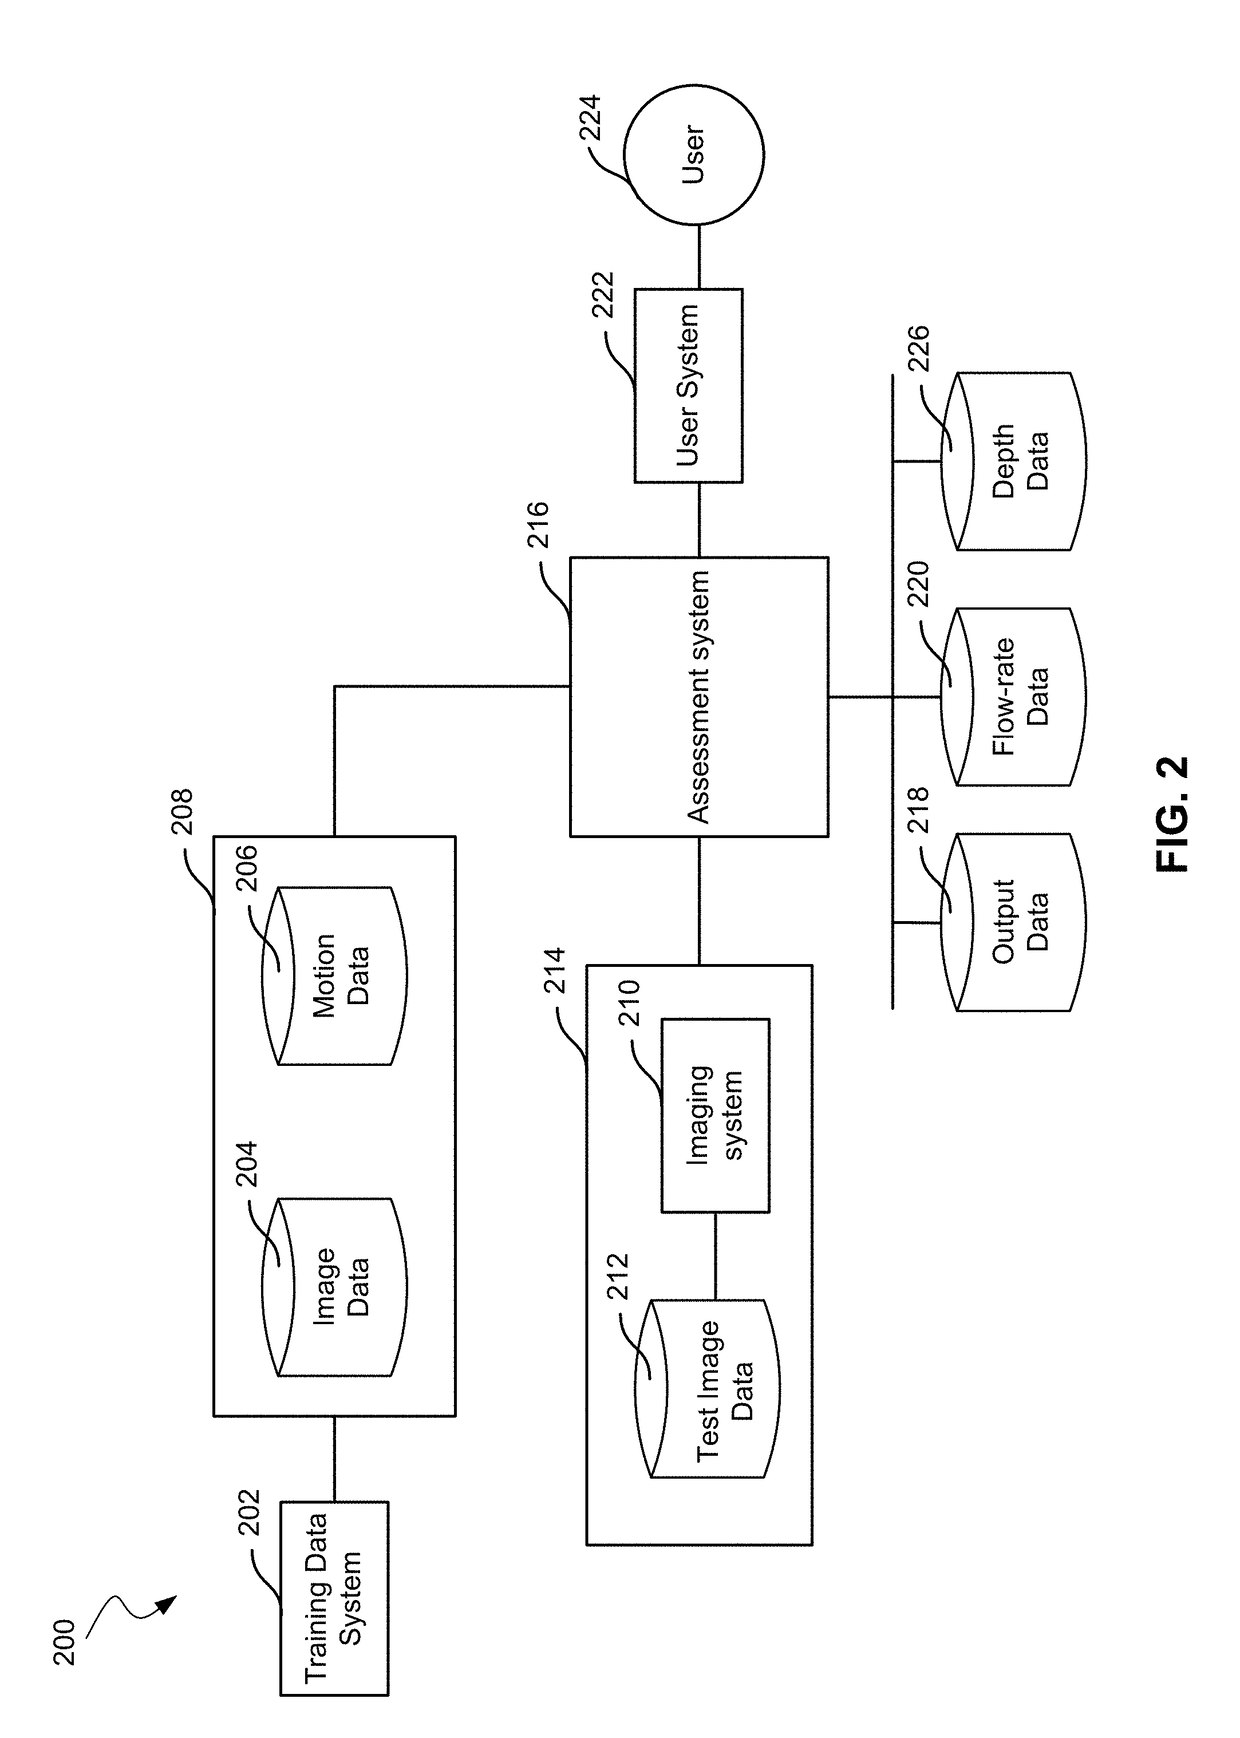
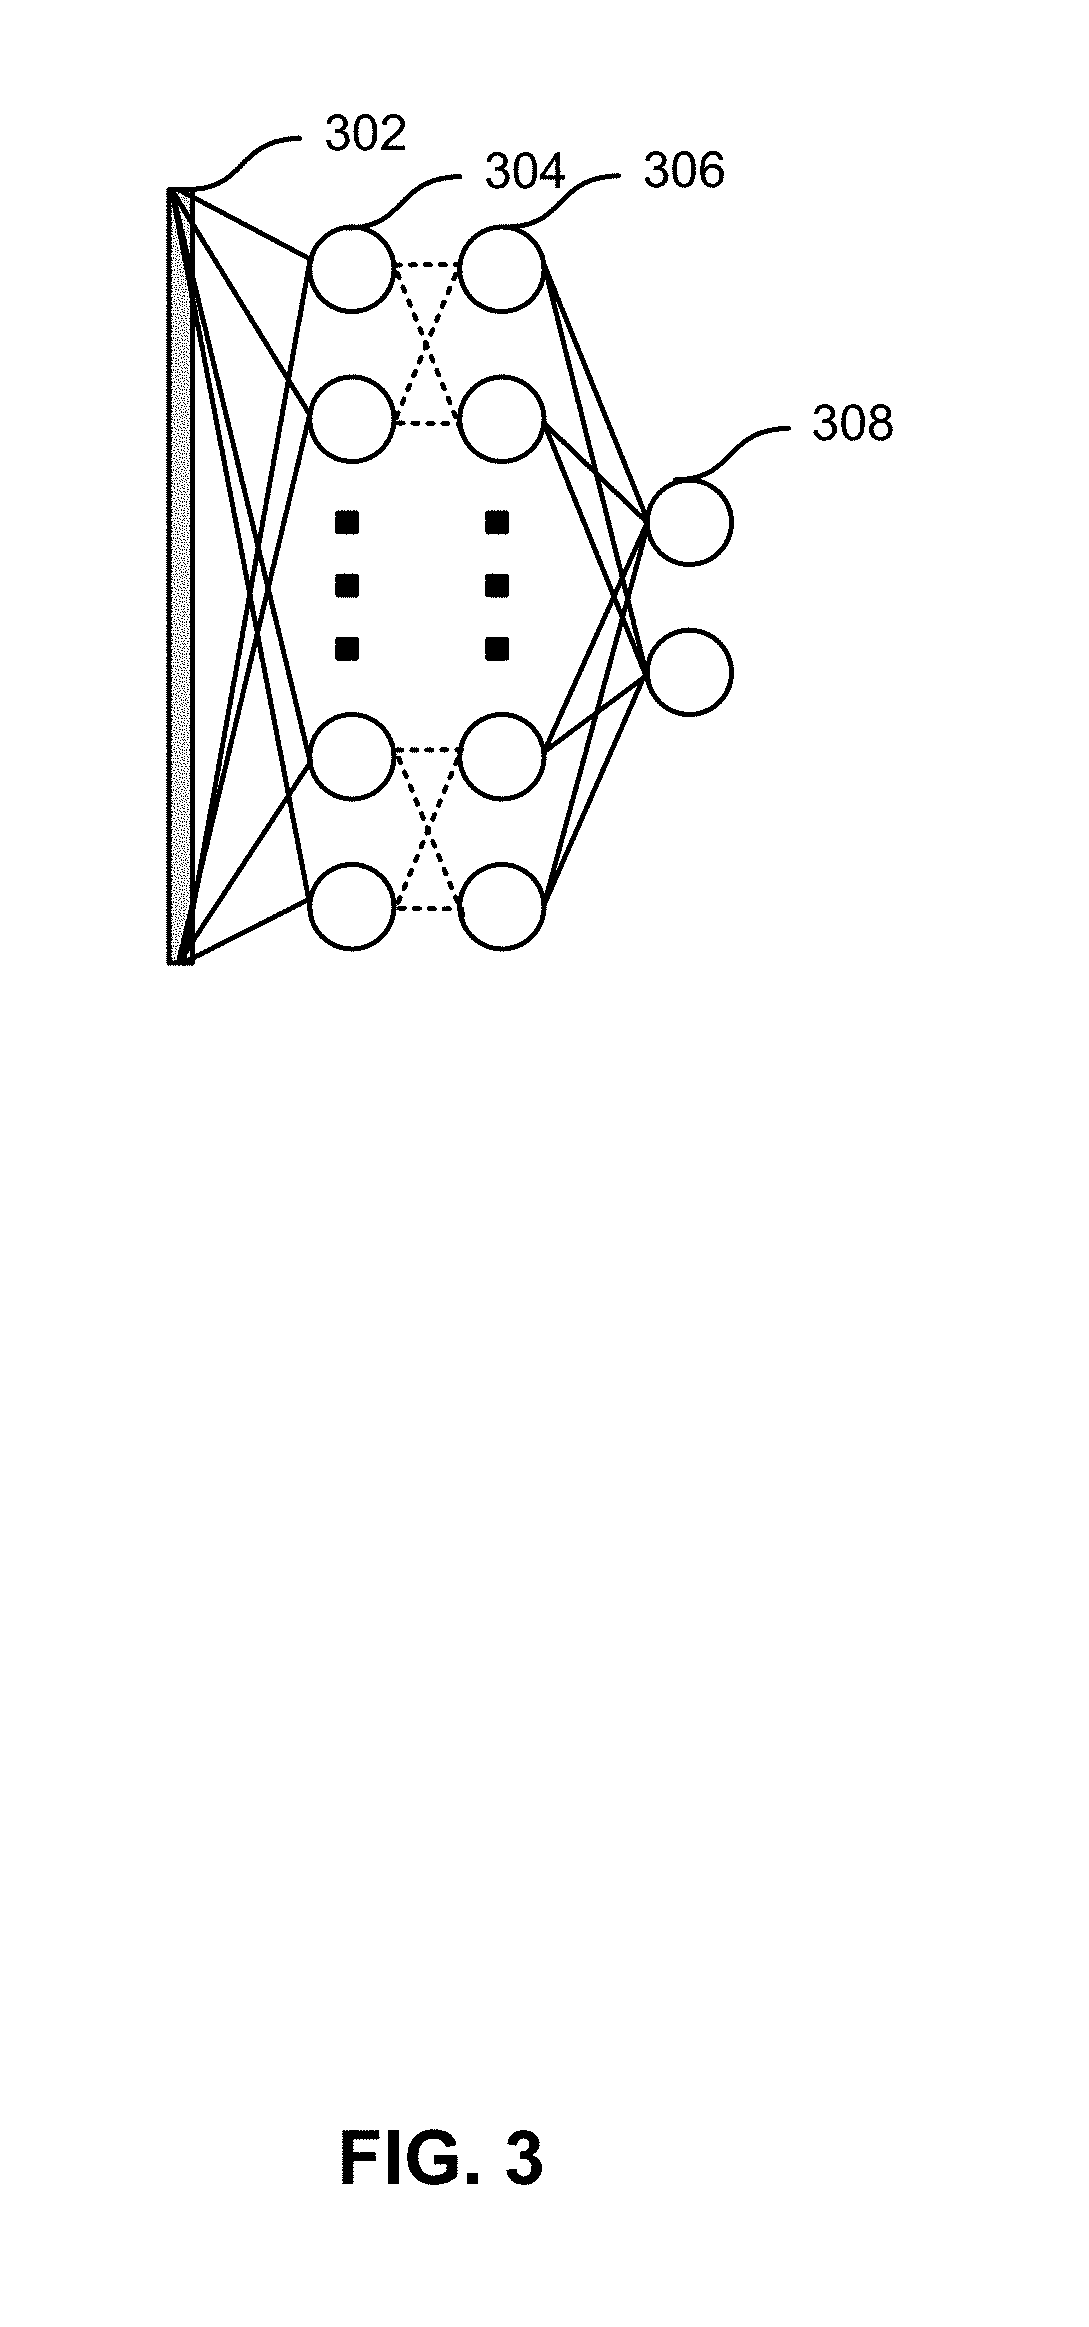
The patent describes a method and system for using machine learning to analyze images and identify characteristics of motion. These characteristics can then be used to estimate the flow rates of liquids or gases in a sample. The system receives a training data set with image data and motion data, and uses this information to create a machine learning model that can characterize the motion in new images. This approach provides a more accurate and reliable way to measure motion in images, which can be useful in various fields such as medical diagnostics or sports equipment design.

Problems solved by technology

However, blood vessels are not always near the surface of a tissue and not always easily imaged.
Blood that flows deeper in a tissue may be more difficult to detect in an image.
As a result, image characteristics related to the flow of blood, such as blurring or low contrast, may be difficult to identify in an unprocessed image.

Method used


Image

  • Speckle contrast analysis using machine learning for visualizing flow
  • Speckle contrast analysis using machine learning for visualizing flow
  • Speckle contrast analysis using machine learning for visualizing flow

Examples


example 1

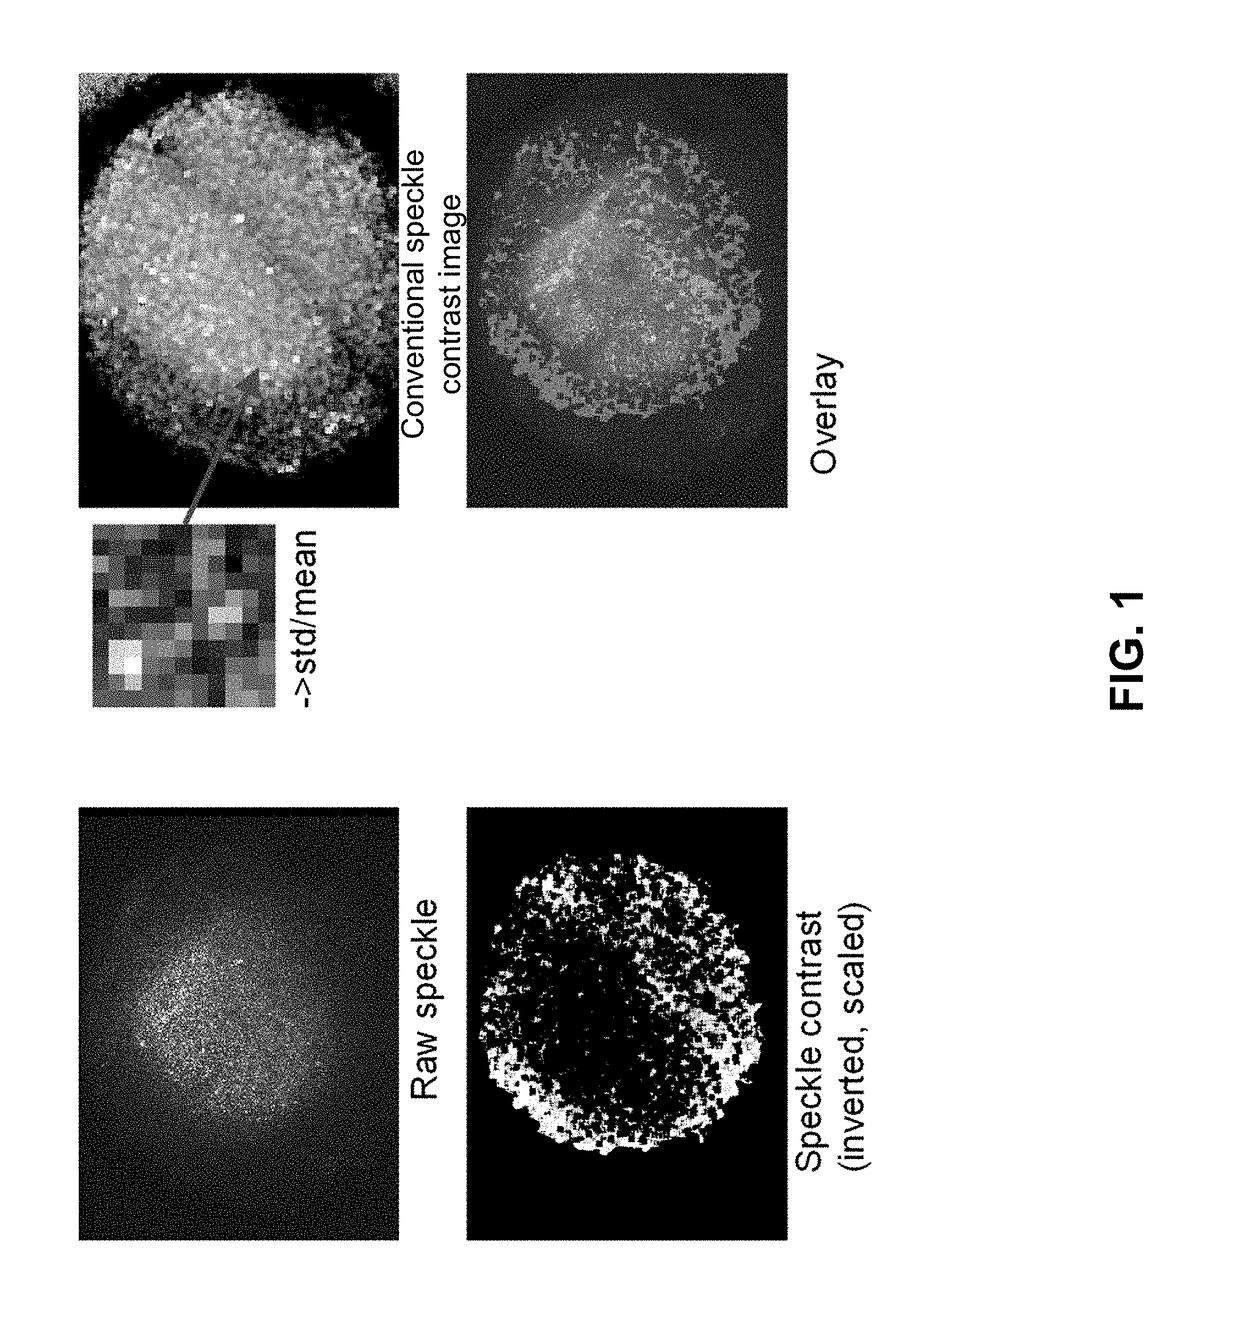
[0061]FIG. 9 shows the ground truth label and image data used for training a machine learning model. FIG. 9 shows images of the same sample used in FIG. 1. The sample is an artificial construct of subsurface blood flow in live tissue. The sample included plastic tubing with blood flow sandwiched between two layers of pork meat.

[0062]In this example, the raw data image is shown in the upper left. The image in the upper right shows the raw data image labeled with an overlay showing the ground truth label for flow, based on a photograph with the top meat layer removed. The labeled areas of flow are used as the motion data set for training. The motion data set indicated the probability of each pixel having flow, where 1 indicates flow and 0 indicates static (no flow). The image data set for training is an incomplete subset of randomly selected pixels from the raw data image and the intensities of each pixel of the randomly selected pixels. The lower left image shows darker bands that ma...

example 2

[0063]FIG. 10 shows images of different regions of interest in the top row and intensity histograms of the different regions in the bottom row. The different regions of interest are labeled as 1 as having flow or 0 for not having flow based on a ground truth flow map. The histograms show intensity on the x-axis and number of pixels having the intensity on the y-axis. The histogram distributions of the intensities of the regions labeled with flow have different distributions than those regions labeled as having no flow. For example, regions with flow show histogram distributions that are narrower than those without flow. The machine learning model may use the shape or other characteristics of a histogram distribution as a parameter or hidden variable in training.

example 3

[0064]FIG. 11 shows raw images and output data indicating flow in the raw images generated by a logistic regression machine learning model. The images in FIG. 11 are the results from training using the training targets and validation targets from FIG. 9. Red pixels show areas identified by the machine learning model as having a greater than 50% probability of having flow. The statistics of regions of interest considered for training were the standard deviation divided by the mean, median, skewness, and the minimum. The training and testing was used with different size regions. The upper left images show results with a 7×7 region. The upper right images show results with a 11×11 region. The lower left images show results with a 15×15 region. The lower right images show results with a 19×19 region. The results with a 7×7 region shows more noise by identifying many isolated pixels as having flow. The 11×11 region shows fewer isolated pixels as having flow. Larger regions of interest ma...


PUM


Abstract

Embodiments may include a method to estimate motion data based on test image data sets. The method may include receiving a training data set comprising a plurality of training data elements. Each element may include an image data set and a motion data set. The method may include training a machine learning model using the training data set, resulting in identifying one or more parameters of a function in the machine learning model based on correspondences between the image data sets and the motion data sets. The method may further include receiving a test image data set. The test image data set may include intensities of pixels in a deep-tissue image. The method may include using the trained machine learning model and the test image data set to generate output data for the test image data set. The output data may characterize motion represented in the test image data set.

Description

CROSS-REFERENCE TO RELATED APPLICATION[0001]This application claims the benefit of U.S. Application No. 62 / 511,997, filed Aug. 30, 2017, titled “Speckle Contrast Analysis Using Machine Learning for Visualizing Flow,” which is incorporated herein by reference in its entirety.FIELD[0002]Embodiments are directed toward the field of image analysis using machine learning. In particular, embodiments are directed toward analyzing flow of bodily fluids in deep tissue.BACKGROUND[0003]Being able to visualize blood flow in live tissue may aid with medical diagnoses or medical procedures, including surgical procedures. Imaging techniques may be sensitive enough to identify areas of blood flow near the surface of tissue without significant processing of the image data. However, blood vessels are not always near the surface of a tissue and not always easily imaged. Blood that flows deeper in a tissue may be more difficult to detect in an image. For blood vessels located far below the tissue surfa...

Claims


Application Information

Patent Timeline
IPC IPC(8): G06K9/62G06N99/00G16H30/20
CPCG06N20/00G16H30/20G06K9/6256G06K9/6262G06T7/0012G06T7/246G06V10/774G06V10/778G06V10/82G06N3/04G06N3/08G06T2207/20081G06T2207/20084G06T2207/30104G06T7/20G06F18/217G06F18/214
Inventor REPHAELI, EDENPIPONI, DANIELEBELTHANGADY, CHINMAYLEE, SEUNG AH
Owner VERILY LIFE SCI LLC
Learn More