Glycoprotein biomarkers for esophageal adenocarcinoma and barrett's esophagus and uses thereof

Inactive Publication Date: 2019-03-07
THE UNIV OF QUEENSLAND
0 Cites 1 Cited by

AI-Extracted Technical Summary

Problems solved by technology

This is likely due to late stage diagnosis: approximately two thirds of patients who are diagnosed have advanced-stage disease, at which point current therapies are largely ineffective.
However, these endoscopic screening programs have limitations associated with sampling error, variability in assessment of biopsies between practitioners, and tissue heterogeneity.
Moreover, even with these endoscopic screening programs, more than 80% of EACs are diagnosed ...

Method used

[0133]In particular embodiments of the methods of the invention, the level of a glycospecies is assessed by detecting the binding of the glycospecies to an appropriate glycan-binding molecule. In one example, the glycan-binding molecule is a lectin. Lectins are proteins or glycoproteins that bind to all or part of a glycan structure. A lectin may bind to a specific glycan moiety that is part of a glycoprotein or another glycan-containing molecule such as a glycolipid, glycophosphatidylinositol or glycosaminoglycan. Lectins are capable of binding to specific glycans. Advantageously, the high specificity of a lectin for a particular glycan moiety facilitates the precipitation, isolation and/or detection of glycoproteins with a particular single types of glycosylation from or in a biological sample by specifically binding to those types of glycosylation.
[0155]Immunotherapy approaches, include for example ex-vivo and in-vivo approaches to increase the immunogenicity of patient tumor cells, such as transfection with cytokines such as interleukin 2, interleukin 4 or granulocyte-macrophage colony stimulating factor, approaches to decrease T-cell anergy, approaches using transfected immune cells such as cytokine-transfected dendritic cells, approaches using cytokine-transfected tumor cell lines and approaches using anti-idiotypic antibodies. These approaches generally rely on the use of immune effector...

Benefits of technology

[0007]The present invention thus represents a significant advance over current technologies for the management of EAC and BE. In certain advantageous embodiments, it relies upo...

Abstract

Disclosed are biomarkers for Barrett's esophagus and esophageal adenocarcinoma, and uses thereof, such as in methods for detecting the presence, and monitoring progression, of Barrett's esophagus and esophageal adenocarcinoma. Also disclosed are methods for treating and methods of monitoring the treatment of Barrett's esophagus and esophageal adenocarcinoma, as well as kits and compositions for use in such methods.

Application Domain

Health-index calculationMedical automated diagnosis +2

Technology Topic

GlycoproteinBiomarker (petroleum) +4

Image

  • Glycoprotein biomarkers for esophageal adenocarcinoma and barrett's esophagus and uses thereof
  • Glycoprotein biomarkers for esophageal adenocarcinoma and barrett's esophagus and uses thereof
  • Glycoprotein biomarkers for esophageal adenocarcinoma and barrett's esophagus and uses thereof

Examples

  • Experimental program(4)

Example

Example 1
Identification of Biomarkers for EAC
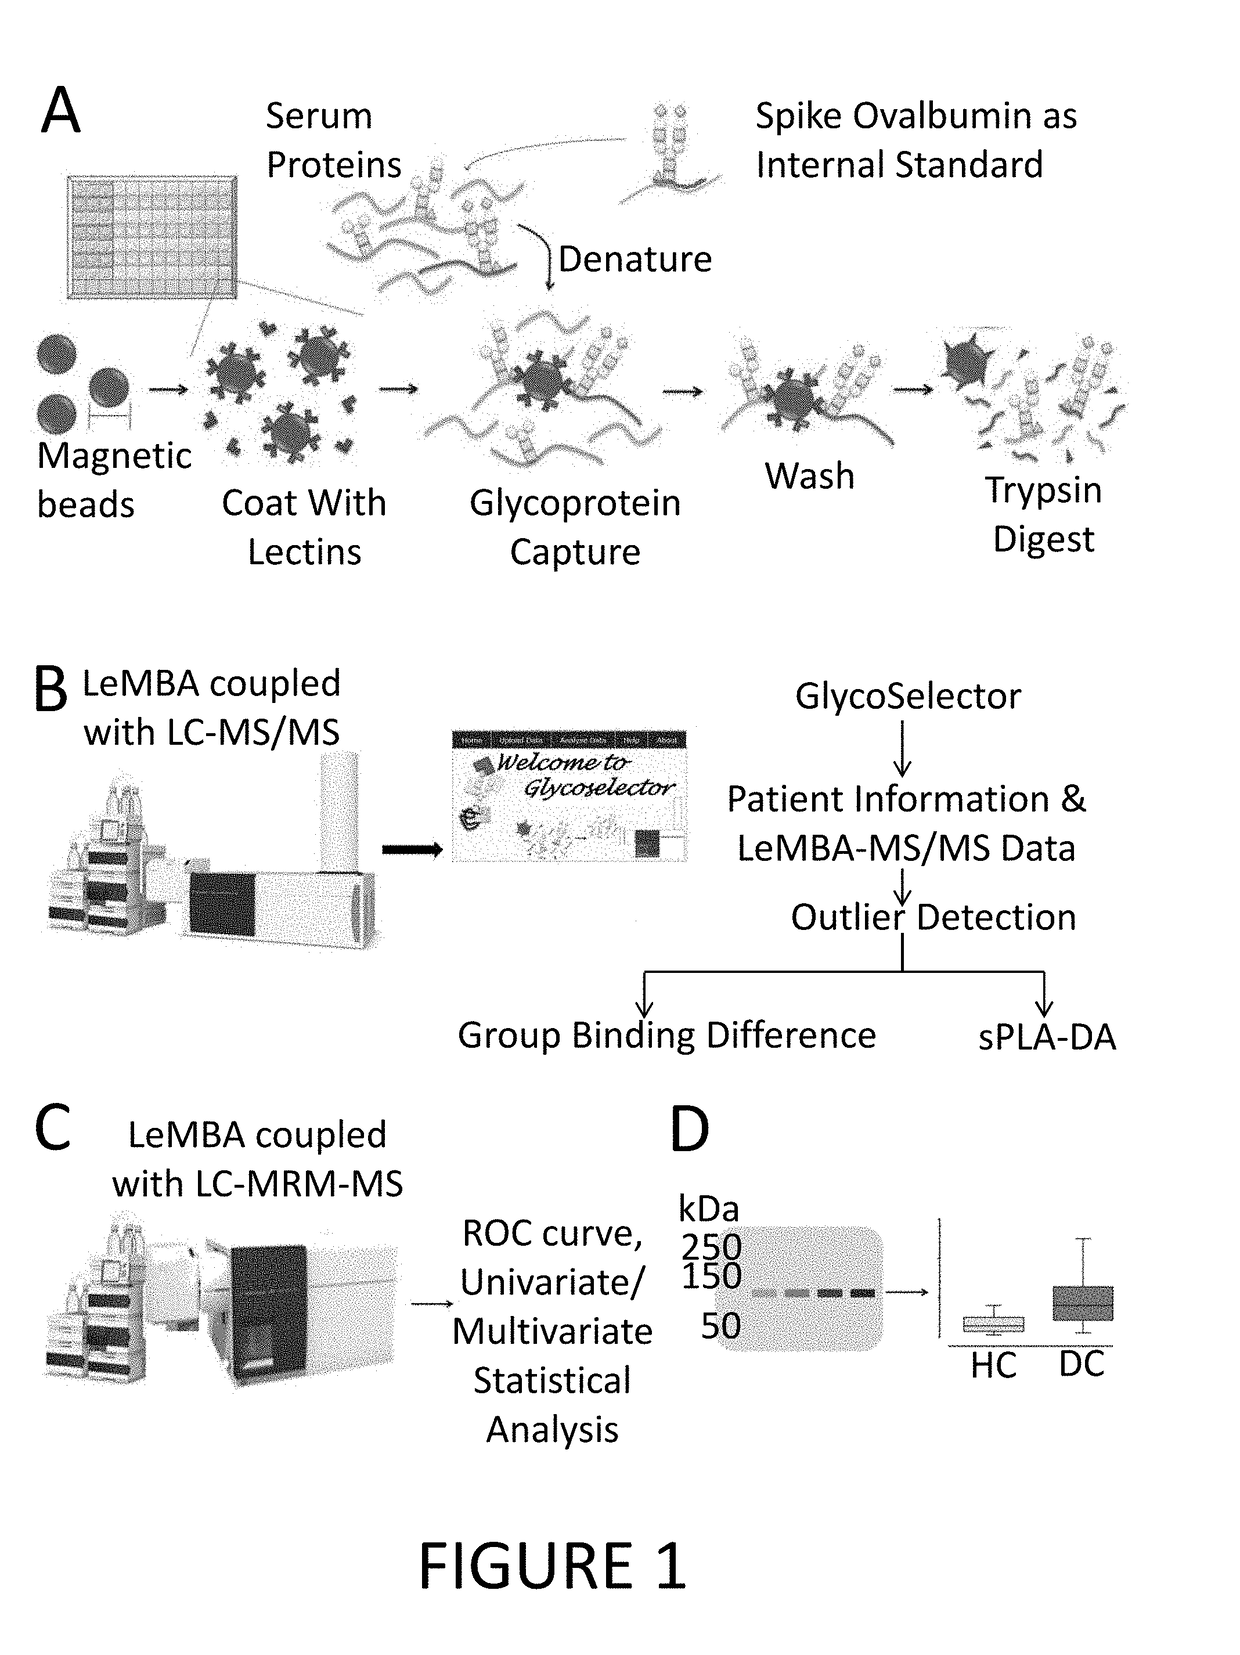
[0170]To identify biomarkers for EAC and BE, the abundance of proteins with altered glycosylation structures (i.e. different glycospecies) in the serum of healthy patients, patients with BE and patients with EAC was assessed using lectin-magnetic bead array-coupled mass spectrometry (LeMBA-MS) essentially as described by Choi et al. (Electrophoresis (2011) 32, 3564-3575). A schematic of the biomarker identification protocol is shown in FIG. 1.
Materials and Methods
Sample Preparation
[0171]In the discovery phase, 29 serum samples (TABLE 8), consisting of 10 each of BE, EAC and 9 healthy controls (4 confirmed BE-free from Study of Digestive Health and 6 population controls from Australian Cancer Study), were analysed. One of the control patients subsequently developed BE, so the data were excluded from further analysis. All of the patients were male, reflecting the male-dominance of EAC and BE.
[0172]The serum samples were denatured by heating in denaturing buffer (20 mM Tris-HCl pH 7.4, 1% w/v SDS, 5% v/v Triton X-100 and 20 mM dithiothreitol (DTT) at 60° C. for 30 minutes, followed by alkylation with 100 mM iodoacetamide for 1 hr at 37° C., maintaining a dark condition, prior to dilution for lectin pulldown. 50 μg alkylated serum sample per reaction was incubated with lectin conjugated beads in 100 μl binding buffer (20 mM Tris-HCl pH 7.4, 300 mM NaCl, 1 mM CaCl2, 1 mM MnCl2, 0.05% w/v SDS, 1% v/v Triton X-100) at 4° C. for 1 hour on a plate shaker.
[0173]Following the glycoprotein capture, beads were washed three times with binding buffer, seven times with 50 mM ammonium bicarbonate with three changes of plates during wash steps. 0.95 μg of sequencing grade trypsin in 20 μl of 50 mM ammonium bicarbonate was added to each reaction mixture and incubated at 37° C. overnight for on-bead trypsin digest. On the following day, digested peptides were transferred to a new plate. Beads were washed with equivalent volume of 50 mM ammonium bicarbonate and supernatant was combined with digested peptides. Pooled peptide samples were dried under the vacuum and plates were stored at −80° C. until further use. Bravo liquid handler (Agilent Technologies) was used to make the platform high-throughput.
[0174]LC-MS/MS and Database search for Biomarker Discovery
[0175]The samples are resuspended in 20 μl of 0.1% v/v formic acids for LC-MS/MS. Depending upon lectin used for pull-down, optimal amount of tryptic peptides were subjected to LC-MS using Agilent 6520 QTOF coupled with a Chip Cube and 1200 HPLC (9 μl were loaded for HAA, HPA and UEA, 6 μl for NPL, STL, GNL, 5 μl for BPL, DSA, ECA, MAA, SBA, WFA and WGA, 4 μl for AAL, SNA, LPHA, PSA and JAC, 1 μl for EPHA and ConA). The nano pump was set at 0.3 μl/min and the capillary pump at 4 μl/min The HPLA-chip used contains 160 nl C18 trapping column, and 75μm×150 mm 300 Å C18 analytical column (G4240-62010 Agilent Technologies). Buffer A was 0.1% v/v formic acid and Buffer B was 90% v/v acetonitrile containing 0.1% v/v formic acid. Peptides were eluted from the column using gradient from 6% B to 46% B at 45 minutes. Nano pump % B was increased to B at 45.5 min and maintained at the level till 55.5 min. It decreased to original 6% B at 58.5 minutes. The mass spectrometry was operated in 2 GHz extended dynamic range and programmed to acquire 8 precursor MS1 spectra per second and 4 MS/MS spectra for each MS spectra. Dynamic exclusion was applied after 2 MS/MS within 0.25 minutes. Exclusion for lectin peptides was applied. The QTOF was tuned and calibrated prior to the analysis. One hundred femtomold/μl of pre-digested bovine serum albumin peptides were used as quality control, before and after each plate. Levels of reference ions 299.2945 and 1221.9906 were maintained at minimum 5000 and 1000 counts respectively.
[0176]To account for experimental variations, 10 pmol chicken ovalbumin, a glycoprotein that binds to every lectin, was spiked in to each sample as internal standard so as to calculate a normalisation factor for each identified protein. LeMBA-MS/MS was then performed by first isolating serum glycoproteins using a lectin-magnetic bead array that included a panel of 20 lectins (shown in TABLE 9), then performing on-bead tryptic digestion of the glycoproteins followed by LC-MS/MS using an Agilent 6520 QTOF couple with a Chip CUBE and 1200 HPLC, as described by Choi et al. (Electrophoresis (2011) 32, 3564-3575). The resulting raw data file was processed with Spectrum Mill software for database searching against the SwissProt human database to identify the glycoproteins.
TABLE 8 DISCOVERY PHASE PATIENT SAMPLES Condition Parameter Healthy (n = 9) BE (n = 10) EAC (n = 10) Age in years 66 ± 10 62 ± 15 66 ± 8 (median ± SD) Cardiovascular 5 3 3 complications Type 2 diabetes 1 0 1 Gastritis 1 1 1 Peptic ulcer 3 2 3 Other 1 2 2 malignancy
TABLE 9 LECTINS USED IN LEMBA-MS Lectin Abbreviation Lectin source General reactivity Known target(s) BPL Bauhinia purpurea α/β-D-Galactose Galβ1-3GalNAc lectin ECA Erythrina cristagalli α/β-D-Galactose Galβ1-4GlcNAc agglutinin JAC Jacalin α/β-D-Galactose Galα1-6GalNAc and Galβ1-3GalNAc SBA Soybean agglutinin D-N- GalNAcα1-3Gal Acetylgalactosamine HPA Helix pomatia D-N- α-GalNAc agglutinin Acetylgalactosamine WFA Wisteria floribunda D-N- GalNAcα1-6Gal and agglutinin Acetylgalactosamine GalNAcα1-3GalNAc DSA Datura stramonium D-N- β1-4GlcNAc lectin Acetylglucosamine oligomers HAA Helix aspersa D-N- α-GlcNAc and α- agglutinin Acetylglucosamine GalNAc STL Solanum tuberosum D-N- GlcNAcβ1-4GlcNAc lectin Acetylglucosamine oligomers WGA Wheat germ D-N- GlcNAcβ1-4GlcNAc agglutinin Acetylglucosamine and Neu5Ac ConA Concanavalin A D-Mannose α-Man, α-Glc, and α- GlcNAc GNL Galanthus nivalis D-Mannose Manα1-3Man lectin NPL Narcissus D-Mannose Manα1-6Man lectin AAL Aleuria aurantia α-L-Fucose Fucα1-2, -3, -6 linked lectin PSA Pisum sativum α-L-Fucose Fucα1-6GlcNAc of agglutinin N-linked glycans UEA Ulex europeus α-L-Fucose Fucα1-2Galβ1- agglutinin-I 4GlcNAc MAA Maackia amurensis Sialic acid Neu5Acα2-3Galβ1-3 agglutinin-II linkages SNA Sambucus nigra Sialic acid Neu5Acα2-6 linkages agglutinin E-PHA Erythroagglutinating Complex specificities Bisecting GlcNAc phytohemagglutinin L-PHA Leukoagglutinating Complex specificities Tri/tetra-antennary phytohemagglutinin β1-6GlcNAc
[0177]The multi-dimensional data from the LeMBA-MS were stored in the GlycoSelector database as lectin-protein pairs with the measured total MS1 intensity for the proteins, and the corresponding internal standard file for the sample. GlycoSelector was then used to perform sample outlier detection (FIG. 2) and classification of the glycoproteins by pairwise comparison of the patient groups. Sparse partial least squares regression-discriminant analysis (sPLS-DA, Le Cao et al. (2011) BMC bioinformatics 12, 253) was used to select a ranked list of lectin-protein pairs that classified between 2 groups. As an example, the sPLS-DA plot in FIG. 3a shows clear separation of BE and EAC using the top 100 lectin-protein pairs. Out of the top 100 lectin-protein pairs, 82 candidates passed the stability cut-off of 0.6 (FIG. 3b). There was considerable overlap between lectin protein candidates identified between healthy vs. BE, BE vs. EAC and healthy vs. EAC patient groups (FIG. 3c). Each of the 20 lectins used for biomarker discovery showed differential binding with at least one candidate (FIG. 3d). For orthogonal verification of the LeMBA-MS screen by immunoblotting, we chose two candidates with available antibodies, which showed altered binding to AAL lectin. AAL-haptoglobin was one of the top ranked stable candidate in sPLS-DA analysis between healthy vs. EAC and BE vs. EAC while AAL-gelsolin was identified using group binding difference feature of GlycoSelector as on-off change between BE vs. EAC and healthy vs. EAC. Using the same set of discovery serum samples, we performed AAL lectin pull-down, and measured haptoglobin and gelsolin binding by immunoblotting. A control serum sample was loaded on every blot as a normaliser between membranes. Protein level verification by immunobloting confirmed the MS/MS results (FIG. 3e, 3f), but showed higher sensitivity by detecting low levels of gelsolin in all the patient samples, when some were undetectable by MS/MS.
[0178]To feasibly verify a list of candidates identified in biomarker discovery screen in an independent cohort of samples (20 healthy, 21 BE, 20 EAC, with all groups having a median age of between 60 and 64 years), multiplexed MRM-MS was optimized for 41 target protein candidates and LeMBA was performed using 6 lectins (AAL, EPHA, JAC, NPL, PSA and WGA). Linearity of the MRM method was determined by spiking range of dilutions of stable isotope standard (SIS) peptide, spanning 3125 fold dilution range into constant amount of LeMBA pull-down sample. The amount of SIS peptide spiked-in for each of four peptides was adjusted in such a manner that response from 1× labeled peptide mix fall within 5-fold range of the cognate natural peptide. The reproducibility of the dynamic MRM method was determined by running the same sample in triplicate for four consecutive days. Analysis showed that 86% of the peptides in MRM method showed % CV below 10% while 9% of peptides showed % CV between 10-20% and only 5% of the peptides were above 20%. Furthermore, % CV for the entire MRM-MS analysis for SIS as well as natural internal standard chicken ovalbumin peptide was below 20% suggesting robust performance of the LeMBA-MRM-MS method. To account for any variation during LeMBA pull-down and mass spectrometric measurements, we utilized two normalization procedures. Firstly, natural ovalbumin peptide intensity was normalized by spiked-in SIS ovalbumin peptide. Secondly, the intensity of all measured peptides of target proteins was normalized using normalized intensity of natural ovalbumin peptide. Univariate statistical analysis using Kruskal-Wallis tests was performed to assess statistical significance of each of the candidates. Area under Receiver Operating Characteristic (AUROC) was calculated to measure the diagnostic potential of each marker and comparison was made between healthy vs. BE, BE vs. EAC and healthy vs. EAC phenotypes (see, TABLE 12).
Results
[0179]Out of total 246 lectin-protein candidates quantified, 148 candidates showed p-value ess than 0.05.
[0180]TABLE 10 shows the relative increase or decrease of exemplary differentially glycosylated proteins in the serum of patients with EAC compared to healthy patients, BE compared to healthy patients, and in the serum of patients with EAC compared to patients with BE, i.e. the relative abundance of the specific glycospecies. For example, eight proteins (P00751: complement factor B, P01011: alpha-l-antichymotrypsin, P01031: complement C5,
[0181]P02748: complement component C9, P02790: hemopexin, P04003: C4b-binding protein alpha chain, P05155: plasma protease Cl inhibitor, P05546: heparin cofactor 2) having glycans that facilitated binding to JAC (i.e. the JAC-binding glycospecies of complement factor B, the JAC-binding glycospecies of alpha-l-antichymotrypsin, the JAC-binding glycospecies of complement C5, the JAC-binding glycospecies of complement component C9, the JAC-binding glycospecies hemopexin, the JAC-binding glycospecies of C4b-binding protein alpha chain and the JAC-binding glycospecies of plasma protease Cl inhibitor, and the JAC-binding glycospecies of heparin cofactor 2) were increased in the serum of patients with EAC compared to healthy patients.
TABLE 10 RELATIVE ABUNDANCE OF GLYCOSPECIES Lectin Proteins (by SwissProt Acc. No.) (glycan) EAC vs HC BE vs HC EAC vs BE AAL ↑ P02748 ↑ P00738, P01031, P02748, (Fuc α1,2,3,6 P10643 linked) ↓ P06396 ↓ P04114, P06396 PSA ↑ P00738, P02748 ↑ P00738, P01011, P02748, (Fuc α1- P01031, P10643 6GlcNAc) ↓ P06396 ↓ P06396 EPHA ↑ P00738, P02748 ↑ P01023 ↑ P00738, P01011, P02748, (Bisecting P02787, P10643 GlcNAc) ↓ P01023, P02765, ↓ P06396 P06396 JAC ↑ P00751, P01011, ↑ P04114 ↑ P00738, P00751, P01009, (Galβ1- P01031, P02748, P02790, P01011, P01031, P02748, 6GalNAc, P04003, P05155, P05546 P04217, P10643 Galβ1- ↓ P06396 ↓ P06396 3GalNac) NPL ↑ P00738, P01011, ↑ P04114 ↑ P02748 (Mannose P02748, P04003 α1-3Man) ↓ P04114, P06396, P43652 WGA ↑ P00738, P02748, ↑ P00738, P02748 (GlcNAcβ1- P01011 4GlcNAc and ↓ P06396 Neu5Ac)
[0182]FIG. 4 shows the relative abundance of exemplary glycospecies that were demonstrated to be significantly increased or decreased in at least two of EAC, BE and healthy subjects, and which could thus be used to distinguish between healthy, pre-cancer (BE) patients and EAC patients, and therefore determine the likelihood of the presence or absence of EAC. For example, the AAL-binding gelsolin (P06396) and PSA-binding gelsolin glycospecies were present in the serum of EAC patients at significantly reduced levels compared to the serum of BE patients. Conversely, the AAL-binding complement component C9 (P02748), AAL-binding complement component C9, and EPHA-binding haptoglobin (P00738) glycospecies were present in the serum of EAC patients at significantly increased levels compared to the serum of BE patients. FIGS. 3 show the relative abundance of exemplary glycospecies that were demonstrated to have a statistically significant increase or decrease in amount (as assessed using an ANOVA-Tukey test) in the serum of BE patients compared to healthy patients, and which could thus be used to distinguish healthy patients from pre-cancer patients with EAC.
[0183]FIG. 4 shows LeMBA-MS data for gelsolin. Specifically, the Y-axis shows relative abundance (note the log scale), and the X-axis shows the binding to each of the 20 lectins, grouped into general reactivity groups. Boxed lectins show statistically significantly different binding between BE and EAC groups (*p<0.05, Student's t-test). The graph clearly shows that the gelsolin glycospecies that most clearly distinguish between BE and EAC based on their relative abundance, and in particular NPL-binding gelsolin, JAC-binding gelsolin, PSA-binding gelsolin and GNL-binding gelsolin, which are significantly reduced in the serum of EAC patients compared to BE patients, suggesting a reduction in multiple glycan structures on gelsolin in EAC patients.

Example

Example 2
Detecting Combinations of Glycospecies
[0184]In order to determine whether a particularly robust set of markers could selected in order to improve the determination of the likelihood of the presence or absence of BE or EAC in a subject, combinations of glycospecies identified from the relevant table (TABLES 1, 4, and 6) were analysed.
[0185]It was found that the power of the diagnostic test could be enhanced by measuring a panel of two, three, four, five, or more than five markers (see, TABLE 11). Notably, when using four glycospecies (JAC-binding complement component C9, EPHA-binding alpha-1B-glycoprotein, EPHA-binding gelsolin, WGA-binding angiotensin and alpha-2-macroglobulin) are measured between subjects with EAC and healthy controls, an AUC of up to 98.25% can be achieved.
TABLE 11 AUC Glycospecies (EAC v Healthy) P02748_JAC 0.775 P02748_JAC P04217_EPHA 0.86 P02748_JAC P04217_EPHA P06396_EPHA 0.93 P02748_JAC P04217_EPHA P06396_EPHA P01019_WGA 0.9825 P02748_JAC P04217_EPHA P06396_EPHA P01019_WGA P01023_NPL 0.98 P02748_JAC 0.775 P02748_JAC P06396_EPHA 0.8475 P02748_JAC P06396_EPHA P02748_WGA 0.8525 P02748_JAC P06396_EPHA P02748_WGA P02748_NPL 0.8525 P02748_JAC P06396_EPHA P02748_WGA P02748_NPL P06396_SNA 0.86 Glycospecies (EAC v BE) P02748_AAL 0.8525 P02748_AAL P02748_JAC 0.835 P02748_AAL P02748_JAC P02748_PSA 0.8375 P02748_AAL P02748_JAC P02748_PSA P02748_EPHA 0.8425 P02748_AAL P02748_JAC P02748_PSA P02748_EPHA P02748_WGA 0.8375 P02748_AAL 0.8525 P02748_AAL P04114_NPL 0.91 P02748_AAL P04114_NPL P04217_EPHA 0.9625 P02748_AAL P04114_NPL P04217_EPHA P01781_PSA 0.975 P02748_AAL P04114_NPL P04217_EPHA P01781_PSA P0C0L5_WGA 0.985
TABLE 12 DIFFERENTIAL EXPRESSION OF GLYCOSPECIES Glycospecies Kruskal- (Lectin-SwissProt Wallis No) p-value AUROC BE vs EAC AAL_P00738 0.0398 0.69 EPH_P00738 0.0200 0.715 JAC_P00738 0.0483 0.6825 PSA_P00738 0.0483 0.6825 WGA_P00738 0.0483 0.6825 JAC_P00751 0.0398 0.69 JAC_P01009 0.0453 0.685 EPH_P01011 0.0265 0.705 JAC_P01011 0.0102 0.705 PSA_P01011 0.0425 0.6875 AAL_P01031 0.0483 0.6825 JAC_P01031 0.0398 0.69 PSA_P01031 0.0453 0.685 AAL_P02748 0.0001 0.8525 EPH_P02748 0.0003 0.8375 JAC_P02748 0.0007 0.8125 NPL_P02748 0.0049 0.76 PSA_P02748 0.0008 0.81 WGA_P02748 0.0032 0.7725 EPH_P02787 0.0326 0.6975 AAL_P04114 0.0483 0.6825 NPL_P04114 0.0248 0.7075 JAC_P04217 0.0483 0.6825 AAL_P06396 0.0087 0.7425 EPH_P06396 0.0186 0.7175 JAC_P06396 0.0305 0.7 NPL_P06396 0.0173 0.72 PSA_P06396 0.0483 0.6825 WGA_P06396 0.0128 0.73 AAL_P10643 0.0063 0.7525 EPH_P10643 0.0398 0.69 JAC_P10643 0.0094 0.74 PSA_P10643 0.0019 0.7875 NPL_P43652 0.0483 0.6825 EAC vs HC AAL_P00738 0.0583 0.675 EPH_P00738 0.0305 0.7 NPL_P00738 0.0349 0.695 PSA_P00738 0.0425 0.6875 WGA_P00738 0.0215 0.7125 JAC_P00751 0.0373 0.6925 JAC_P01011 0.0305 0.7 NPL_P01011 0.0305 0.7 WGA_P01011 0.0080 0.745 EPH_P01023 0.0186 0.7175 JAC_P01031 0.0483 0.6825 AAL_P02748 0.0161 0.7225 EPH_P02748 0.0265 0.705 JAC_P02748 0.0029 0.775 NPL_P02748 0.0074 0.7475 PSA_P02748 0.0161 0.7225 WGA_P02748 0.0049 0.76 EPH_P02765 0.0483 0.6825 JAC_P02790 0.0200 0.715 JAC_P04003 0.0138 0.7275 JAC_P05155 0.0200 0.715 JAC_P05546 0.0483 0.6825 AAL_P06396 0.0265 0.705 EPH_P06396 0.0014 0.795 JAC_P06396 0.0200 0.715 PSA_P06396 0.0110 0.735 BE vc HC EPH_P01023 0.0248 0.7075 JAC_P04114 0.0305 0.7 NPL_P04114 0.0215 0.7125
[0186]While some gelsolin glycospecies were present at similar levels in the serum of healthy, BE and EAC patients (e.g. WGA-binding gelsolin), others were present at statistically different levels in the various groups. For example, glycospecies characterised as being in the serum of EAC patients at significantly reduced amounts compared to BE patients (statistical analysis using the Student's t-test), but were not present in significantly different amounts between healthy and BE patients. These results indicated that there was a reduction in many different glycan structures, including various glycans containing D-Mannose, D-N-Acetylglucosamine, α/β-D-Galactose and α-L-Fucose, in plasma gelsolin proteins of EAC patients compared to BE patients.
[0187]To exclude the possibility that loss of glycosylated gelsolin in EAC was due to an overall loss of gelsolin protein in the serum, immunoblotting with an anti-gelsolin antibody was performed to measure the level to total gelsolin in some of the serum samples. As shown in FIG. 5, there was a non-significant trend towards an increased level of gelsolin in the serum of BE patients compared to healthy and EAC patients, while the amount of AAL-binding and PSA-binding gelsolin was significantly reduced in EAC patients compared to healthy patients (as indicated by gelsolin binding to the two fucose-reactive lectins, AAL and PSA).

Example

Example 3
Validation of Glycospecies Biomarkers
[0188]In order to demonstrate that glycospecies biomarkers can be reliably determine the likelihood of a subject having a relevant condition, a number of the biomarkers were selected for validation in a separate and distinct cohort of subjects.
[0189]TABLE 13 shows the relative increase or decrease of exemplary differentially glycosylated proteins in the serum of patients with EAC compared to healthy patients, BE compared to healthy patients, and in the serum of patients with EAC compared to patients with BE, i.e. the relative abundance of the specific glycospecies. For example, six proteins (P00738: haptoglobin, P00751: complement factor B, P01011: alpha-1-antichymotrypsin, P02748: complement component C9, P09871: complement Cls subcomponent, and P10643: complement component C7) having glycans that facilitated binding to EPHA (i.e. the EPHA-binding glycospecies of haptoglobin, the EPHA-binding glycospecies of complement factor B, the EPHA-binding glycospecies of alpha- 1-antichymotrypsin, the JAC-binding glycospecies of complement component C9, the EPHA-binding glycospecies complement Cls subcomponent, and the EPHA-binding glycospecies of complement component C7) were increased in the serum of patients with EAC compared to healthy patients
TABLE 13 Lectin Proteins (by SwissProt Acc. No.) (glycan) EAC vs HC BE vs HC EAC vs BE AAL ↑ P01009; P01011; ↑ P51884 ↑ P02748, P00734 (Fuc α1,2,3,6 P02748; P04217; linked) P09871; P10643; P19652 ↓ P02679; P02753; ↓ P02753 P06396; P07225; P35858; P43652; Q96PD5 EPHA ↑ P00738; P00751; ↑ P51884 ↑ P00751, P02748 (Bisecting P01011; P02748; GlcNAc) P09871; P10643 ↓ P02679; P02765; ↓ P00734; P02751; ↓ P02749, P06396, P51884, P06396; P33151; Q15166 P68871; Q96PD5 JAC ↑ P00738; P01009; ↑ P00450, P00734; P01011,, (Galα1- P01011, P02748, P02748, P02790, P04217, 6GalNAc, P05155, P09871 P05155, P05156, P08603, P09871, P20851, Q14624 Galβ1- ↓ P02647; P02675; ↓ O95445; P00734; 3GalNac) P02679; P02753; P01019; P02647; P02675; P02765; P02787; P03952; P04114; P04196; P06396; P07225; P07225; P07357; P08603; P03952; P06396; P08697; P29622; P43652; P07225; P29622; P68871 P33151; P35858; P68871; Q7Z7A1; Q96PD5 NPL ↑ P00738, P01009; ↑ P02749 ↑ P02748 (Mannose α1- P01011, P02748, 3Man) P02790; P04217 ↓ P02647; P02765; ↓ P04114; P08697; ↓ P06396 P02787, P06396; P33151; P68871 P07225; P27169; P33151; P35858; P43652; P68871; Q15166; Q96PD5
Materials and Methods
Study Design and Sample Information
[0190]Serum samples were collected from consenting patients undergoing upper gastrointestinal at Ochsner Health Systems, New Orleans, USA. The study was approved by the Human Research Ethics Committees of Ochsner Health Systems and the University of Queensland. Patient diagnosis was according to current practice, endoscopy with histology of biopsy samples, and classified as BE (Barrett's esophagus), EAC (esophageal adenocarcinoma) or healthy (i.e., non-BE/EAC). TABLEe 14 describes the clinical characteristics of patients. Samples were randomized prior to all experiments. The samples were stored at −80° C. until use.
TABLE 14 BE EAC HC Variables Sample size 12 10 16 Gender (% Male) 83% 80% 75% Age (Median ± SD) 71 ± 10 63 ± 10 66 ± 11 Body mass index Healthy (<25) 7 2 2 Overweight (25-30) 2 5 4 Obese (>=30) 3 3 10
Materials and Methods
[0191]MyOne™ Tosyl activated Dynabeads were from Life Technologies. Lectins AAL, EPHA, JAC, and NPL were from Vector Laboratories. Modified sequencing grade trypsin was from Promega. Triton X-100 and sodium dodecyl sulfate solution were from Bio-rad. Tris base, glycine, and sodium chloride were from Amresco. Disodium hydrogen phosphate dihydrate, sodium dihydrogen phosphate dihydrate, and calcium chloride dihydrate were from Ajax Finechem. Manganese chloride was from Univar. Acetonitrile CHROMASOLV® gradient grade was from Sigma. All other reagents including lectins not listed above were from Sigma unless otherwise specified.
Methodologies
[0192]Serum samples were screened using LeMBA-MRM-MS assay with four lectins (AAL, EPHA, JAC, and NPL) as reported previously in Shah et al. 2015 Mol. Cell. Proteomics 14, 3023-3039.
Lectin Magnetic Bead Array (LeMBA)
[0193]Lectins were conjugated with magnetic beads as described previously in Shah et al. Mol. Cell. Proteomics 14, 3023-3039. (2, 3). For each pull down experiment, lectin-beads (AAL, EPHA, JAC, and NPL) were arrayed in each well of a 96 well plate. Serum samples (allowing 50 μg per pull-down as measured by BCA protein assay) were spiked with 10 pmol ovalbumin per reaction as an internal standard. The serum protein mixture was denatured and reduced using denaturing buffer (20 mM Tris-HC1 pH 7.4, 1% w/v SDS, 5% v/v Triton X-100 and 20 mM Dithiothreitol) at 60° C. for 30 min followed by alkylation with 100 mM iodoacetamide for 1 hr at 37° C. in the dark. Alkylated serum sample (50 μg per reaction) was incubated with lectin conjugated beads in 100 μl binding buffer (20 mM Tris-HCl pH 7.4, 300 mM NaCl, 1 mM CaCl2, 1 mM MnCl2, 0.05% w/v SDS, 1% v/v Triton X-100) at 4° C. for 1 hr on a plate shaker to allow glycoprotein-lectin binding. Beads were then washed sequentially with (i) binding buffer 3 times and (ii) 50 mM ammonium bicarbonate seven times, including three plate changes in-between washes. For on-bead trypsin digest, 0.95 μg of sequencing grade trypsin in 20 μl of 50 mM ammonium bicarbonate was added to each reaction mixture and incubated at 37° C. overnight. The next day, digested peptides were transferred to a new plate. Beads were washed with an equivalent volume of 50 mM ammonium bicarbonate, and the supernatant was combined with digested peptides. Peptide samples were vacuum-dried and the plates were stored at −80° C. until further use. Bravo liquid handler (Agilent Technologies) was used to make the platform high throughput.
MRM-MS
[0194]Multiple reaction monitoring-mass spectrometry (MRM-MS) assay was performed on Agilent Technologies 6490 triple quadrupole mass spectrometer coupled with 1290 standard-flow infinity UHPLC fitted with a standard-flow ESI (Jet Stream) source. A customized MRM-MS assay for 114 target proteins was developed and used to measure four lectin pull-downs (AAL, EPHA, JAC, and NPL) for each patient sample independently. Detail strategy for MRM-MS assay development was described in Shah et al. 2015 Mol. Cell. Proteomics 14, 3023-3039.
LC Method Development
[0195]The UHPLC system consisted of a reverse phase chromatographic column
[0196]AdvanceBio Peptide Mapping (150×2.1 mm i.d., 2.7 μm, part number 653750-902, Agilent Technologies) with a 5 mm long guard column. Mobile phase A consisted of 0.1% formic acid, and mobile phase B consisted of 100% acetonitrile and 0.1% formic acid. The UHPLC system was operated at 60° C., with a flow rate of 0.4 mL/min The gradient used for peptide separation was as follows: 3% B at 0 min; 35% B at 40 min; 95% B at 40.50 min; 95% B at 44.50 min; 3% B at 45 min; followed by conditioning of columns for 4 min at 3% B before injecting the next sample.
Mass Spectrometer Settings
[0197]Agilent 6490 triple quadrupole mass spectrometer was operated in positive ion mode and controlled by Agilent's MassHunter Workstation software (version B.06.00 build 6.0.6025.4 SP4). The MRM acquisition parameters were 150 V high pressure RF, 60 V low pressure RF, 4000 V capillary voltage, 300 V nozzle voltage, 11 L/min sheath gas flow at a temperature of 250° C., 15 L/min drying gas flow at a temperature of 250° C., 30 psi nebulizer gas flow, unit resolution (0.7 Da full width at half maximum in the first quadrupole (Q1) and the third quadrupole (Q3), and 200 V delta EMV (+).
Screening Samples for LeMBA-MRM-MS Qualification
[0198]Lectin-beads sufficient for biomarker qualification experiments were made in a single batch to minimize experimental variation. Serum samples were randomized for LeMBA-MRM-MS experiments. Peptide samples were spiked with SIS peptide mixture containing 50 femtomole of SPAFTDLHLR, AVEVLPK, and LTPLYELVK each, 100 femtomole of LSPIYNLVPVK, 200 femtomole of NLAVSQVVHK, 500 femtomole of VASMASEK,
[0199]ISQAVHAAHAEINEAGR, and GSFEFPVGDAVSK each, and 1000 femtomole of VTSIQDWVQK, and LPPNVVEESAR each.
Data Processing and Statistical Analysis
[0200]Raw data from MRM-MS experiment was processed using Skyline. All peaks were manually checked for correct integration, and peak area for each peptide (sum of all transitions) was exported for further analysis. Firstly, raw peptide intensity were normalized according to SIS peptide mixture. Followed by the two step normalization described in Shah et al. 2015 Mol. Cell. Proteomics 14, 3023-3039. Univariate, multivariate and ROC curve analyses were performed using Shiny mixOmics (available on the world wide web at mixomics-projects.di.uq.edu.au/Shiny-dev/) as described in Shah et al. 2015 Mol. Cell. Proteomics 14, 3023-3039.

PUM

no PUM

Description & Claims & Application Information

We can also present the details of the Description, Claims and Application information to help users get a comprehensive understanding of the technical details of the patent, such as background art, summary of invention, brief description of drawings, description of embodiments, and other original content. On the other hand, users can also determine the specific scope of protection of the technology through the list of claims; as well as understand the changes in the life cycle of the technology with the presentation of the patent timeline. Login to view more.
Why Eureka
Try Eureka