
Generating and reading optical codes with variable density to adapt for visual quality and reliability

Active Publication Date: 2019-10-31
DIGIMARC CORP
View PDF0 Cites 32 Cited by
  • Summary
  • Abstract
  • Description
  • Claims
  • Application Information

AI Technical Summary

Benefits of technology

This patent is about optimizing the design of optical codes, such as barcodes and digital watermarks, for various applications. The method takes into account factors like spatial density, dot placement, and dot size to improve the reliability and quality of the code. The invention also includes a method for inserting the optical code into host image content, and efficiently decoding the code from degraded images. Overall, this technology helps improve the impact and usefulness of optical codes in various applications.

Problems solved by technology

This growing use of barcodes poses a number of challenges for package and label designs.
Second, it creates a potential for confusion and complexity in image processing for image-based scanners, which are rapidly replacing laser scanners.
Third, in an effort to reduce the visual impact of these codes, they are often reduced in size and confined to difficult to find locations on the objects.
This makes them less reliable, and harder for users and machine vision equipment to locate and read reliably.
Digital watermarks may be hidden within other images on the object, and thus not occupy valuable, dedicated space.
One challenge is the formation of minimally invasive optical codes for host image areas lacking image content that can mask the optical code or even act as a carrier of it.
However, there are often limits to color selection and resolution that preclude these options.
Many objects are printed or marked with technology that does not allow for color selection, and that does not reliably mark dots below a minimum dot size.
Other examples include commercial printing of small packages that use techniques like dry offset or flexographic printing, which are incapable of rendering with high quality and consistency at high resolution and small dot sizes.
Moreover, there are often restrictions based on design and cost constraints of using additional inks.
Finally, even if rendering equipment is capable of leveraging higher resolution and smaller dot marking, and various color inks, the image capture infrastructure or mode of image capture may be incapable of capturing higher resolution or color information.
Another persistent challenge is the need to reliably read data from increasingly smaller spatial areas.
The demand for increasing data capacity is fundamentally at odds with reliable recovery of that data from a limited area.

Method used


Image

  • Generating and reading optical codes with variable density to adapt for visual quality and reliability
  • Generating and reading optical codes with variable density to adapt for visual quality and reliability
  • Generating and reading optical codes with variable density to adapt for visual quality and reliability

Examples


embodiment 420

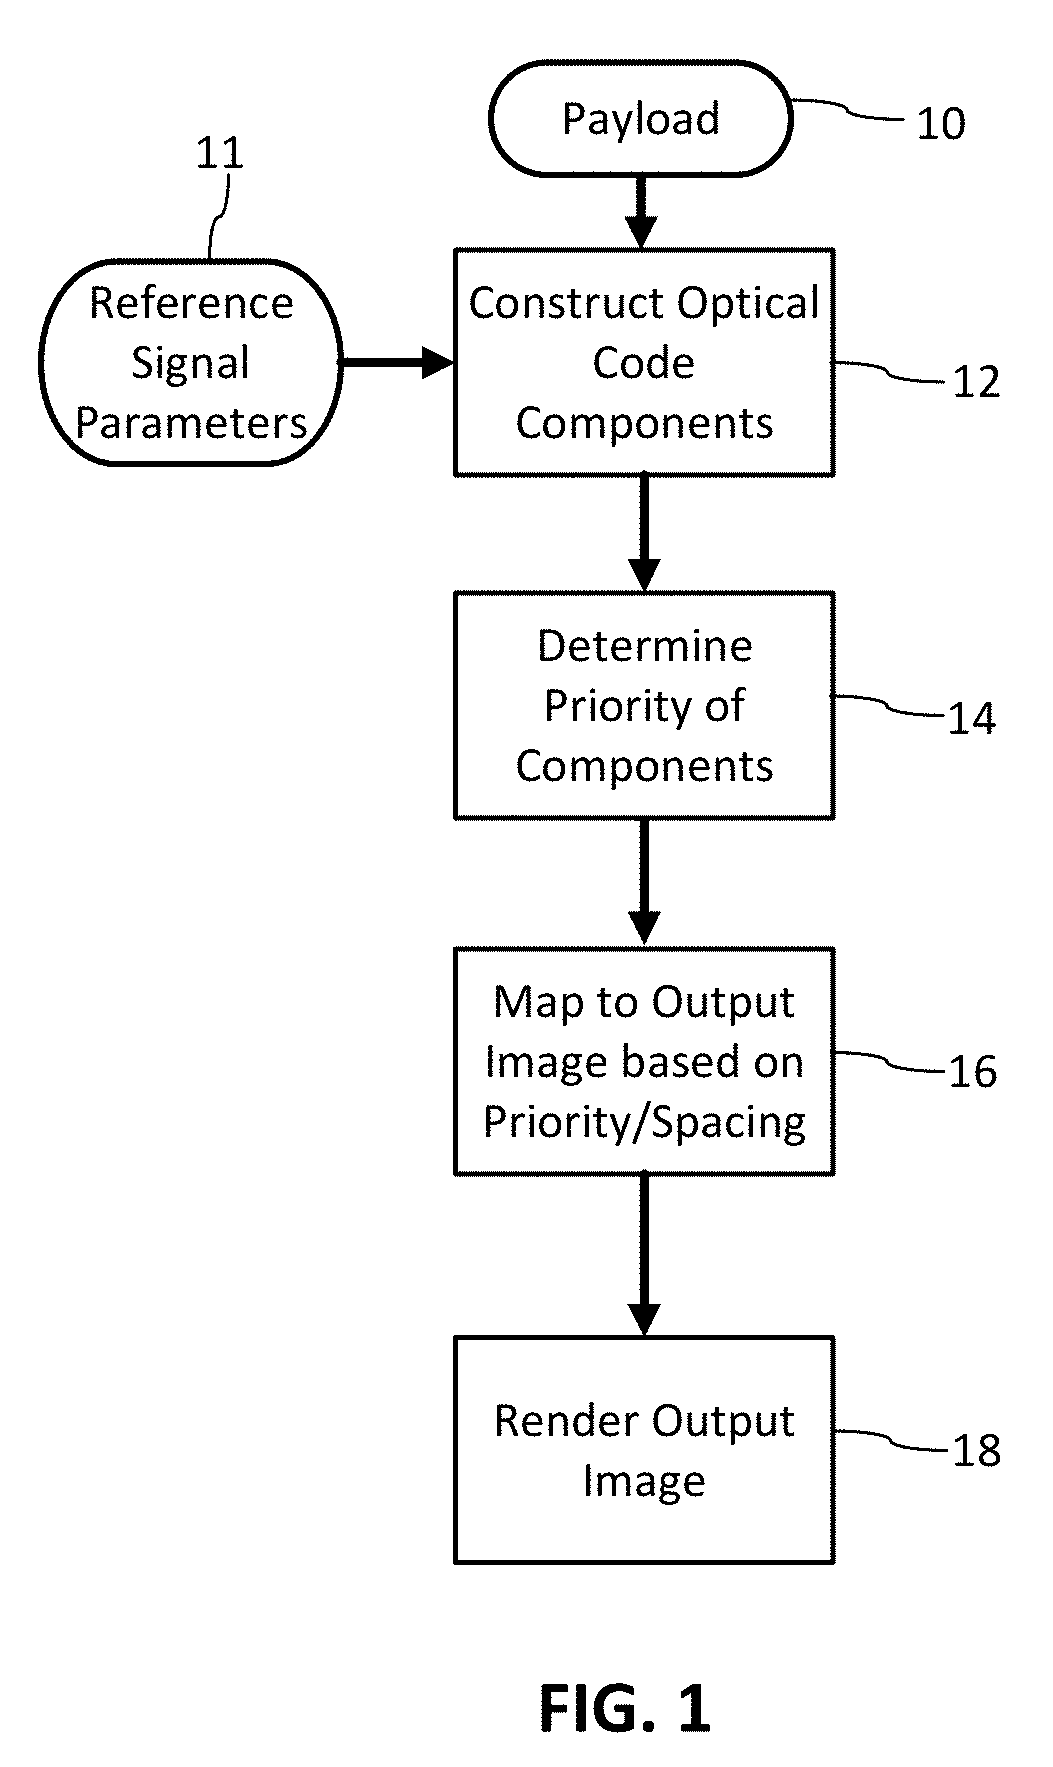
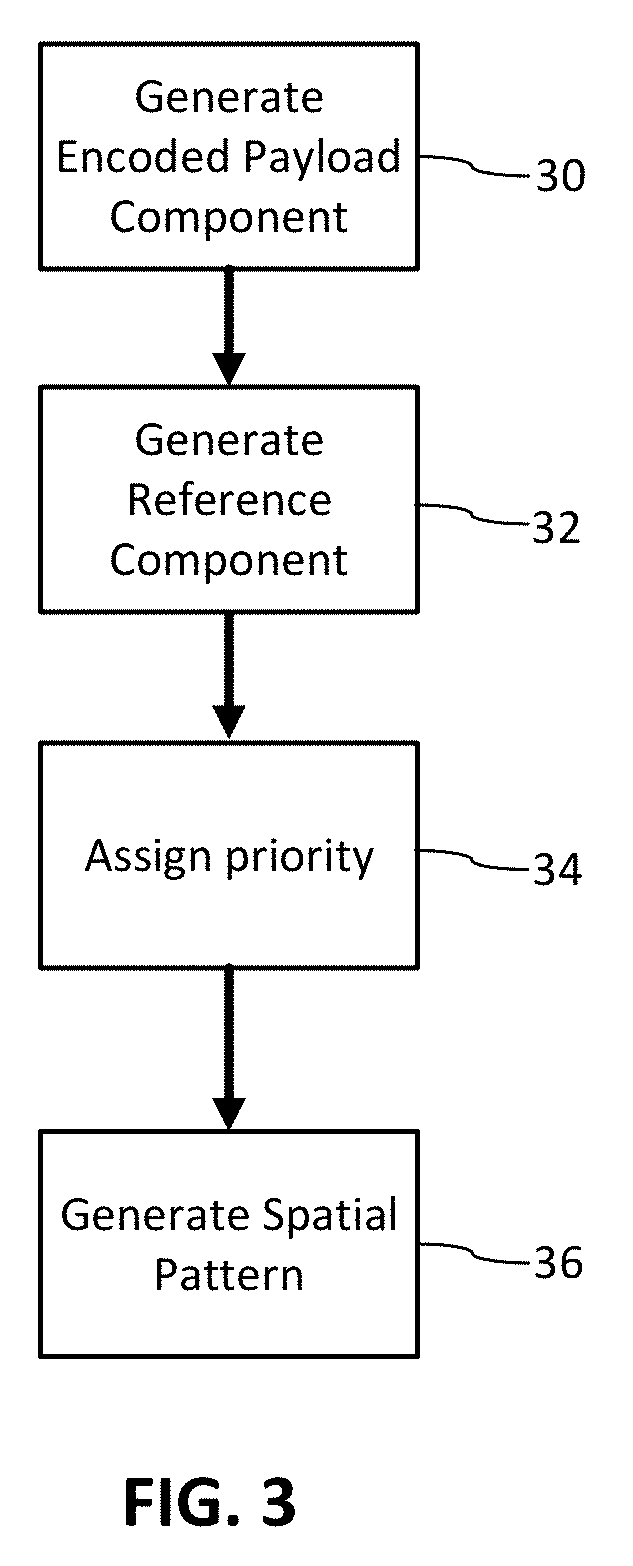
[0248]As in the arrangement of FIG. 5, two signal components—payload and reference—are first determined. One is used to modulate the other. However, rather than modulate phases of reference signal components (or on / off-keying of such components), embodiment 420 identifies positions of local extrema in the spatial domain reference signal, and forms marks (dots) in an output signal block at such positions—depending on a value of a spatially-corresponding element of the payload signal.

[0249]FIG. 43 illustrates an excerpt 431 of an encoded payload component block 432 (which may also be termed a message data array). This part is comprised of an array of signal elements, each drawn from a set of two possible values (e.g., {0,1}, {−1,1} or {black,white}). The depicted excerpt spans an area of just 5×5 elements, but the full payload component block is typically much larger, e.g., having 16, 32, 64 128 or 256 elements (e.g., pixels) on a side. The payload component block is commonly square, ...

first embodiment

[0368]In the second particular embodiment, each respective bit position in the message string is associated with a single extrema location in the reference signal (not a pair of locations, as in the first embodiment). Each successive bit of the message signal can be mapped to a successive location in the Table 2 ranking, i.e., the first message bit corresponds to the darkest extrema (rank #1); the second message bit corresponds to the second-darkest extrema (rank #2), etc.

[0369]In this second embodiment, a message bit of “1” is signaled by a mark, but a message bit of “0” is signaled by absence of a mark. (Or vice versa.) Instead of drawing from 2048 candidate locations and marking only half, this second embodiment draws from 1024 locations. Some of these 1024 locations are marked and some are not—depending on whether a “1” or “0” bit is being represented at that location.

[0370]This second arrangement is illustrated in FIGS. 65A and 65B. In comparison with FIGS. 64A and 64B, it will...

third embodiment

[0383]In particular, the marks in this third embodiment are 2×1, or 1×2, element features, termed “dyads.” Each dyad comprises a marked element adjacent an unmarked element.

[0384]Four possible dyads are shown in FIGS. 66A-66D. FIGS. 66A and 66B show horizontal dyads. FIGS. 66C and 66D show vertical dyads. FIG. 66A represents a “0” message bit. FIG. 66B represents a “1” bit. FIG. 66C represents a “0” bit. FIG. 66D represents a “1” bit. Each is comprised of a dark (marked) element adjacent to a white (unmarked) element.

[0385]In this third embodiment, instead of ranking candidate single elements in the reference signal tile by value (e.g., as in Table 2), 2×1 and 1×2 areas across the tile are ranked by their average (or total) value. The darkest 1024 areas are selected. Each is associated with one bit position in the 1024 bit message. Each area is marked with a dyad. If a selected area is horizontally-oriented, one of the two horizontal dyads, FIG. 66A or 66B, is used—depending on whet...


PUM


Abstract

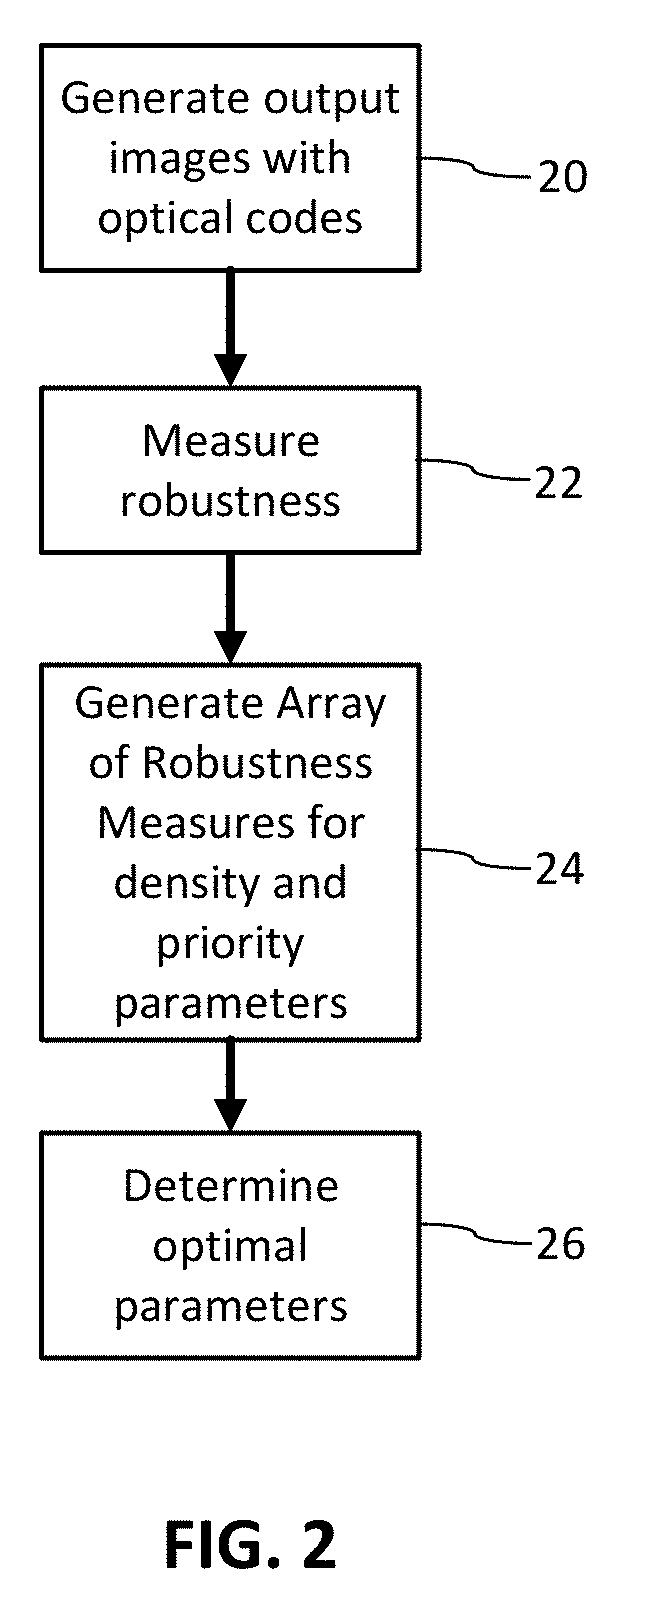
The parameters of an optical code are optimized to achieve improved signal robustness, reliability, capacity and / or visual quality. An optimization program can determine spatial density, dot distance, dot size and signal component priority to optimize robustness. An optical code generator employs these parameters to produce an optical code at the desired spatial density and robustness. The optical code is merged into a host image, such as imagery, text and graphics of a package or label, or it may be printed by itself, e.g., on an otherwise blank label or carton. A great number of other features and arrangements are also detailed.

Description

RELATED APPLICATION DATA[0001]This application claims priority to provisional applications 62 / 834,657, filed Apr. 16, 2019; 62 / 751,084, filed Oct. 26, 2018; 62 / 730,958, filed Sep. 13, 2018; 62 / 673,738, filed May 18, 2018; and 62 / 670,562, filed May 11, 2018. This application is also a continuation-in-part of application Ser. No. 16 / 002,989, filed Jun. 7, 2018, which claims priority to provisional applications 62 / 659,641, filed Apr. 18, 2018; 62 / 634,898, filed Feb. 25, 2018; and 62 / 582,871, filed Nov. 7, 2017. These applications are incorporated herein by reference.TECHNICAL FIELD[0002]The present technology relates, generally, to image processing to generate machine-readable optical codes for printing (optionally after merging with host image content), complementary robustness measurements for optimizing the optical codes, and optical code readers for reliably and efficiently reading such codes from objects.[0003]In part, this application concerns enhancements and improvements to the...

Claims


Application Information

Patent Timeline
IPC IPC(8): G06K7/14
CPCG06K7/1465G06K7/1447G06K7/1473G06K7/1443
Inventor SHARMA, RAVI K.DENEMARK, TOMASBRADLEY, BRETT A.RHOADS, GEOFFREY B.SINCLAIR, EOIN C.HOLUB, VOJTECHBRUNK, HUGH L.BRUNDAGE, TRENT J.STACH, JOHN F.LORD, JOHN D.MEYER, JOEL R.FILLER, TOMASKAMATH, AJITH M.TAIT, MARK-ANDREW RAYHANSONODA, KEVIN J.ALATTAR, ADNAN M.
Owner DIGIMARC CORP
Learn More