
Detection of surface anomalies in elongate conductive members by pulse propagation analysis

a technology of elongate conductive members and anomalies, applied in the direction of resistance/reactance/impedence, fault location by pulse reflection methods, instruments, etc., can solve the problems of excessive damage, anomalies on the exterior surface of insulated pipes that cannot be adequately tested using, and the inability to accurately detect anomalies

Inactive Publication Date: 2000-06-06
PROFILE TECH
View PDF4 Cites 18 Cited by
  • Summary
  • Abstract
  • Description
  • Claims
  • Application Information

AI Technical Summary

Benefits of technology

(c) can be effectively and consistently applied in a cost efficient manner.
The applicant thus concluded that the effect of corrosion on propagation of velocity, rise time, and amplitude of single pulse should also be observable in some form in a pulse that has intersected another pulse at a predetermined location. By looking for the affects of corrosion in a two-pulse system, not only can corrosion be identified but it can also be located and significantly simplifies the testing process.
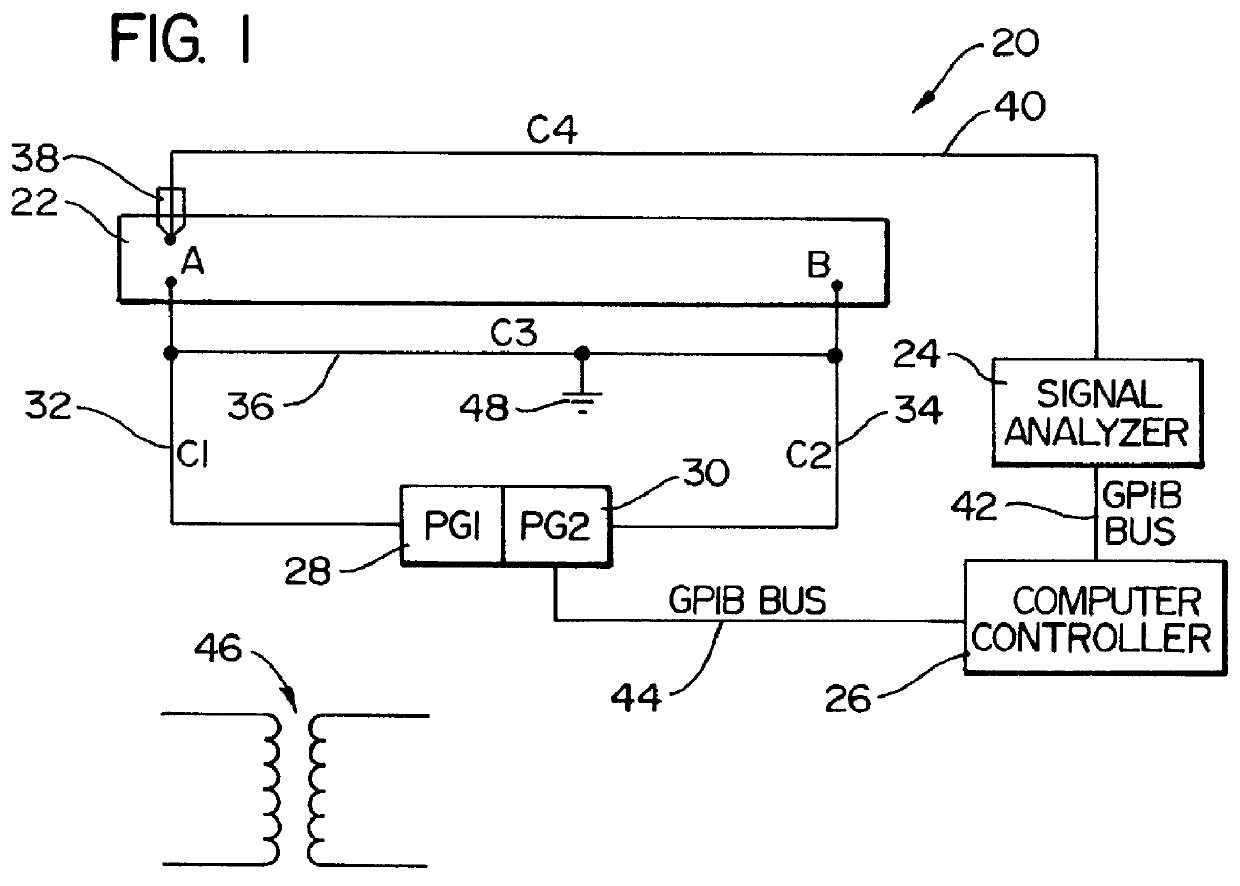
In practice, the applicant has found that electrically connecting the points on a conductive member at either end of the section of interest removes certain variables relating to grounding and substantially reduces the amount of power required to generate a given pulse. By referring all test equipment to a reference potential set at the potential of the electrically connected end points, very low power pulses may be used. Low power pulses appear to provide more meaningful information related to the surface of the pipe than do higher power pulses.
This arrangement of floating the test signals isolates these signals from the noise introduced by the various grounded pipes in a refinery setting. While this arrangement renders the system 20 less suitable for measuring the interaction between the pipe 22 and its environment, it greatly enhances the ability of system 20 to test the condition of the pipe itself in a refinery setting.
On the other hand, the applicant also believes that the absence of problems such as corrosion can be predicted with an acceptable degree of certainty along the length of a pipe, which may obviate the need visually to inspect the entire length of pipe.
Accordingly, the Applicant employs pulse widths that are either: much longer than the propagation delay of the pipe section of interest to avoid the problems with pulses equal to or shorter than the propagation delay for short pipe runs; or much shorter than the propagation delay of the pipe section of interest when a reliable pulse can be generated relative to the propagation delay.

Problems solved by technology

The failure of such pipes can cause extensive damage, and these pipes are often routinely inspected to avoid pipe failures and the damage resulting therefrom.
The exterior surface of insulated pipe cannot be adequately tested using sampling and statistical inferences, however, because one cannot assume that the entire exterior surface of insulated pipe is subject to the same conditions.
To the contrary, anomalies on the exterior surface of a pipe tend to be localized and caused by factors specific to that location.
The process of removing and reinstalling this insulation is very expensive.

Method used


Image

  • Detection of surface anomalies in elongate conductive members by pulse propagation analysis
  • Detection of surface anomalies in elongate conductive members by pulse propagation analysis
  • Detection of surface anomalies in elongate conductive members by pulse propagation analysis

Examples


example 2

Referring now to FIG. 5, depicted therein is a graph that plots against pipe length one factor relating to the leading edge of a series of modified pulses generated over a section of pipe 80 feet in length. The pipe tested was located in an operating oil refinery.

In particular, pipe distance in feet is plotted on the horizontal axis, while an amplitude in microvolts of the pulse adjacent to the pulse leading edges is plotted on the vertical axis. In this situation, the propagation delay was approximately 100 nanoseconds, while the pulse widths employed were approximately one microsecond. The pulses were timed to intersect at intersecting locations spaced approximately three inches apart.

For ease of comparison, the amplitude values plotted on the vertical axis have been normalized to a given voltage that is identified at zero.

The first 45 feet of pipe was above ground and easily accessible for visual inspection. This first 45 feet of pipe above ground was clearly in good condition. B...

example 3

Referring now to FIGS. 6 and 7, a situation similar to that described in Example 2 set forth above is shown. Again, the pipe under test was in use in a refinery setting. In FIG. 6, distance along a given pipe is plotted against the horizontal axis, while a percentage change in amplitude values from a reference value is plotted against the vertical axis. In FIG. 7, distance for the same pipe is plotted against the horizontal axis, but zero feet in FIG. 7 corresponds to 80 feet in FIG. 8, and vice versa. Amplitude values referred to a reference value identified as zero are plotted against the vertical axis in FIG. 7.

In FIG. 6, a first plot is identified by reference character 80 and a reference plot is identified by reference character 82. A single plot 84 is shown in FIG. 7. A portion of the plot 80 corresponding to a known good section of pipe is identified by reference character 86 (25 to 80 feet), while in FIG. 7 the same known good section of pipe is identified by reference chara...


PUM


Abstract

Pulse propagation analysis to ascertain whether and anomaly such as surface corrosion exists on a section of conductive member such as pipe. Anomalies such as surface corrosion result in localized velocity changes of pulses propagating along a conductive member. These localized velocity changes exhibit themselves in changes in waveform, rise and fall time, amplitude, and time delay of a pulse with respect to a fixed time reference. To allow such anomalies to be located, two pulses are generated such that they intersect at intersecting locations along the conductive member. The resulting modified pulses are analyzed for perturbations indicative of localized velocity changes.

Description

The present invention relates to pulse propagation analysis and, more particularly, to the analysis of one of two intersecting electrical pulses to determine whether a surface anomaly exists at the location where the two pulses intersect.Pulse propagation analysis has long been proposed as a tool for nonintrusively detecting anomalies in elongate, conductive members such as buried cables and the like. In U.S. Pat. No. 4,970,467, the present applicant proposed propagating two electrical pulses along a conductor such that they intersect at a predetermined location along the conductor. By analyzing one of these pulses after they have passed through the predetermined location, the applicant found that the presence or absence of an anomaly at the predetermined location could be predicted.The basic principle disclosed in the '467 patent was also used in U.S. Pat. Nos. 5,189,374, 5,243,294, and 5,270,661, all also issued to the present applicant. The '374 patent applied the basic principle...

Claims


Application Information

Patent Timeline
IPC IPC(8): G01N17/00G01R31/11
CPCG01N17/00G01R31/11
Inventor BURNETT, GALE D.
Owner PROFILE TECH
Learn More