Signal analyzer system and method for computing a fast Gabor spectrogram

a signal analyzer and gabor spectrogram technology, applied in the direction of spectral/fourier analysis, resistance/reactance/impedence, instruments, etc., can solve the problem that the stft-based spectrogram is not suitable for instantaneous frequency estimation, the algorithm of the stft-based spectrogram is not convenient to zoom in to the time-frequency region of interest, and the frequency resolution is poor

Inactive Publication Date: 2002-08-13
NATIONAL INSTRUMENTS
View PDF5 Cites 14 Cited by
  • Summary
  • Abstract
  • Description
  • Claims
  • Application Information

AI Technical Summary

Problems solved by technology

A short window yields good time resolution, but poor frequency resolution, and vice versa.
Particularly, the STFT-based spectrogram is not suitable for the instantaneous frequency estimation which is one of the most important signal's aspects of interest.
Finally, the algorithm of the STFT-based spectrogram is not convenient to zoom in to the time-frequency region of interest.
The mechanism that emits such sounds is complicated and involves the wall, chamber, surrounding blood vessels, and moving blood, under varying pressure.
As expected, the time waveform at the bottom of the figure is rather noisy and thereby virtually provides no useful information for the diagnostic.
However, computing the Gabor spectrogram usually takes a long time.
Besides the difficulty of the filter design, the main disadvantage of using filters is that the resulting presentation may not be consistent.
For the sake of computation speed, the precision of the table of energy atoms is usually limited to be no less than 10.sup.-3, which has been found to be insufficient for many applications.

Method used


Image

  • Signal analyzer system and method for computing a fast Gabor spectrogram
  • Signal analyzer system and method for computing a fast Gabor spectrogram
  • Signal analyzer system and method for computing a fast Gabor spectrogram

Examples


Embodiment Construction

Incorporation by Reference

The following references are hereby incorporated by reference as though fully and completely set forth herein: U.S. Pat. No. 5,353,233 to Qian et al titled "Method and Apparatus for Time Varying Spectrum Analysis issued Oct. 4, 1994; and Shie Qian and Dapang Chen, "Joint Time Frequency Analysis" Prentice Hall, 1996.

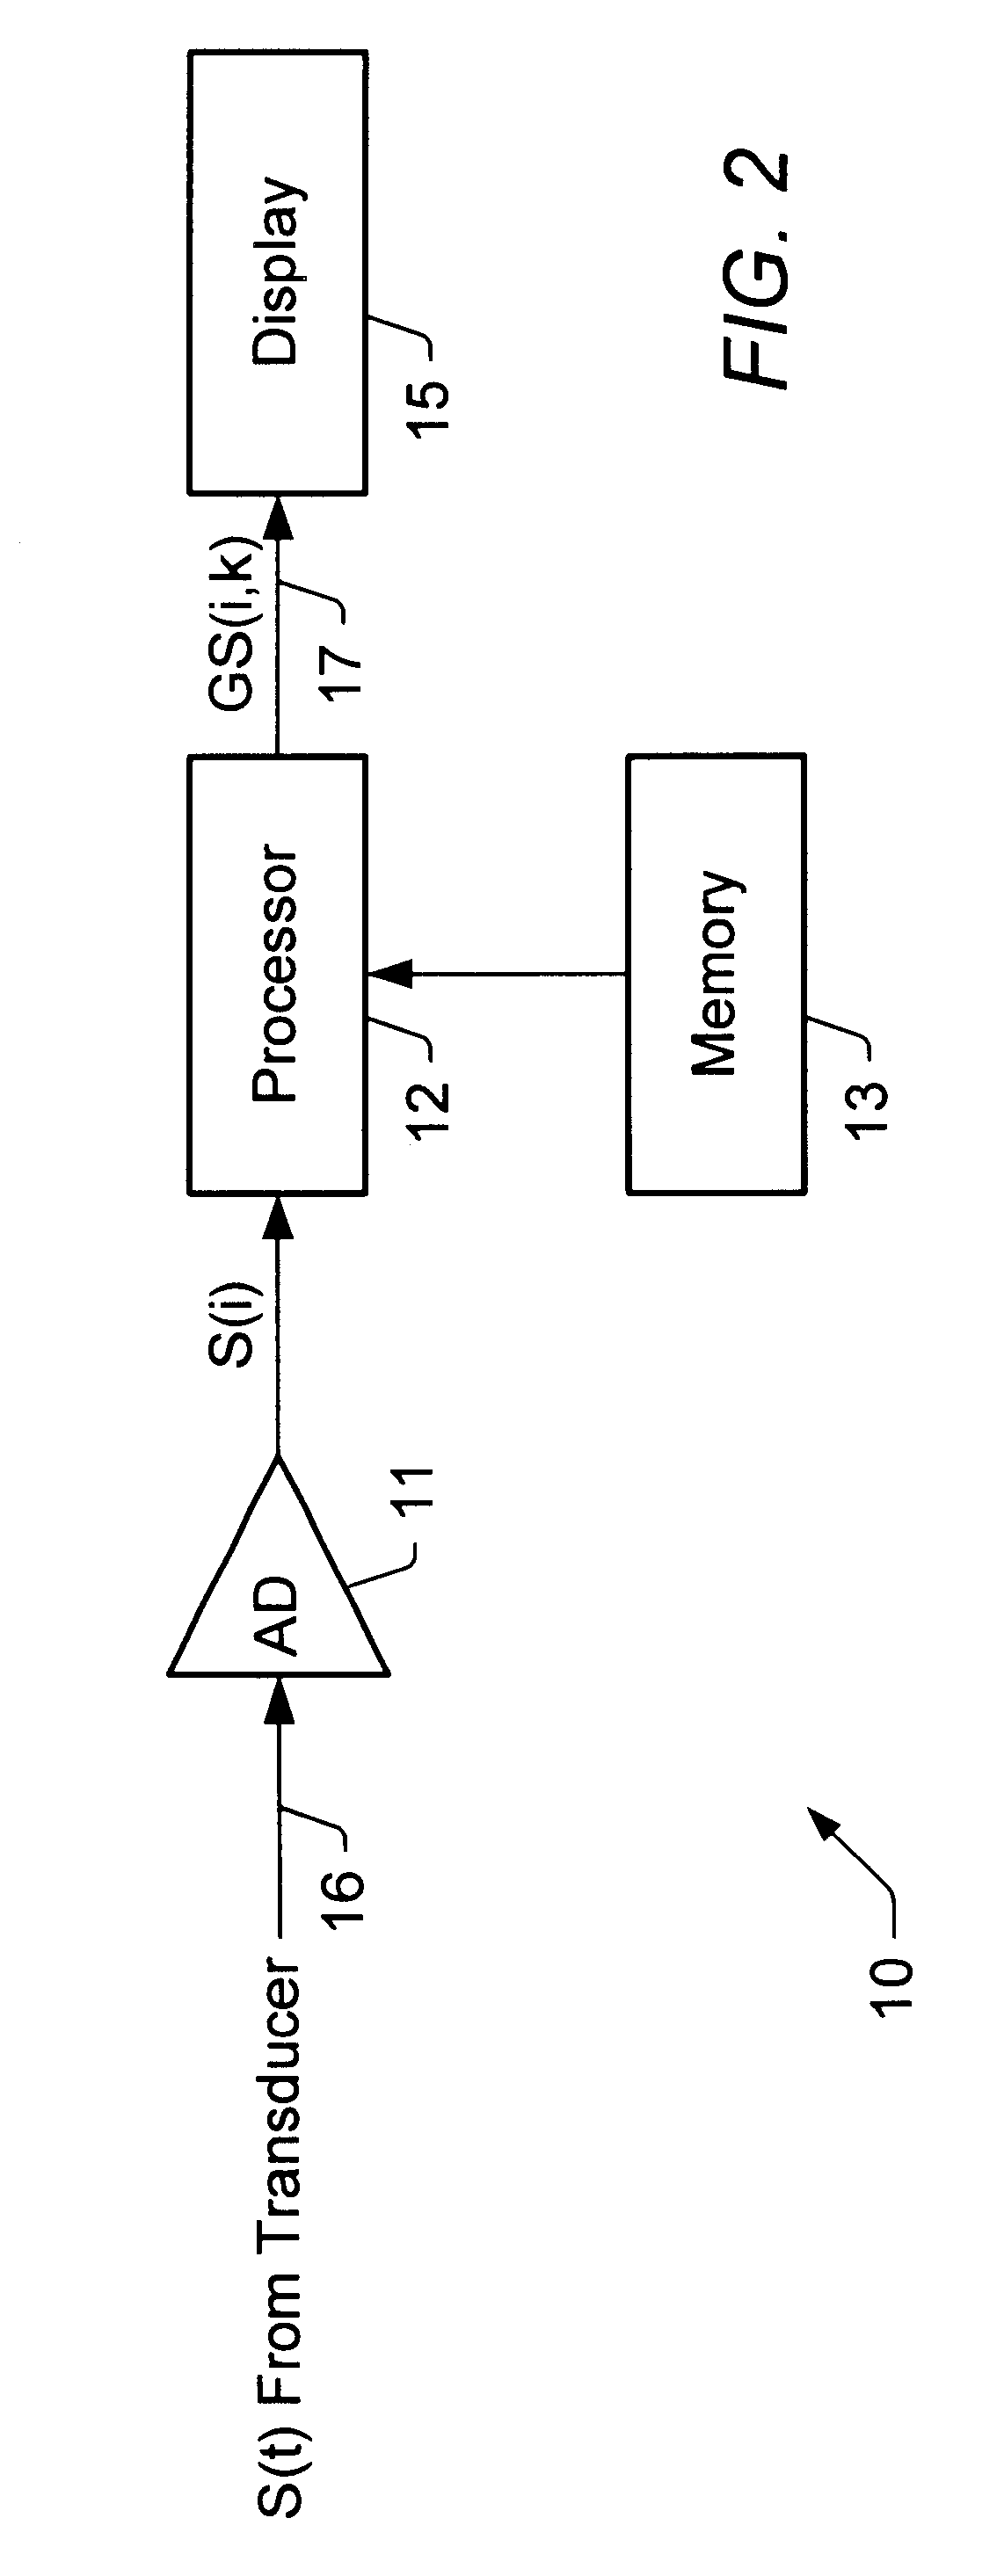
FIG. 2--Signal Analyzer

FIG. 2 illustrates a block diagram of a signal analyzer according to one embodiment of the present invention. A signal analyzer using the fast Gabor spectrogram may take any of various forms, and the embodiment of FIG. 2 is exemplary only. For example, the signal analyzer 10 may comprise a general purpose computer or other type of computing device, an add-in card or device which may be coupled to or comprised in a computer, or a stand-alone device.

The analyzer, generally referred to by the reference number 10, may include an analog to digital converter 11, a processor 12, and a memory medium 13 coupled to the processor 12. ...


PUM


Abstract

A signal analyzer, method and memory medium for generating a time varying spectrum for input signals characterized by frequency components which change in time. The signal analyzer includes a source of a sequence of digital signals representative of an input signal, a processor coupled to the source, and a memory medium coupled to the processor. The memory medium stores a software program which is executable by the processor to compute the time-varying spectrum of the input signal. When the processor executes the software program, the processor is operable to first compute a Gabor transform (that is, a sampled short-time Fourier transform) of the digital signals to produce Gabor coefficients. The processor then computes a two dimensional auto-correlation of the Gabor coefficients to produce auto-correlation results. The auto-correlation results are then applied to a 2-dimensional fast interpolation filter to produce the time-varying spectrum, wherein the time-varying spectrum is a Gabor spectrogram. The signal analyzer may repeat the above steps n+1 times, based on the order determined by a user, and sum the results for an n order time-varying spectrum. The process more may then operate to process and / or display the time-varying spectrum.

Description

COMPUTER PROGRAM APPENDIXThe present application includes a compact disc containing Appendix A, which is one example of a source code routine written in the C programming language for performing the Gabor spectrogam according to the present invention. The compact disc contains a single text file calle "Gabor Spectrogram". The compact disc is in the IBM-PC format and may be viewed with the Windows operating system. The source code listing in the file "Gabor Spectrogram" is called "Fast Gabor Spectrogram function, Gaborspectrogram.c", has a size of 74 kbytes, and a date of creation of Mar. 5, 1999. The source code listing on the compact disc filed in the application herewith is hereby incorporated by reference as though fully and completely set forth herein.RESERVATION OF COPYRIGHTA portion of the disclosure of this patent document, specifically Appendix A, contains material to which the claim of copyright protection is made. The copyright owner has no objection to the facsimile repro...

Claims


Application Information

Patent Timeline
Patent Type & Authority Patents(United States)
IPC IPC(8): G06F17/14
CPCG06F17/141
Inventor QIAN, SHIE
Owner NATIONAL INSTRUMENTS
Why Eureka
Try Eureka