Method and apparatus for diagnosis of a mood disorder or predisposition therefor

a mood disorder and diagnosis technology, applied in the field of mood disorders, can solve problems such as complex genetics, and achieve the effects of reducing the effect, reducing the effect, and increasing the absolute magnitude of chang

Inactive Publication Date: 2003-10-07
QUEENSLAND UNIV OF THE
View PDF0 Cites 135 Cited by
  • Summary
  • Abstract
  • Description
  • Claims
  • Application Information

AI Technical Summary

Benefits of technology

FIG. 9 shows a set-up for transcranial magnetic stimulation (TMS) and binocular rivalry experiments and the perceptual interference effects predicted by the interhemispheric switch hypothesis. (a) The circular coil delivers a single pulse to the temporo-parietal region of the left hemisphere. The subject views orthogonal stationary gratings (see methods) and reports their perceptual alternations using two response keys, one of which triggers the magnetic stimulation. (b) The time course of perceptual alternations shows the predicted pattern of interference effects when the TMS is triggered by a switch to the horizontal percept. The interhemispheric switch hypothesis suggests that if the left hemisphere adopts the horizontal image, TMS applied to this hemisphere when the horizontal image is perceptually dominant will disrupt this representation and allow the vertical percept to assume dominance. The theoretical frequency histogram depicts very short horizontal interval durations. (c) When the stimulation is delivered to the same hemisphere but at the opposite phase of the perceptual switch (ie. triggered when the subject reports a switch to the vertical percept), disruption of the left hemisphere should have little effect since the vertical representation resides in the right hemisphere. Thus the theoretical frequency histogram for this contingency shows normal interval durations. Actual rather than theoretical frequency histograms for TMS's effect on rivalry alternations are shown in FIG. 13.
FIG. 10 shows an analysis procedure for caloric stimulation and binocular rivalry experiments. There are six blocks of rivalry each representing approximately seven minutes of viewing. Each block contains four 100-second trials separated by 30-second rest periods and each block is separated by a 2-minute rest period. The first block is considered training and discarded before analysis. Blocks 2 and 3 are pre-stimulation blocks, while 4,5 and 6 are post-stimulation blocks. The predominance ratio is calculated by dividing the total time spent perceiving the vertical gratings by the total time spent perceiving the horizontal gratings, excluding mixed percepts. The resulting V/H ratio is log-transformed before analysis. Since there is random variation in this V/H ratio between two pre-stimulation blocks, to show an effect of caloric stimulation, there must be greater absolute magnitude of change in the V/H ratio between blocks 3 and 4 (random variation plus experimental effect) compared with the random change seen between blocks 2 and 3. Comparison of the V/H 2-3 change with the V/H 3-5 change (and the V/H 3-6 change) allows an indication of the stimulation's decay. The left hemisphere activation group (n=18) demonstrated a greater V/H change following stimulation compared with that seen prior to stimulation (p>0.05) and the effect was largely diminished by the fifth block (though not in all subjects). We were less able to demonstrate greater than baseline shifts in predominance for the right hemisphere activation group (n=14, p=0.72). Results were not significant for a control group of twelve subjects who underwent the entire protocol minus the caloric stimulation (p=0.21).
FIG. 11 shows the effects of caloric vestibular stimulation on two individuals' perceptual alternations in binocular rivalry. In both cases the predominance of one perceptual alternative is shifted by left hemisphere activation (right caloric stimulation). These changes are demonstrated in the frequency histograms of interval durations for each rivalling image. The shifts are also reflected by the predominance ratios shown in the top rig

Problems solved by technology

Although it is strongly heritable, the genetics are complex, with

Method used


Image

  • Method and apparatus for diagnosis of a mood disorder or predisposition therefor
  • Method and apparatus for diagnosis of a mood disorder or predisposition therefor
  • Method and apparatus for diagnosis of a mood disorder or predisposition therefor

Examples


example 1

Apparatus for Measuring Rate of Binocular Rivalry

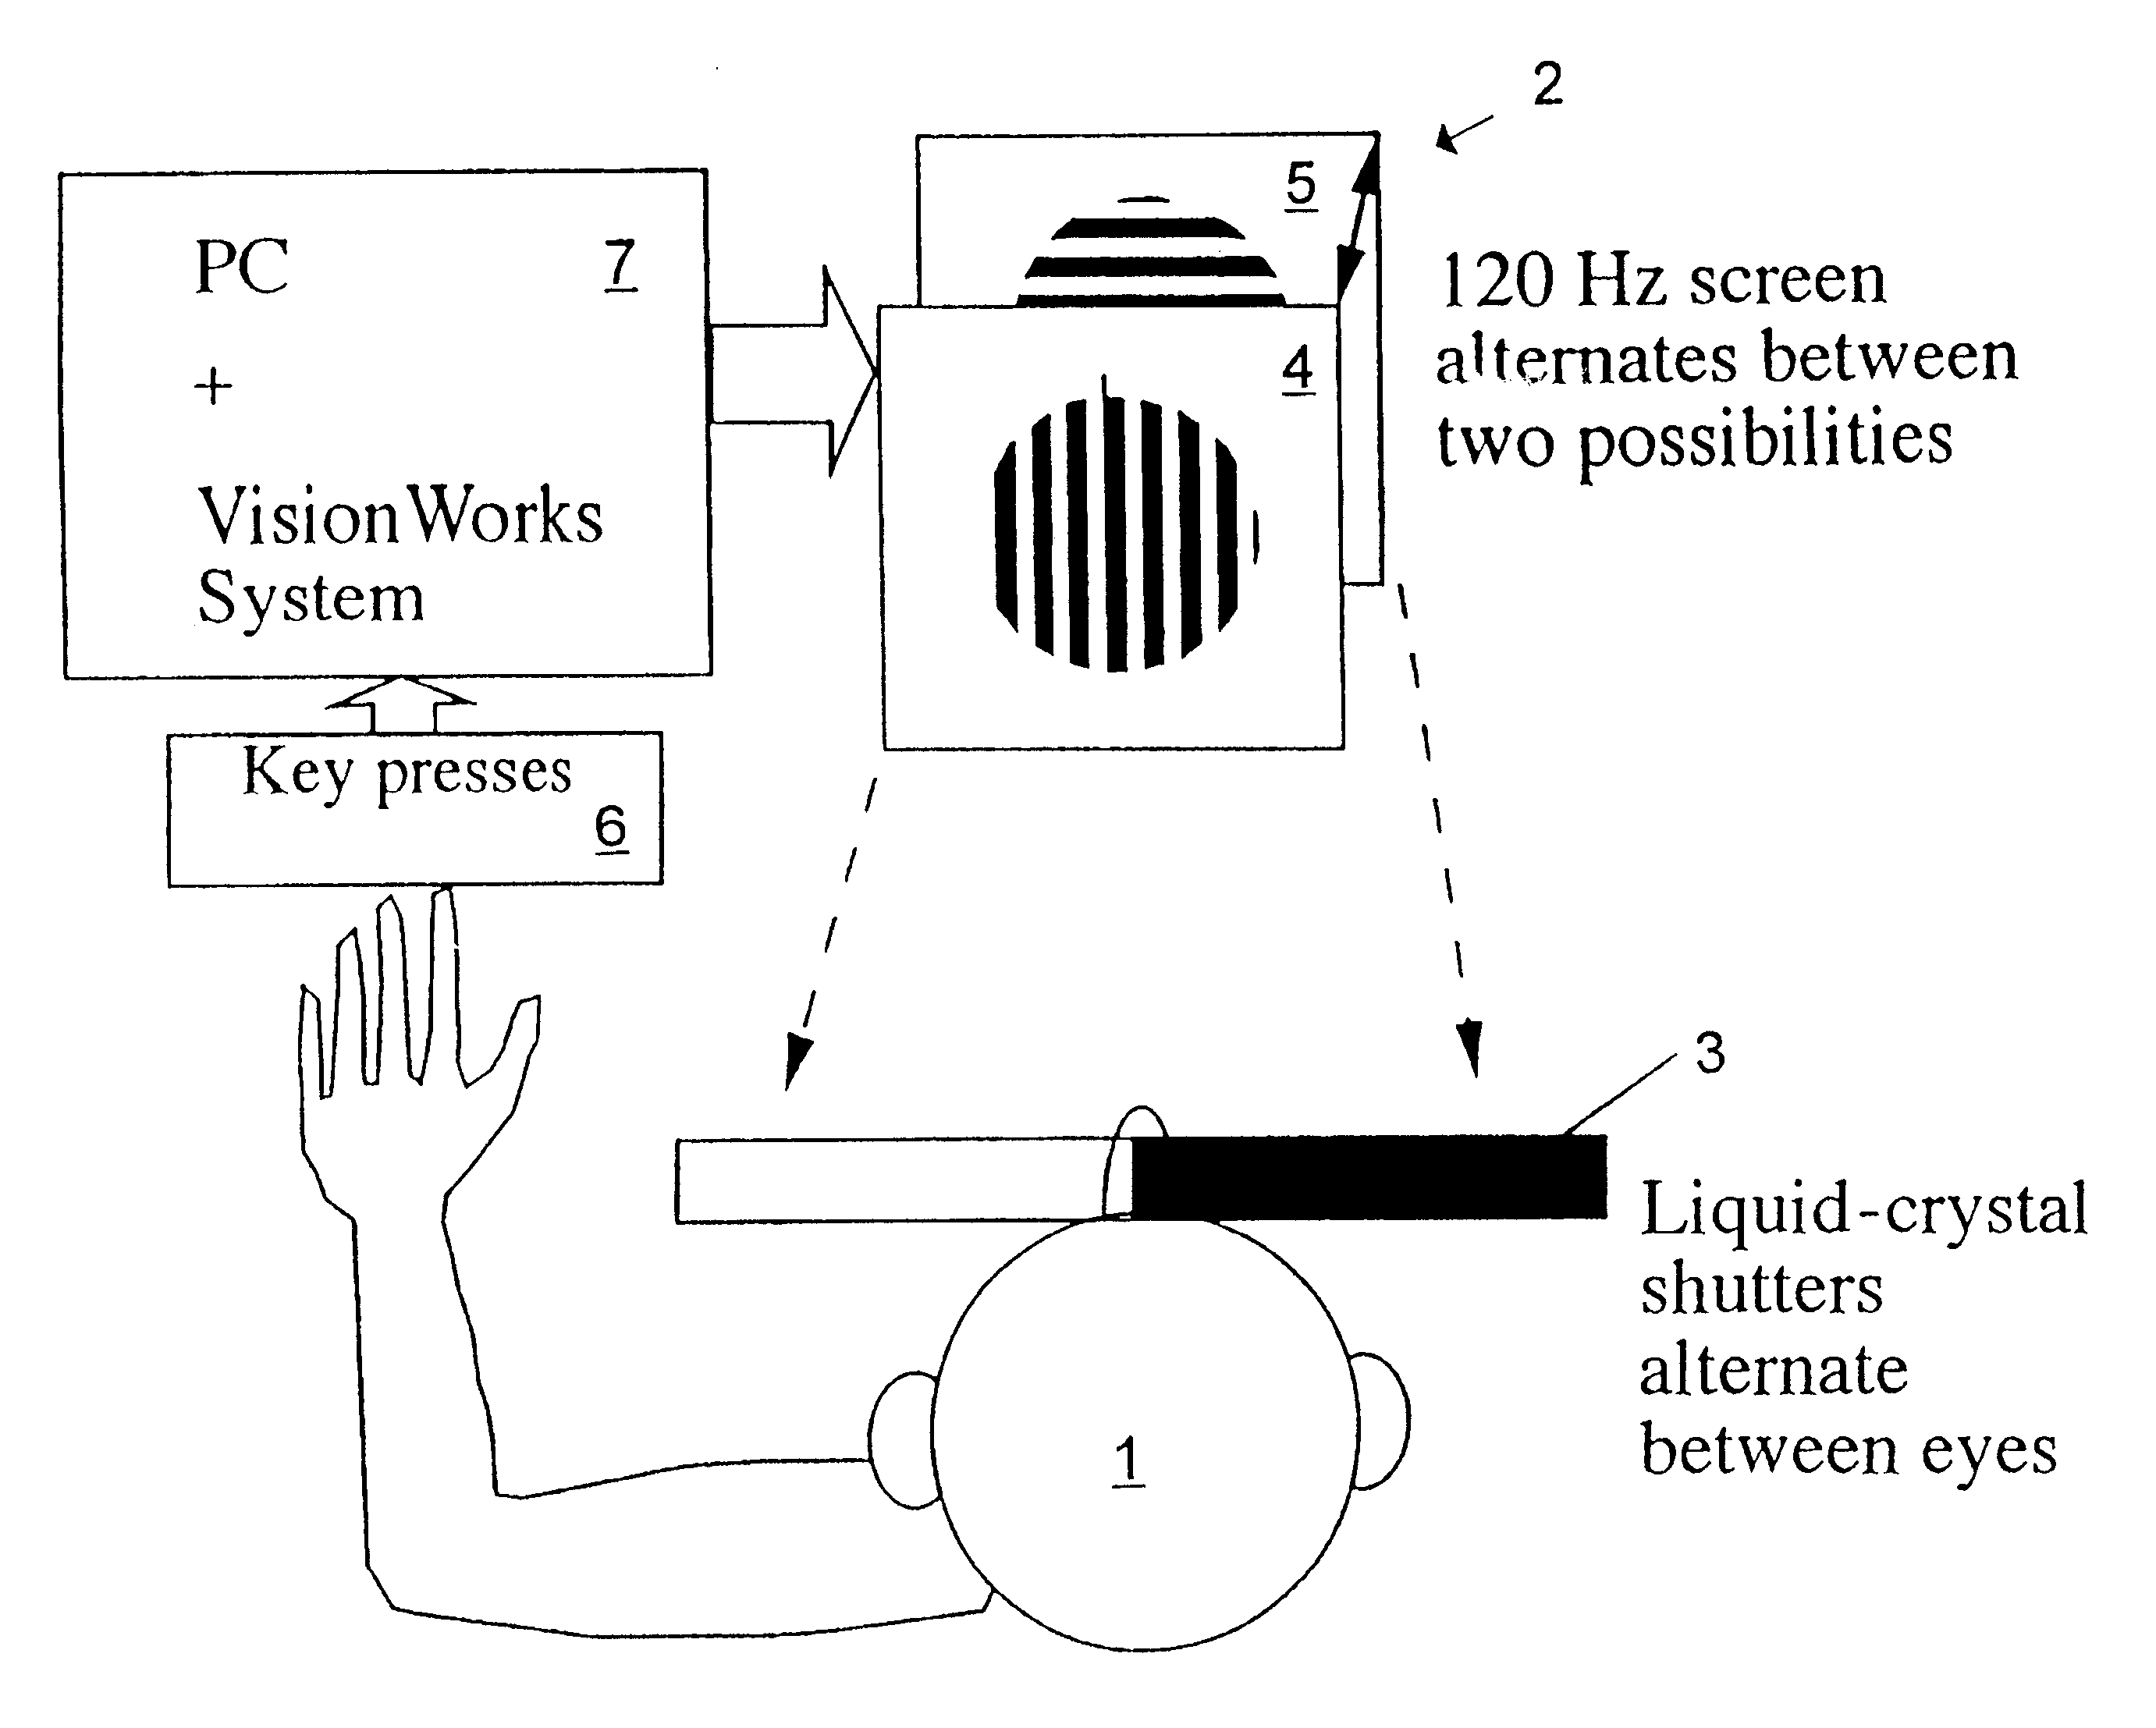
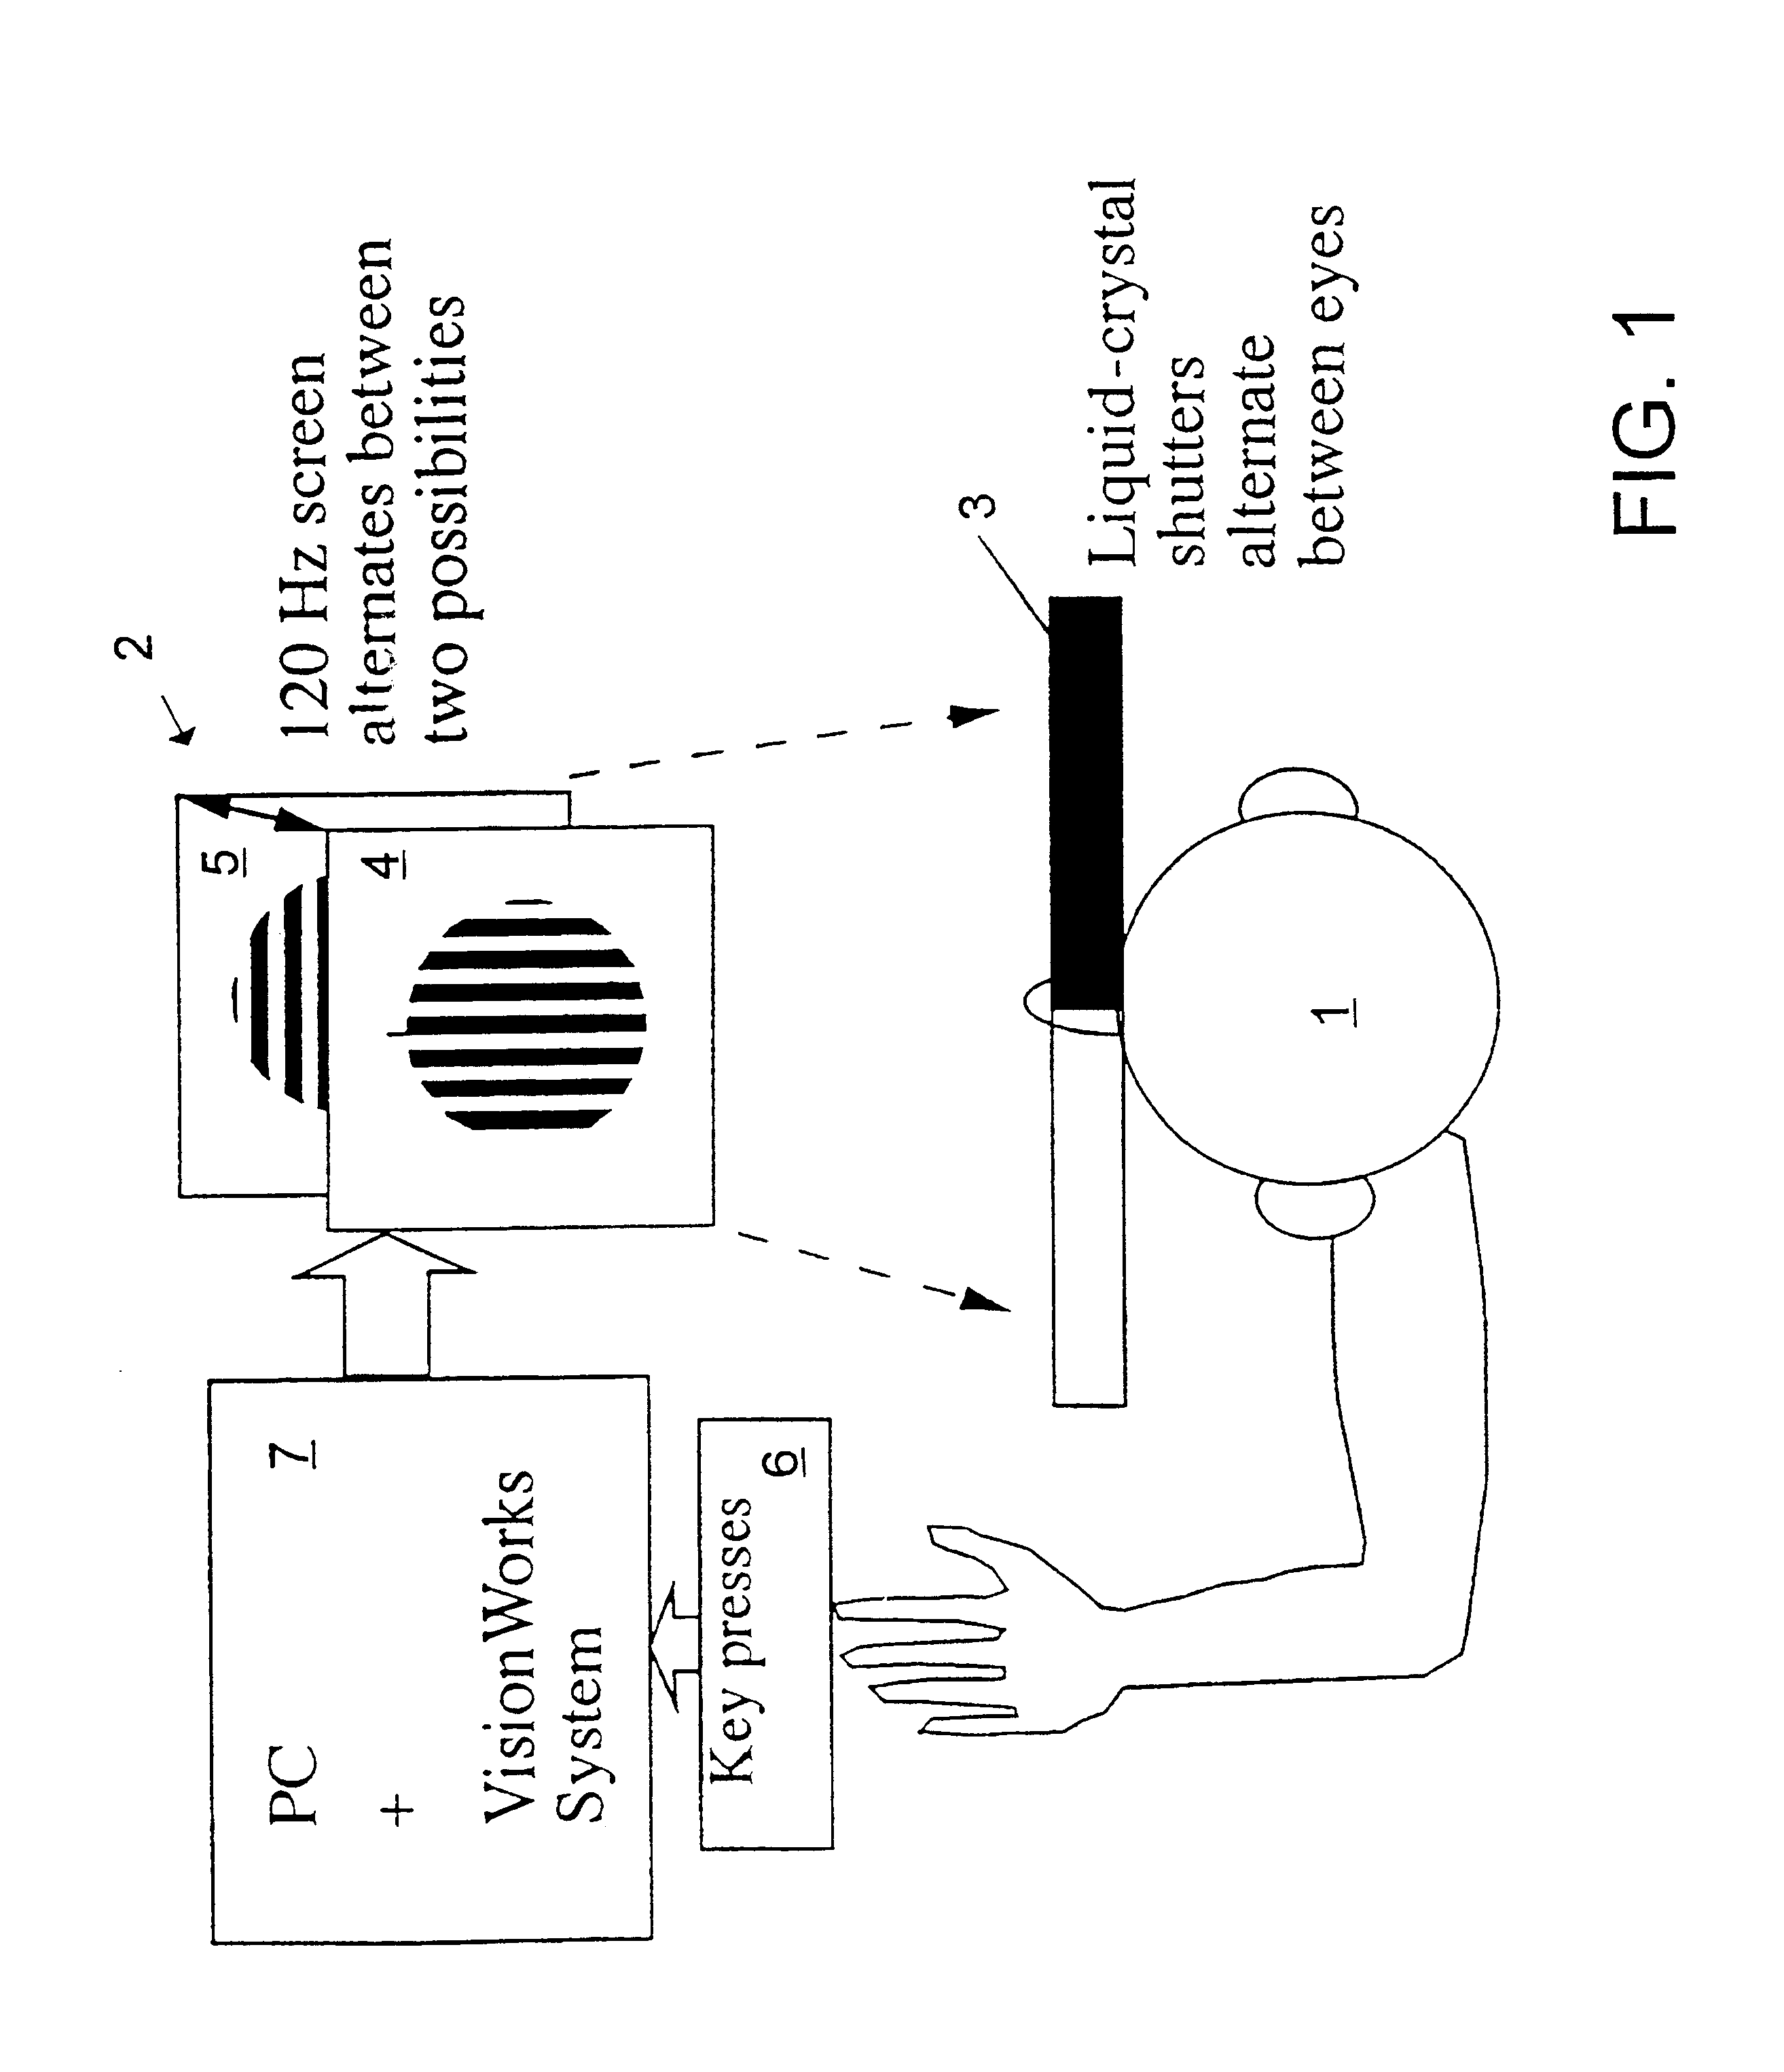
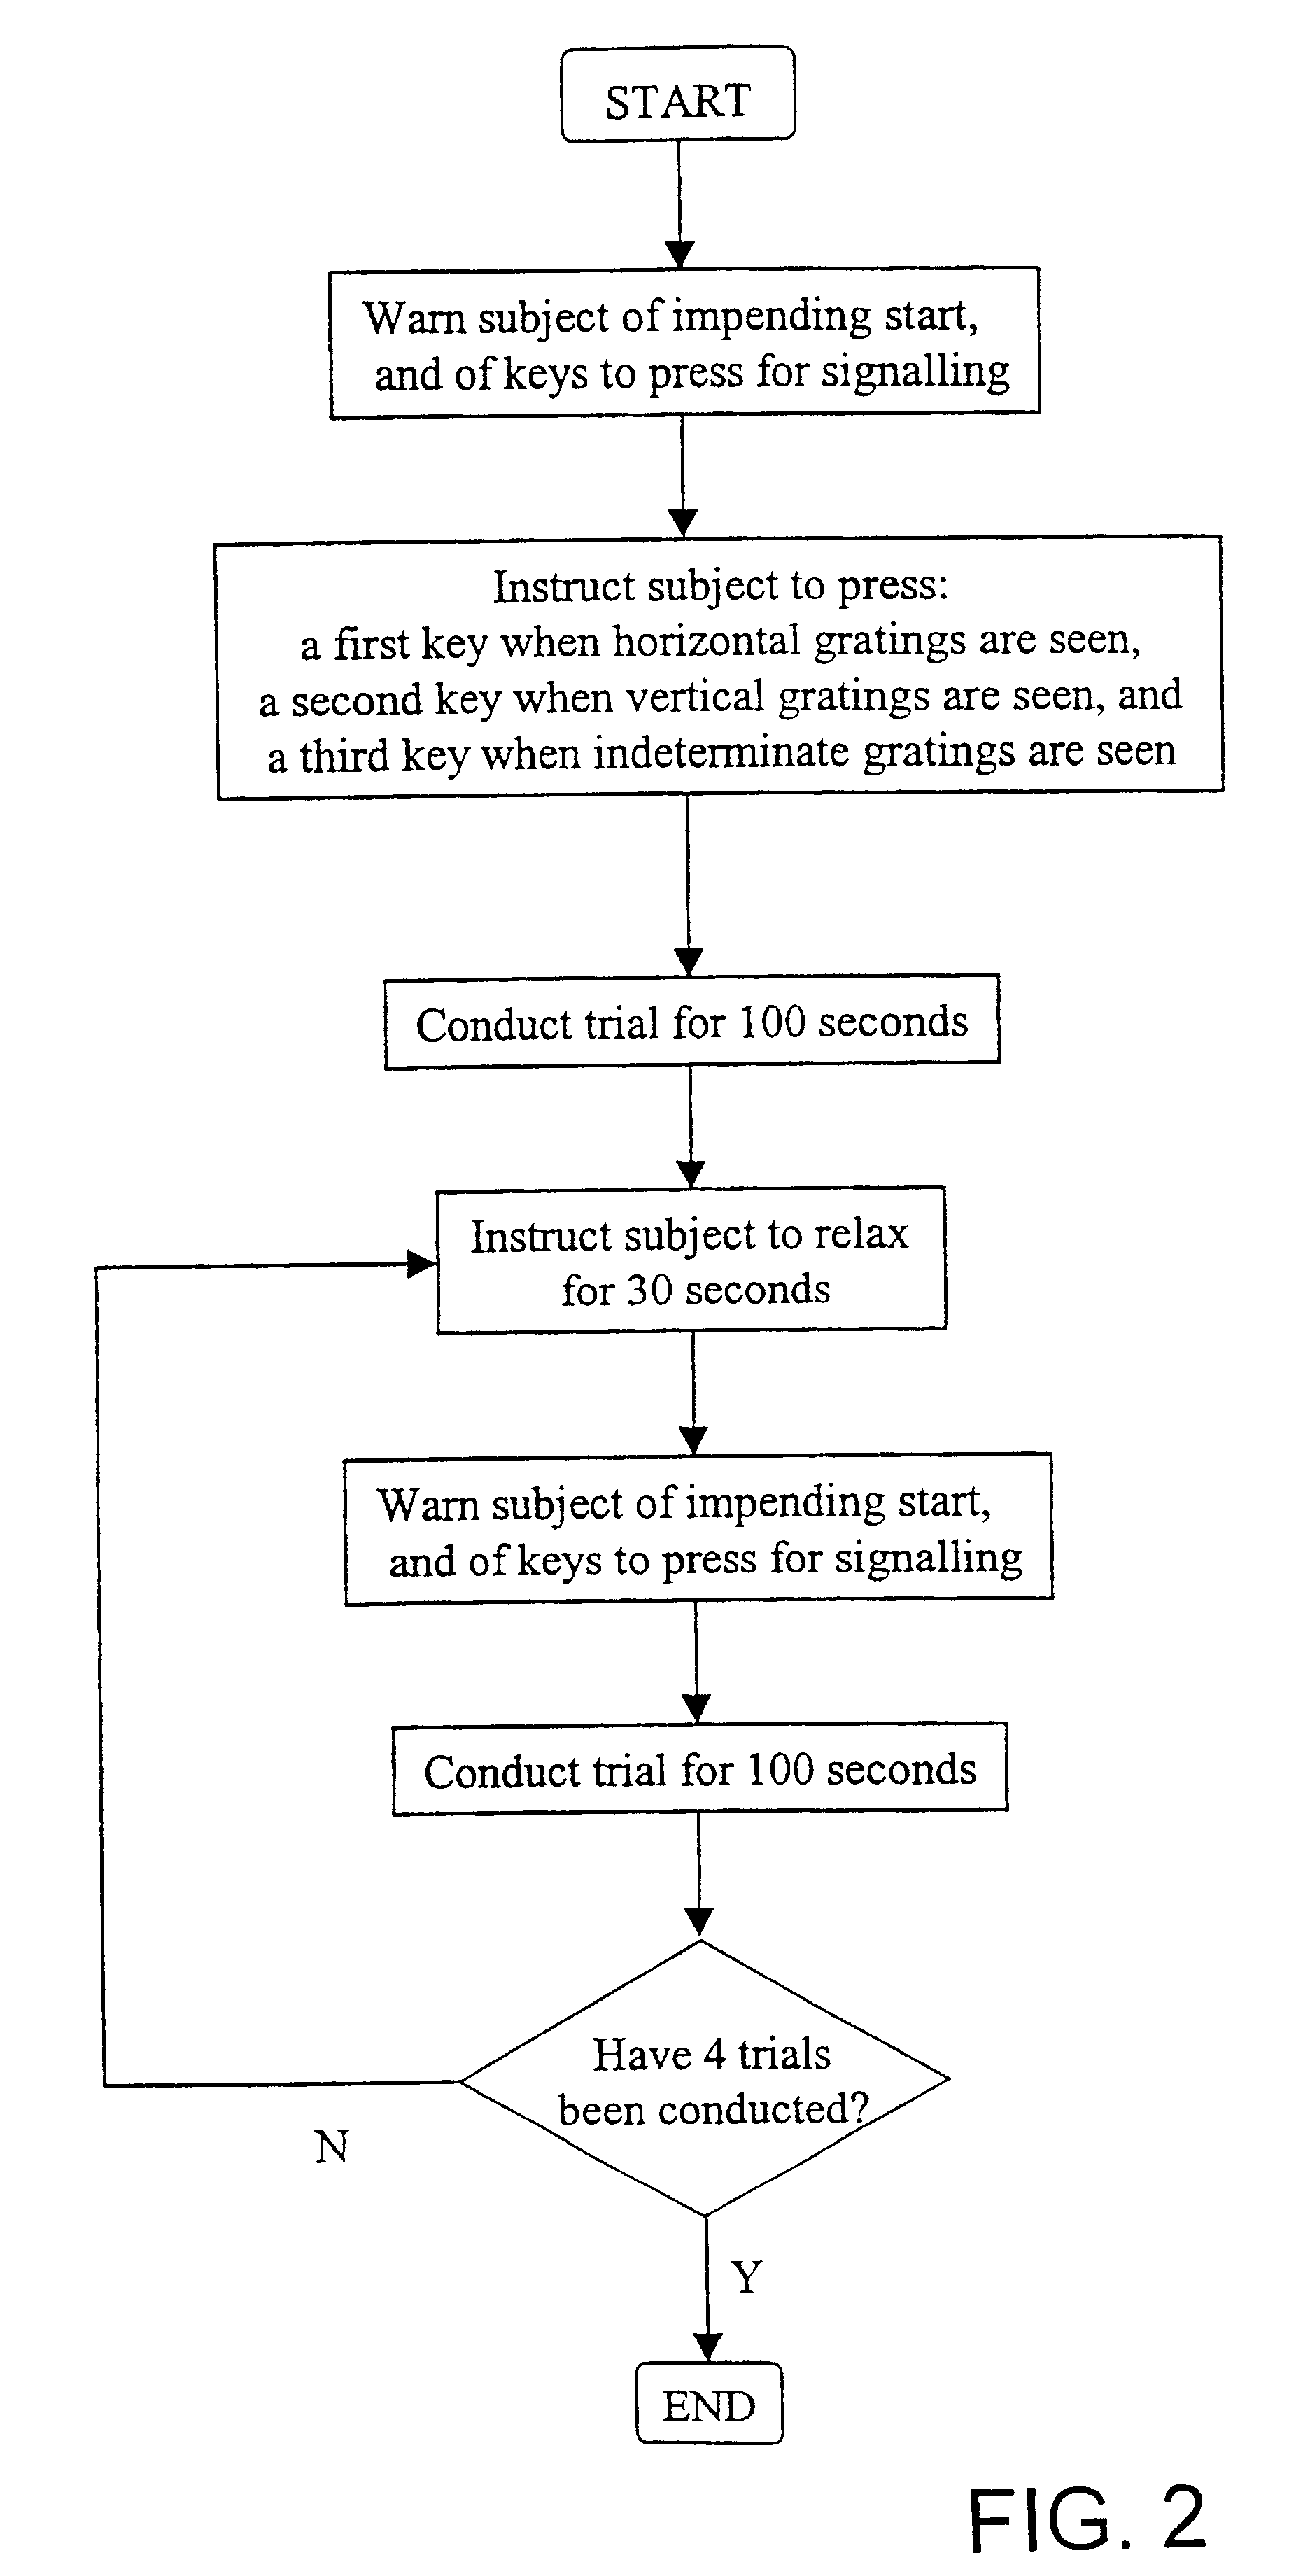
In one embodiment shown in FIG. 1, binocular rivalry is used as an indicator of mood disorder or predisposition therefor. Binocular rivalry is tested with a subject 1 seated three metres from a computer monitor 2 and wearing liquid crystal shutter goggles 3 to enable the presentation of vertical moving lines 4 to the left eye and horizontal moving lines 5 to the right eye. The stimuli subtend 1.5 degrees of visual angle with a spatial frequency of 8 cycles / degree moving at 4 cycles / second. The subject 1 presses one of three response buttons 6 to indicate their perceptual state (horizontal, vertical or mixed / indeterminate percepts). Rivalry testing is conducted over half an hour. There are three blocks of testing, each containing four 100 second trials interspersed with 30 second rests. Each block is interspersed with a two-minute rest. A non-limiting example of a block of testing is given in FIG. 2.

Alternation rate per second is calcu...

example 2

Linkage Studies

The inventors' discovery of slow rivalry alternation rate in individuals with bipolar disorder, and in particular, relatives of individuals with such disorder, is potentially a major breakthrough in understanding the genetics of the disorder. There is no doubt that bipolar disorder is strongly heritable (Mitchell et al, 1993, Aust. & New Zeal. J. Psych. 27:560).

The identification of a trait-dependent marker for bipolar disorder will assist genetic linkage studies, and may lead to the identification of the underlying molecular defect. Gershon and Goldin (1986, Acta Psych Scand 74:113) proposed four basic criteria for markers to be considered risk factors for disease:

i. The biological variable should be associated with the disease at the population level and should clearly separate patients from controls;

ii. Family and twin studies should confirm that the variable is heritable;

iii. It should be a trait rather than a state marker, present in both the acute phase and in r...

example 3

Identifying a Candidate Therapeutic Agent for Alleviating or Preventing Mood Disorders (I)

Binocular Rivalry in Monkeys Detected by their Behavioural Response.

Macaca mulatta monkeys are trained, while wearing liquid crystal shutter goggles, to fixate on a light spot on a computer monitor. They are then taught to pull and hold one of two levers if vertical moving lines are presented to both eyes, and to pull and hold a different lever if horizontal moving lines are presented to both eyes. In addition, they are trained not to respond to the presentation of different blends of horizontal and vertical moving lines. The stimuli subtend 1.5 degrees of visual angle with a spatial frequency of 8 cycles / degree moving at 4 cycles / second. Rewards of juice are provided for successful identification of visual stimuli during periods of random presentation of horizontal moving lines, vertical moving lines, or blended horizontal and vertical moving lines. When animals can accurately identify the dif...


PUM


Abstract

A method for diagnosis of a mood disorder or predisposition therefor in a test subject is disclosed. The method includes the steps of determining an interhemispheric switch rate of the test subject, and comparing the switch rate with a corresponding reference switch rate to diagnose presence or absence of the mood disorder or predisposition therefor. In a preferred embodiment, the interhemispheric switch rate is determined by measuring the rate of binocular rivalry in the test subject. Also disclosed is an apparatus for diagnosis of a mood disorder or predisposition therefor, use of the diagnostic method in genetic linkage studies for the identification of the molecular defect(s) underlying these disorders, and for the identification of compounds which may alleviate such disorders.

Description

THIS INVENTION relates generally to mood disorders. In particular, the present invention is concerned with a method and apparatus for diagnosis of a mood disorder, particularly unipolar and / or bipolar mood disorder, or predisposition therefor. The invention also relates to a process of using the diagnostic method to prevent mood disorders, to identify therapeutic compounds for alleviation of mood disorders, and to identify genetic markers associated with such disorders.A variety of mood disorders exist which compromise to varying degrees the social integration and quality of life of affected individuals. The major forms of mood disorder include bipolar disorder (manic depression) and unipolar disorders (major depression and unipolar mania). Other mood disorders include dysthymic disorder, cyclothymic disorder, seasonal affective disorder and substance-induced mood disorder.Bipolar disorder is a common condition with a lifetime prevalence of 1.2% to 1.6% (Weissman et al. 1988, Psych....

Claims


Application Information

Patent Timeline
IPC IPC(8): A61B5/16B82B1/00
CPCA61B5/165A61B5/16A61B5/163
Inventor MILLER, STEVEN MARKPETTIGREW, JOHN DOUGLAS
Owner QUEENSLAND UNIV OF THE
Why Eureka
Try Eureka