

Method of determining an analyte concentration in a sample from an absorption spectrum
- Summary
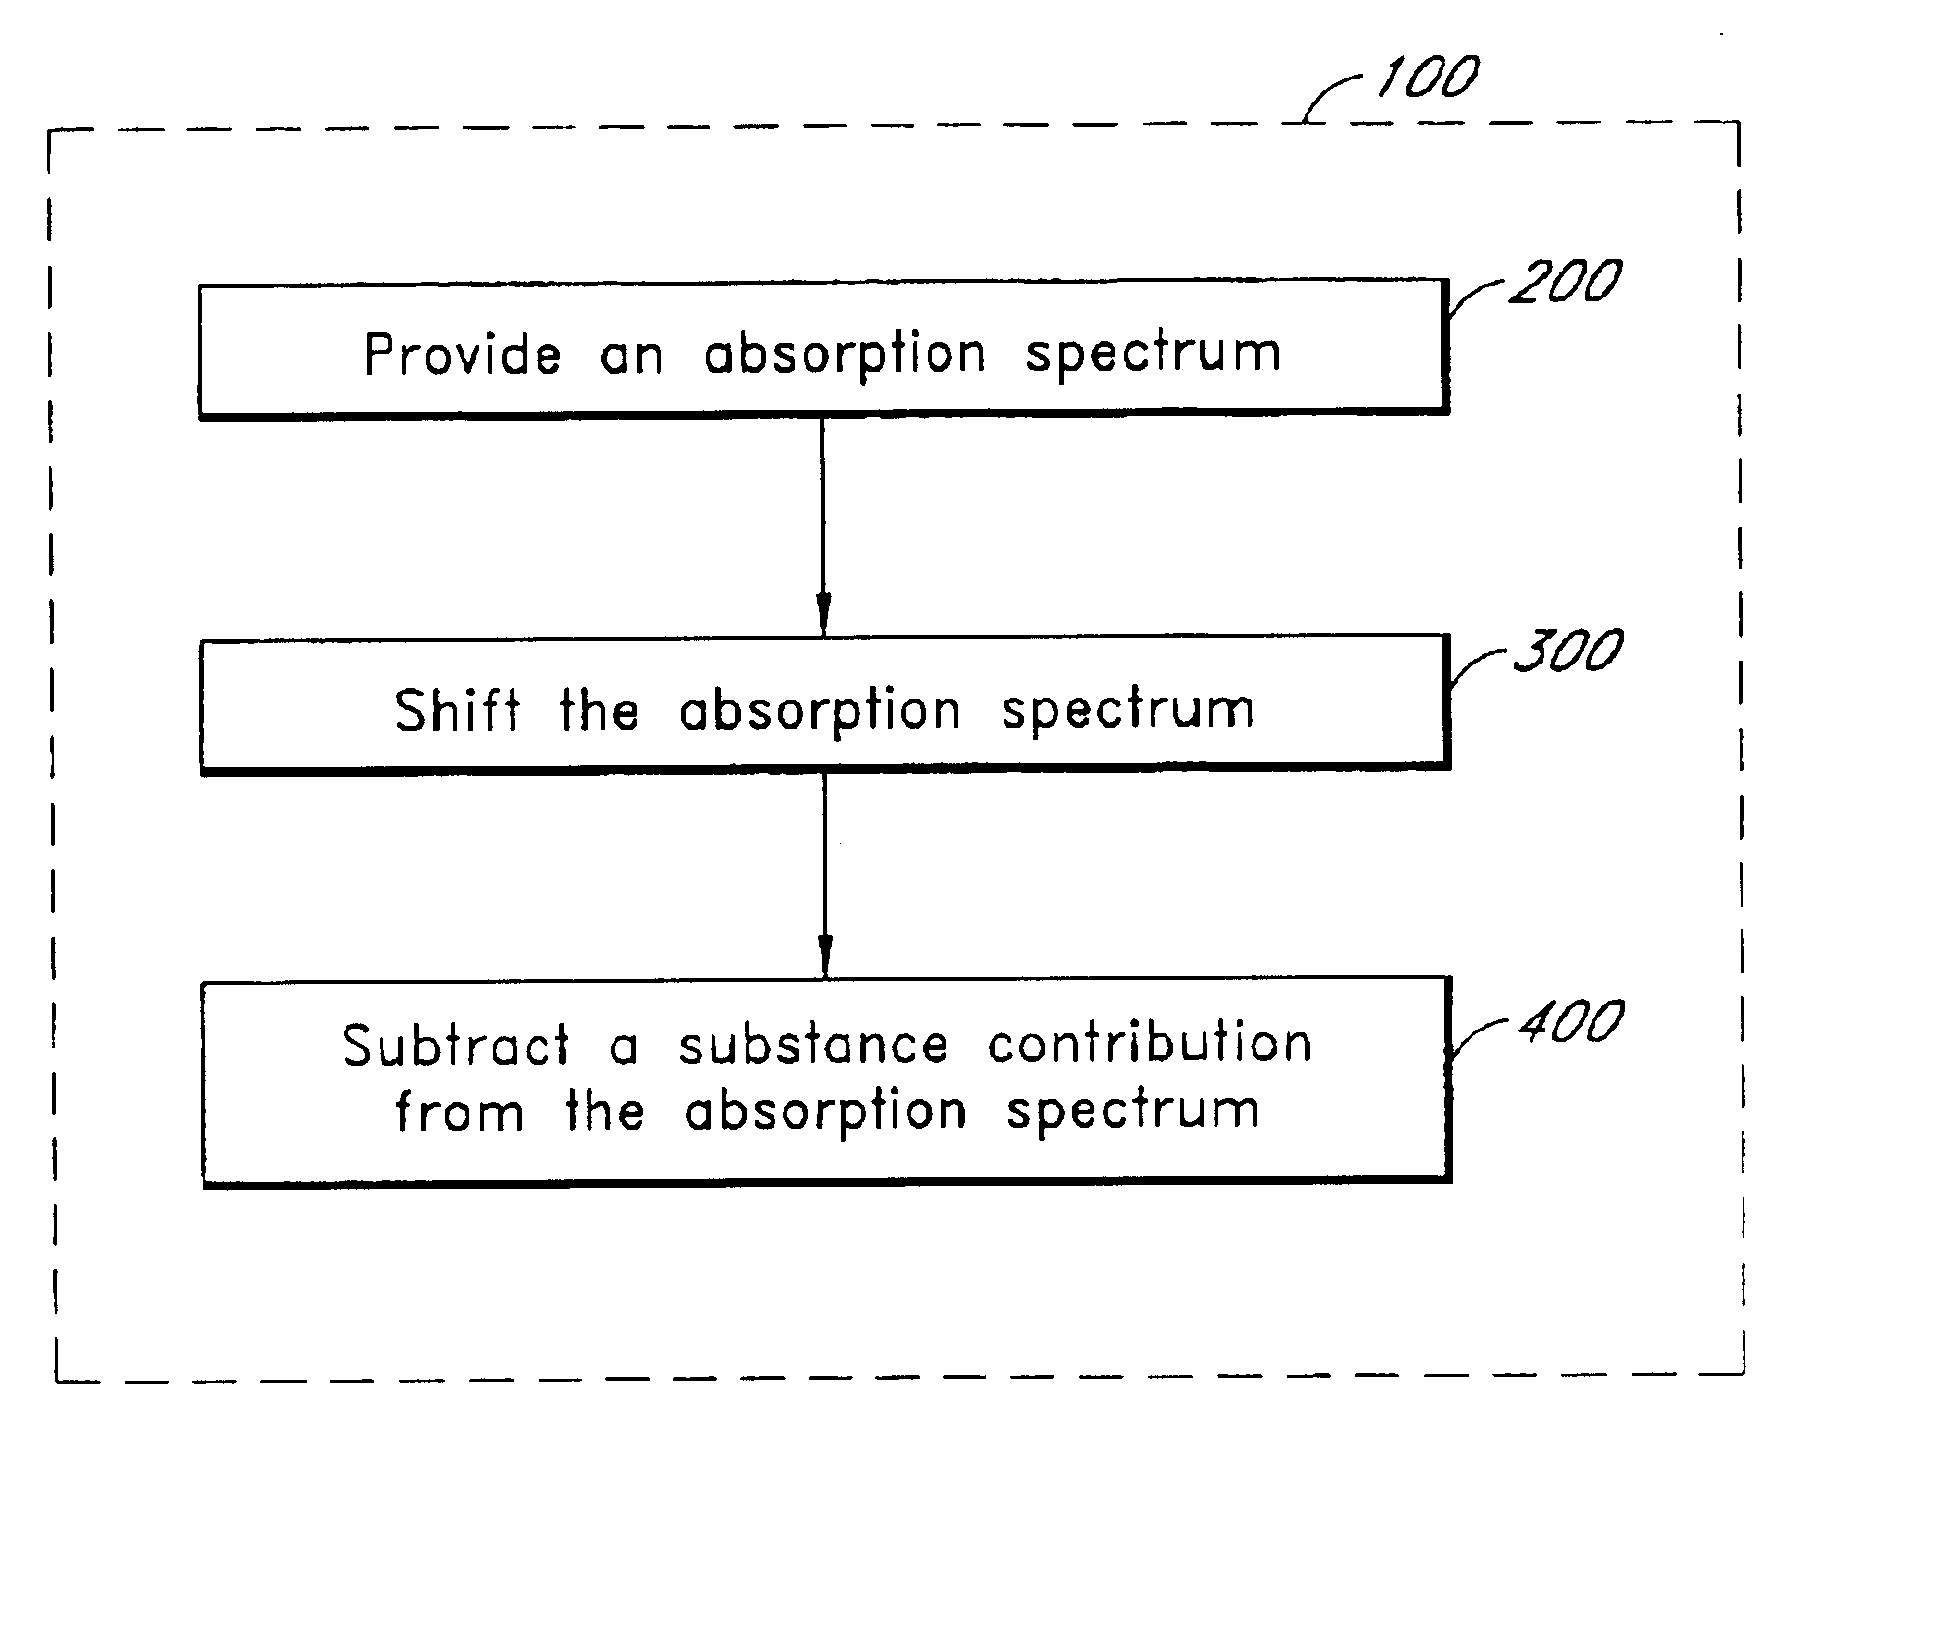
- Abstract
- Description
- Claims
- Application Information
AI Technical Summary
Benefits of technology
Problems solved by technology
Method used
Image

Examples
Embodiment Construction
As will be described further below, absorption data (sometimes called “optical density” or “OD”) from a sample can be used to determine the relative concentrations of the various constituents of the sample. In particular, infrared absorption data from a blood sample can be used to determine the concentrations of various analytes. A specific technique for measuring glucose concentration is described herein, but it will be appreciated that the techniques described below could be used to measure whole blood proteins, urea, lactate, or other sample analytes.
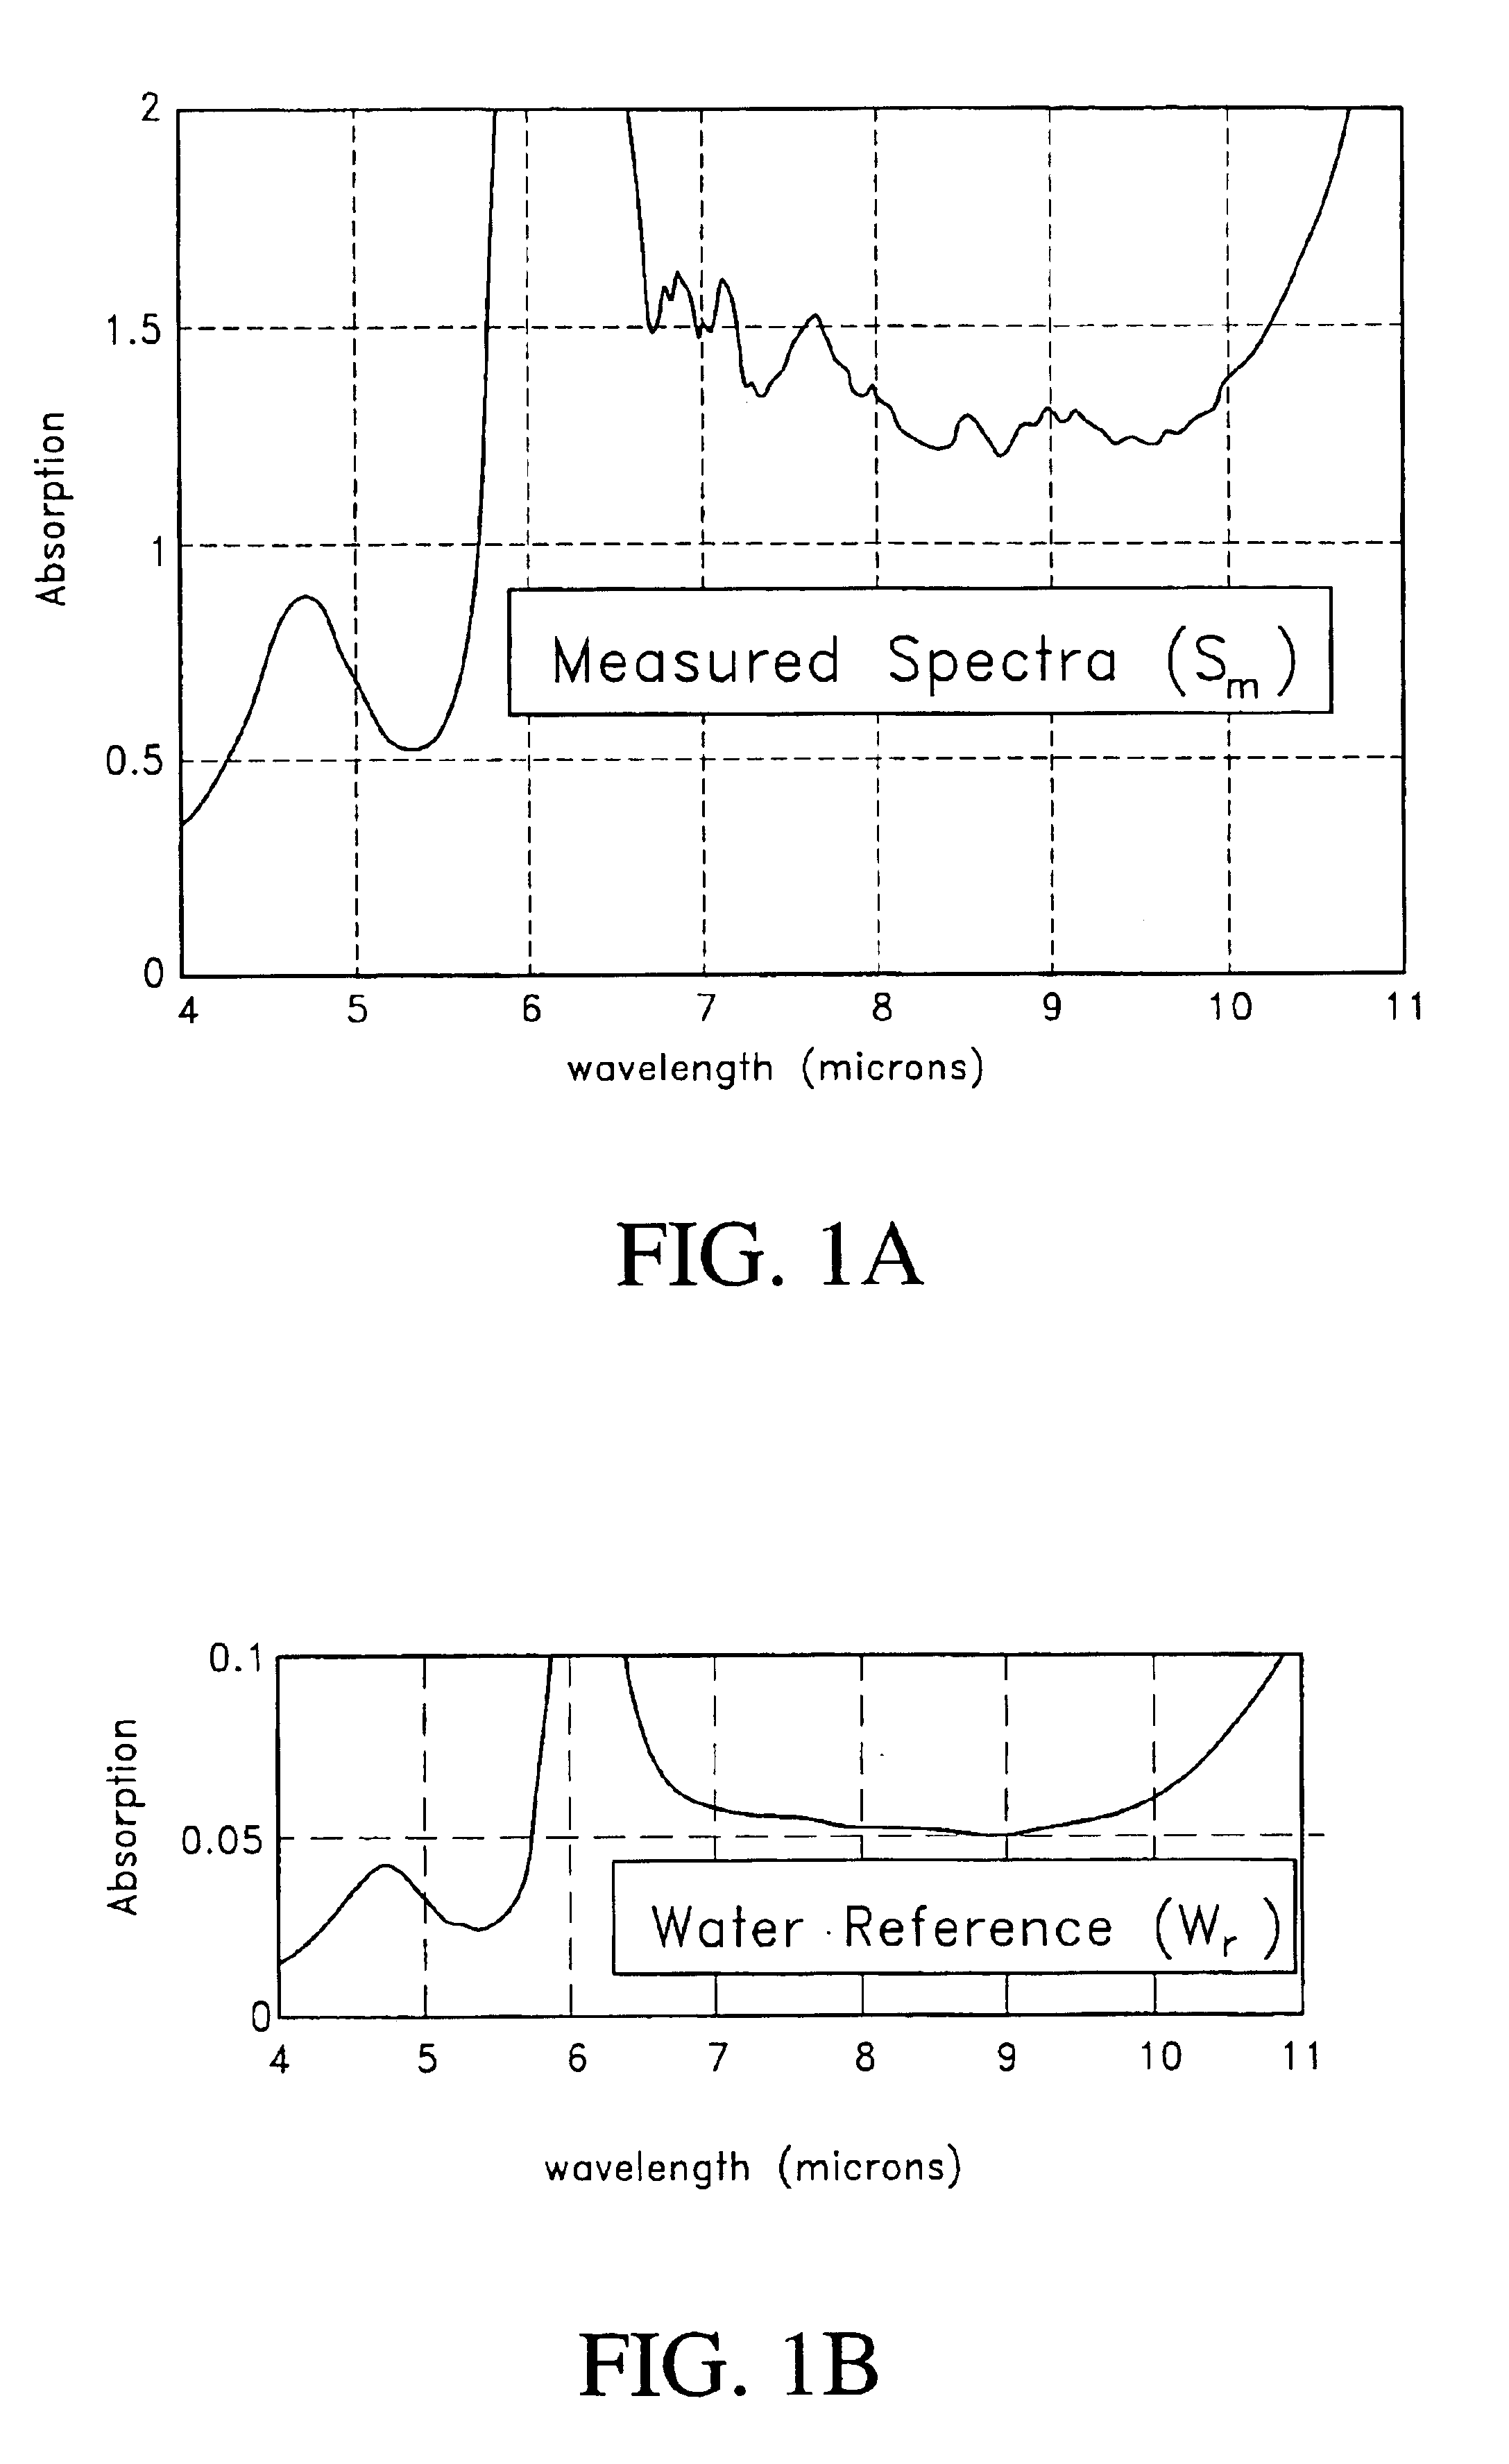
In many measurements, the contribution from the analyte of interest (e.g., glucose) to the measured absorption spectrum is often only a small percentage of the contribution from other substances within the sample. For example, blood by volume is typically composed of about 70% water, about 30% solids, mostly protein, and only about 0.1% glucose. Blood also includes other species such as urea, alanine, and in some cases alcohol or oth...
PUM
 Abstract
Description
Claims
Application Information