System and method for design, tracking, measurement, prediction and optimization of data communication networks

a data communication network and data communication technology, applied in the field of communication networks, can solve the problems of difficult prediction or even measurement of inability to accurately predict the exact performance of a given data communication network. achieve the effect of quick and easy design, measurement, prediction

Inactive Publication Date: 2005-12-06
EXTREME NETWORKS INC
View PDF112 Cites 409 Cited by
  • Summary
  • Abstract
  • Description
  • Claims
  • Application Information

AI Technical Summary

Benefits of technology

[0054]The present invention is capable of predicting, measuring, and optimizing the performance of a data communications network. The invention is capable of representing a detailed layout of a fully deployed or contemplated communications network within a physically accurate computer representation or model of a three dimensional environment. This allows the invention to store measurements and determine performance predictions within a site-specific representation of the physical environment, while using specific information about the network entities, components, subsystems, and systems used to create the actual or contemplated network. Measurement agents, with known or assigned 3-D position locations, are used to measure in-situ performance parameters that are transmitted to a server processor. The server processor has an accurate 3-D model of the environment, and is able to process the measured data, and is also able to provide predictive models using site-specific information that may be independent of or may make use of measured data. The server process is able to communicate with other server processors in a hierarchical manner, such that data fusion from many remote or collocated networks may be assembled and used for display and cataloging of measurements that may or may not be used for creation of predictive performance models. Alternatively, each server processor is able to compute predictive performance models without the use of measured data, by simply considering the site-specific layout of physical components, as well as the specific delay times, transit times, propagation effects, and multipath and noise factors within the physical network.
[0055]The invention can predict throughput, bandwidth, quality of service, bit error rate, packet error rate, frame error rate, dropped packet rate, packet latency, round trip time, propagation delay, transmission delay, processing delay, queuing delay, network capacity, packet jitter, bandwidth delay product and handoff delay time in a site-specific, three dimensional model of any environment. The invention can measure and predict all of the above performance criteria and store the results in the physically accurate three-dimensional model of a data communications network and the environment in which it is installed. Further, the invention can display the measured and predicted performance criteria for any data communications network in the three dimensions, site-specific model of the environment. These capabilities provide a powerful design environment for wired and wireless networks, which allows one skilled in the art to quickly and easily design, measure, predict, optimize and visualize data network communication performance criteria in a three dimensional, site-specific manner using methods never before contemplated.

Problems solved by technology

While conceptually simple, the means of transmitting the data from some point A to some point B are complicated and varied in implementation.
The exact performance of a given data communication network is extremely difficult to predict or even measure because of this complexity and additionally because of the performance effects of the time varying nature of data communications networks and the channels they operate in.
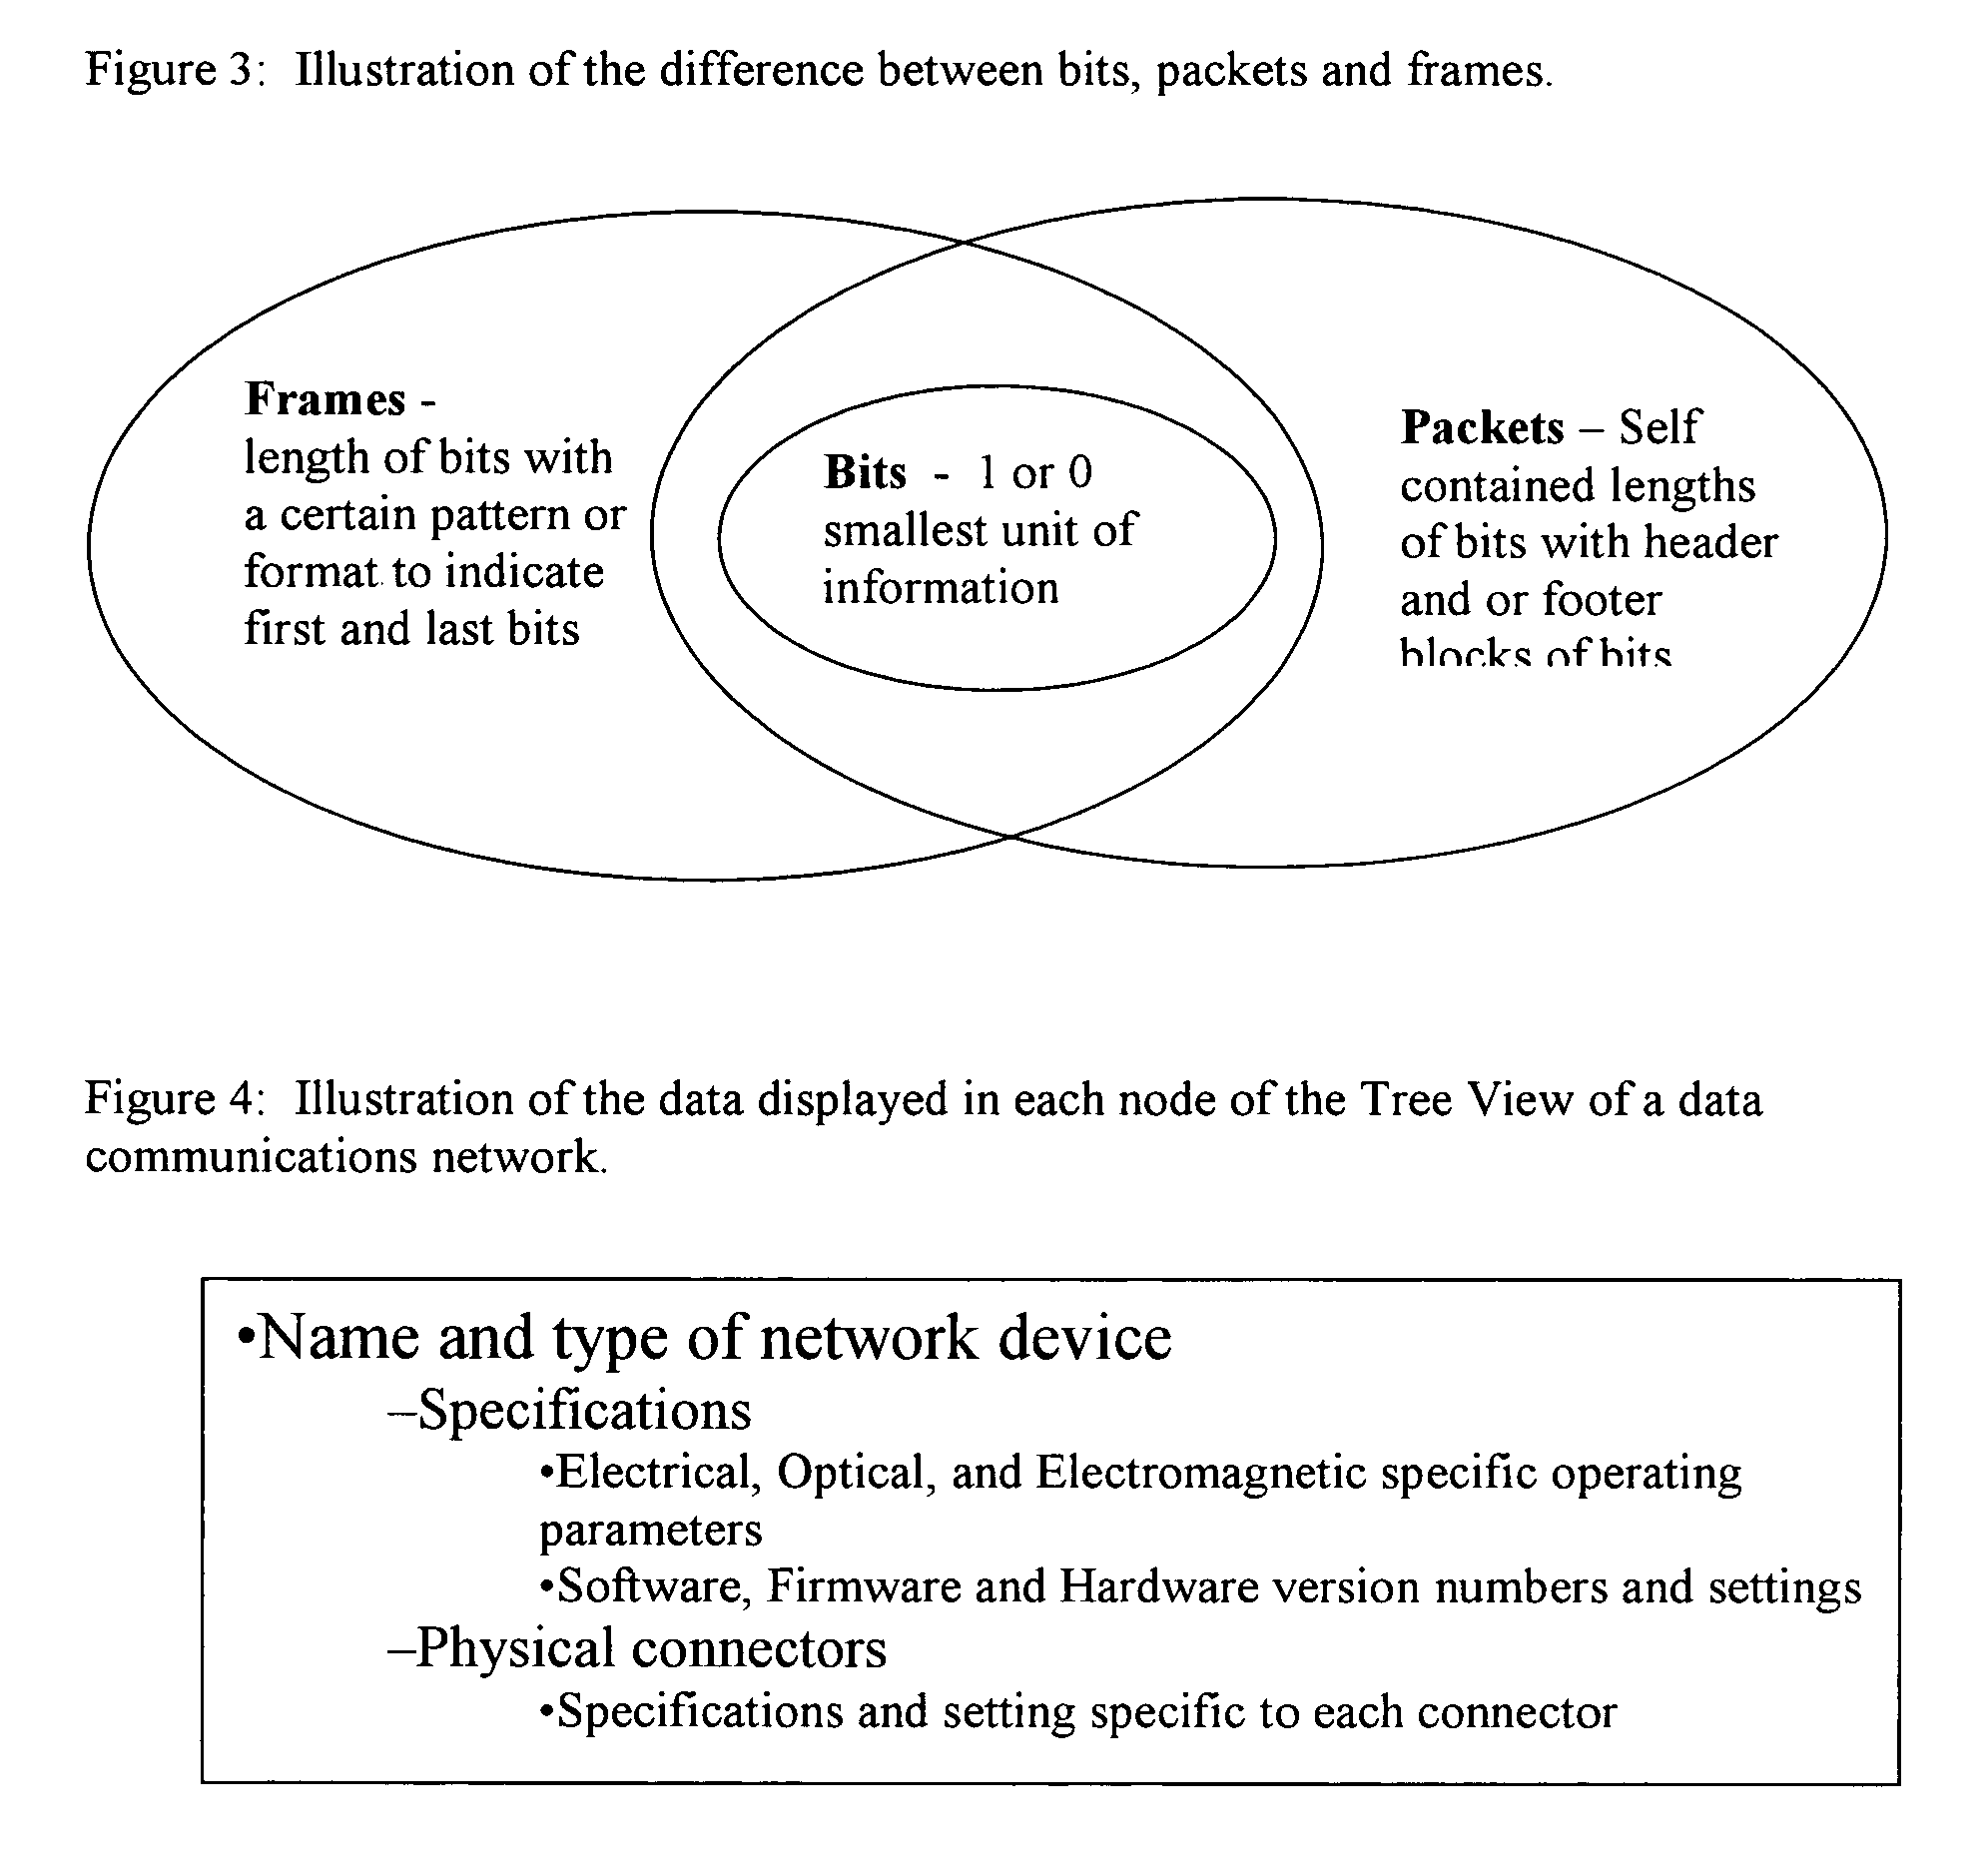
A frame error rate is the percentage of frames that reach the receiver incorrectly or do not reach the receiver as compared to the number of packets sent.
Propagation delay is the time required for a packet to traverse a physical distance from the transmitter to the receiver.
Pathchar is only limited by the network hardware in the links it measures.
This means that hidden links that do not transmit acknowledgements such as Ethernet bridges can not be measured individually by pathchar.
The tool is capable of storing this data in a two dimensional geographic map or floor plan of a building, but can not track devices in a three dimensional manner.
The tool, also, does not provide network testing, measurement or monitoring features, nor does it support communication prediction or performance visualization capabilities for data communication networks.
The software products are unable to predict or measure the performance in a site-specific manner and are not capable of predicting the performance of wireless based data communication networks.
The researchers have not however presented any way to actually predict a bit error rate or throughput from the predicted delay spread profile output by a ray tracing technique.
Thus, these measurements, too, suffer from failing to measure a representative environment.
The researches did not present a model to predict their results nor did they attempt to validate any sort of computer prediction technique.
However, the results do not allow the user to predict the performance in terms of throughput or latency of a wireless LAN.
However, the prior art does not consider methods for properly modeling (e.g. predicting) the complexities that go into determining the values for actual network operating performance parameters that are simultaneously affected by multipath propagation, multiple interfering data transmissions from multiple sources, signaling protocols, equalization methods, and the like.
Predicting bit error rates, data throughput, delay, and quality of service metrics in a 3-D physical model of an actual site-specific environment is a very difficult task, and one which has not been solved heretofore, since different modem vendors have different and often-times proprietary methods for mitigating or dealing with multipath, multiple access interference, protocol type, packet size, and noise.
That is, the state of the art shows how to measure and display and make predictions for basic communication metrics but does not provide specific prediction algorithms for a wide range of important data network performance parameters in a reliable, site-specific manner.
E82-B, No. 10 Oct. 1999 has demonstrated the ability to predict the delay spread of a wireless channel and that the prediction correlates well with throughput, but the described method is not actually able to predict throughput or any other network performance criteria.
While some prior art has demonstrated the ability to track network assets in a two dimensional manner with some physical accuracy, these products have not contemplated the ability to predict future network performance for similar or different physical environments (e.g. installations).
Many products allow the measurement of network performance criteria, but no prior art has contemplated a 3-D representation of the physical environment with the physical installed base of components, for the purpose of predicting network performance parameters.
Furthermore, no tool or invention exists that can directly measure, track the assets of, predict the network performance criteria of, and visualize the network performance criteria of a data communications network in a three-dimensional site-specific manner.
Furthermore, none of the prior art has considered an invention that can perform precise, site-specific, three dimensional performance prediction of complicated network parameters using a priori measurements from an existing network, or by using the site-specific layout details of particular components within a data communications network.
Furthermore, none of the prior art has autonomously measured site-specific network performance parameters from an actual network system or subsystem using a system of agents, and then applying the specific 3-D locations and measured results of those measurement agents to create a 3-D prediction model for future network performance in the same, similar, or different physical environments.
Furthermore, none of the prior art has developed a hierarchical system of measurement and prediction engines, that have the ability to measure network performance parameters in the field and have the ability to produce a predictive engine for network performance parameters that can be shared with remote prediction engines, for the purpose of measuring and predicting network performance in a 3-D site-specific manner.

Method used


Image

  • System and method for design, tracking, measurement, prediction and optimization of data communication networks
  • System and method for design, tracking, measurement, prediction and optimization of data communication networks
  • System and method for design, tracking, measurement, prediction and optimization of data communication networks

Examples


Embodiment Construction

[0064]The present invention contemplates the abilities to design, measure, predict and optimize the performance of a data communication networks. The invention uses an accurate computer generated three-dimensional model of a communications network stored in a computer database environment. The invention allows the user to place the network cables, hubs, routers, switches, bridges, wireless access points, amplifiers, splitters, antennas (point, omnidirectional, directional, leaky feeder, distributed, array, etc.) transceivers, terminators and other communications and computer networking equipment in their actual modeled physical locations. The present invention uses this highly accurate model of the physical layout of infrastructure to allow a user to visualize, predict and optimize the performance of any communication network in any 3-D site specifically modeled physical location.

[0065]The present embodiment of the invention is capable of modeling the site-specific communications ne...


PUM


Abstract

A system and method for design, tracking, measurement, prediction and optimization of data communications networks includes a site specific model of the physical environment, and performs a wide variety of different calculations for predicting network performance using a combination of prediction modes and measurement data based on the components used in the communications networks, the physical environment, and radio propagation characteristics.

Description

CROSS-REFERENCE TO RELATED APPLICATIONS[0001]This application is related to application Ser. No. 09 / 318,842, entitled “Method and System for Managing a Real Time Bill of Materials,” filed by T. S. Rappaport and R. R. Skidmore, now U.S. Pat. No. 6,493,679, Ser. No. 09 / 318,841, entitled “Method And System for a Building Database Manipulator,” filed by T. S. Rappaport and R. R. Skidmore now U.S. Pat. No. 6,850,946, Ser. No. 09 / 318,840, entitled “Method and System For Automated Optimization of Communication component Position in 3D” filed by T. S. Rappaport and R. R. Skidmore, now U.S. Pat. No. 6,317,599. Pending application entitled “Method and System for Designing or Deploying a Communications Network which Allows Simultaneous Selection of Multiple Components” filed by T. S. Rappaport and R. R. Skidmore, Ser. No. 09 / 633,122, filed on Aug. 4, 2000, as well applications entitled “Method and System for Designing or Deploying a Communications Network which Considers Frequency Dependent Ef...

Claims


Application Information

Patent Timeline
Patent Type & Authority Patents(United States)
IPC IPC(8): G06F17/50G06F3/00G06F15/16G06F19/00G06G7/62H04L12/24H04L12/56H04L12/66H04W16/00H04W16/18
CPCH04L41/145H04L41/147H04W16/20H04L41/22H04W16/22H04L12/28
Inventor RAPPAPORT, THEODORESKIDMORE, ROGERHENTY, BENJAMIN
Owner EXTREME NETWORKS INC
Why Eureka
Try Eureka